Dynamical modelling of neoclassical tearing mode
suppression by ECCD
Bircan Ayten1,aand Egbert Westerhof1
FOM Institute DIFFER - Dutch Institute for Fundamental Energy Research, Association EURATOM-FOM, Trilateral Euregio Cluster, PO Box 1207, 3430 BE Nieuwegein, The Netherlands
Abstract. The rotation of a magnetic island through the EC power deposition region in combination with a finite collisional time scale on which the EC power is converted into current are shown to affect the NTM stabilization by ECCD. In particular, the stabilizing term from localized ECCD in the generalized Rutherford equation oscillates at the island rotation frequency. As a consequence, also the island width oscillates at the rotation fre-quency. When the rotation frequency is reduced, these oscillations increase in amplitude and result in a net increase of the time averaged stabilizing effect of ECCD.
1 Introduction
The stabilization of neoclassical tearing modes (NTMs) by electron cyclotron current drive (ECCD) has been studied extensively in the framework of the generalized Rutherford equation (GRE) [1, 2], which describes the evolution of the full widthwof the associated magnetic island. Including only the most relevant terms in the context of the present paper the GRE is written as [1]:
0.82τr
rs dw
dt =rsΔ
0(w)+rsΔbs +rsΔCD, (1)
whereτr = μ0r2s/ηfor the plasma resistivityηat the resonant surface rs of the island.Δ0(w) is the
classical stability index. The driving mechanism of NTMs, which is the perturbation of the bootstrap current, is represented by the second term. The last term refers to the stabilizing effect of ECCD. Conventionally,ΔCDis obtained by averaging the ECCD over an island rotation periodτrot. This
re-quires thatτrot is much shorter than the collisional time scale τcollon which the EC driven current
is generated/decays. When this assumption is not valid, the EC driven currentδJCD becomes time
dependent, oscillating and moving through the island with the rotation period. As a resultΔCD will oscillate with the rotation period as well.
Another relevant time scale is the characteristic time of island evolution,τNT M. When the island
evolution is slow, the time average ofΔCD again yields the conventional expression. However, when the island evolves significantly during a rotation period, the oscillations of ΔCD must be accounted for in the evolution of the island. In this paper we analyze theΔCD oscillations and their dependence on the different time scales, the island size and power deposition width. Furthermore, we study the consequences of theΔCD oscillations for the island evolution and for the minimum power requirement to fully suppress an island. WhenτcollandτNT Mare normalized toτrot, a two dimensional normalized
parameter space results. In this parameter space we recognize two limits. On the one hand the regime of very fast rotation (τNT M/τrot 100) in whichΔCD may be obtained through an average over a
rotation period [3–6]. On the other hand, the locked mode regime (τNT M/τrot 1) in which the island
does not rotate. This work focuses on the rest of the parameter space.
a e-mail:
[email protected] DOI: 10.1051/
C
Owned by the authors, published by EDP Sciences, 2012 epjconf 201232/ 01010
2 Generalized Rutherford equation
We will be presenting the results in terms of a normalized GRE. Time is normalized toτNT Mwhich is
identified with the growth rate coming from the maximum of the bootstrap term, i.e.
τNT M≡
0.82τr rsΔbs,max
. (2)
Spatial scales like island sizes and deposition widths are normalized by rs. The classical stability index
Δ
0 is expressed in terms of the saturated island size,wsat at which the NTM growth saturates in the
absence of other stabilizing effects, i.e.
Δ
0=−Δbs(w=wsat). (3)
Finally, the small island limit of the bootstrap term is supposed to be determined by the effects of incomplete pressure flattening from the competition between parallel and perpendicular transport [7]. This way the GRE is obtained in its following normalized form,
d ¯w d ¯t =−
2 ¯wsatw¯marg
¯
w2
sat+w¯2marg
+ 2 ¯ww¯marg
¯
w2+w¯2 marg
+Δ¯
CD, (4)
where ¯t≡t/τNT M, ¯w≡w/rsand ¯ΔCD=ΔCD/Δbs,max. The contribution of ECCD is written as [4–6]
rsΔCD=−
16μ0Lqrs Bpπw2
∞
−∞dx
dξJCDcosξ
. (5)
To evaluate this term as a function of time a proper equation for the evolution of the driven current density is needed taking into account the effects of rotation and a finite collision time.
This dynamical modelling of the electron cyclotron current drive is performed as follows. The power deposition profile is written as the product of the total power Ptot with a normalized profile
function, ˜pCW(x, ξ) defined as
˜pCW(x, ξ)=
1
Δξπ3/2wdepRrse
−4(r−rdep)2/w2depΠ(ξ), (6)
with a Gaussian radial profile of full widthwdepcentered at rdepand a helical profile defined by the top
hat functionΠ(ξ),
Π(ξ)=1, ωrott−Δξ/2≤ξ≤ωrott+Δξ/2,modulus 2π (7)
Π(ξ)=0, otherwise, (8)
which at t = 0 is centered atξ = 0 with a helical width Δξ. Here,ωrot = 2π/τrot is the angular
rotation frequency of the island. Note, that in this work we will only consider CW application of the ECCD power, with a radial deposition that is perfectly aligned with the resonant radius of the NTM, i.e. rdep=rs.
At this point it is convenient to define the symmetric island topology adopted for this work:Ω= 8x2/w2−cosξis the normalized flux surface label withΩ=−1 at the O-point of the island andΩ=1
at the X-point. Here, x=r−rsis the displacement from the resonant surface. Outside the island the
labelσ=sgn (x) distinguishes the two different surfaces with identicalΩon opposite sides of rs.
Parallel transport is assumed to be virtually instantaneous, such that the driven current density is a flux function. The ECCD efficiency is assumed to be a simple constant,ηCD ≡ICD/Ptot. The driven
current density then depends only on the flux surface averaged power density PEC(Ω,t) as a function
decays on a collisional time scaleτcolland is generated by the instantaneous power deposited on that
surface, i.e.
∂JCD(SΩ, σ,t)
∂t =−
JCD(SΩ, σ,t)
τcoll
+2πRηCD τcoll
PEC(SΩ, σ,t). (9)
Only on those surfaces that are being reconnected due to island growth the current density must be averaged over the two contributing surfaces, while on surfaces that get disconnected due to island shrinkage the current density is conserved:
For Ssep(t−)<SΩ≤Ssep(t+) :
JCDSΩ,t+=
1 2
JCDSΩ, σ=1,t−+JCDSΩ, σ=−1,t−, (10)
where Sseprepresents the enclosed surface area within the separatrix and t−and t+refer to the times
just before and just after the surfaces are reconnected, respectively. For Ssep(t+)<SΩ≤Ssep(t−) :
JCDSΩ, σ=±1,t+=JCDSΩ,t−, (11)
where t−and t+now refer to the times just before and just after the surfaces are disconnected. Equations Eq. (9), Eq. (10) and Eq. (11) describe the time dependent evolution of the driven current in the case of an evolving island.
3
Δ
CDevolution at constant island width
In this section we solve equations Eq. (9) and Eq. (5) for constant island widthw. The results of the
Δ
CDcalculations are normalized to a referenceΔREF, which is obtained in the case where the power is
evenly distributed over all phases of the island andτcoll=0:
Δ
REF ≡ΔCD(Δξ=2π, τcoll=0). (12)
This reference case corresponds toΔCDas obtained conventionally by averaging the power deposition and current drive profiles over a rotation period [4–6]. Whenτcollis different from zero, the EC driven
current takes time to reach a quasi-steady state [8]. Consequently the same holds forΔCD as shown in Fig. 1(a) for a fast rotating island with τcoll = 3τrot andw = wdep. The solid curve represents
the case for which the power is spread evenly over all phases of the island. For t >> τcolla steady
state is reached identical toΔREF. Results forΔCD calculations with a small helical power deposition width of (0.02×2π) are depicted by the dashed curve. The helically localized power deposition results in oscillations of the driven current density profile and ofΔCD at the plasma rotation frequency. For
t>> τcolla quasi-steady state is reached with periodic oscillations ofΔCDaround its reference value.
TheΔCDoscillations in the quasi-steady state are shown in Fig. 1(b) forτcoll/τrot =0, 0.3, 1.0, and∞.
The case ofτcoll/τrot = 0 can also be seen as representing theΔCD efficiency as a function of island
phase in case of a locked mode. As τcoll/τrot increases, the amplitude of the oscillations decreases.
In addition, a phase shift of theΔCDoscillation relative to the island rotation is created. As equations Eq. (9) and Eq. (5) are linear, the time average over a full rotation period of the CD term,< ΔCD>τrot, in the quasi steady state is identical to the reference case: limt→∞
Δ CD τ
rot =
Δ
REF. This is born out by
the numerical calculations up to numerical accuracy.
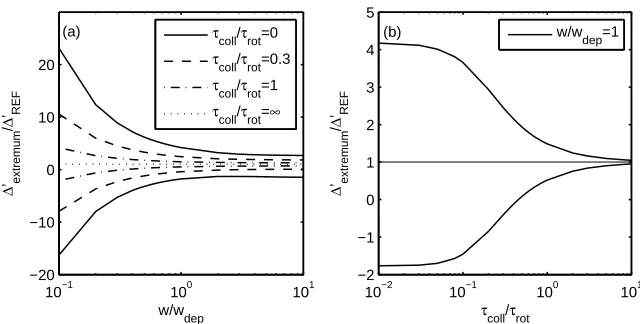
The extrema ofΔCDsimulations at quasi-steady state as a function ofw/wdepfor three different
τcoll/τrotare shown in Fig. 2(a). The results are shown in terms of extrema and not simply the
oscil-lation amplitudes, because the periodicΔCDoscillation is not a simple sinusoidal oscillation around its reference value. Figure 2(b) gives the maximum and the minimum as a function ofτcoll/τrot for
the fixed island width (w = wdep). Forτcoll/τrot < 10−1 the extrema inΔCD are seen to saturate at
a maximum value. Asτcoll/τrot is increased above 10−1, the extrema quickly approach the reference
value, leaving only modest oscillations forτcoll/τrot>1. The amplitude of theΔCDoscillations remain
0 5 10 15 20 25 0 0.2 0.4 0.6 0.8 1 1.2 1.4
time/τrot
Δ
’CD
/
Δ
’REF
helical width=0.02*2π helical width=2π (a)
0 0.5 1 1.5 2
−2 −1 0 1 2 3 4 5 Phase/2π Δ ’CD / Δ ’REF
τcoll/τrot=0 τcoll/τrot=0.3 τcoll/τrot=1 τcoll/τrot=∞ (b)
Fig. 1. (a)ΔCDcalculations forτcoll=3τrotandw=wdepas a function of time till a quasi-steady state is reached. The result of the case where the power is distributed evenly over all phases of the island is given by the solid curve. The dashed curve representsΔCDfor a power deposition helical width 2 % of the whole island helical width. (b)
Δ
CDoscillations in quasi-steady state forΔξ=0.02×2πandw=wdepfor different values ofτcoll/τrot=0, 0.3, 1.0, and∞.
10−1 100 101 −20 −10 0 10 20 w/w dep Δ ’extremum /Δ ’REF
τcoll/τ
rot=0
τcoll/τ
rot=0.3
τcoll/τ
rot=1
τcoll/τ
rot=∞
(a)
10−2 10−1 100 101 −2 −1 0 1 2 3 4 5
τcoll/τ
rot Δ ’ extremum /Δ ’ REF w/w dep=1 (b)
Fig. 2. (a)The dependence of extrema ofΔCD onw/wdepis calculated for differentτcoll/τrotvalues. The dotted line for which theτcoll/τrot =∞is identical to the reference case. (b)Extrema ofΔCD for a fixed island width (w=wdep) as a function ofτcoll/τrot.
4 Dynamical modelling with self consistent island width evolution
We now investigate how the oscillations inΔCD influence the stabilization of NTMs. The GRE is used in its normalized form Eq. (4). A number of cases are selected in the 2D parameter space spanned by
τcoll/τrot andτNT M/τrot. The normalized saturated island, marginal island, and EC deposition width
are chosen as representative of a 2/1 NTM in ITER: ¯wsat = 0.2 and ¯wmarg =0.0125, with a narrow EC power deposition profile ¯wdep = 0.01 and helical width Δξ = 0.02×2π. The reference case
(Δξ=2π, τcoll=0) is used to derive a minimum required power Pminfor NTM stabilization. In Fig. 3
we show the results of the simulations with an ECCD power marginally above Pminforτcoll/τrot =0
and various values ofτNT M/τrot =1,10 and 100. The effect of rotation is an oscillation in the island
0 10 20 30 40 50 60 70 80 90 0
0.02 0.04 0.06 0.08 0.1 0.12 0.14 0.16 0.18 0.2
time /τNTM
island width / resonant radius
PECCD = 1.00*Pmin (CW), τcoll = 0
Reference case
τNTM=10 τrot
τNTM=τrot τNTM=100 τrot
Fig. 3. The island width evolution simulations with a power marginally above Pmin(CW) in the cases of reference,
τNT M/τrot=1,10 and 100, for each of themτcoll/τrot=0. Other parameters are given in the text.
0 10 20 30 40 50 60 70 80
0 0.02 0.04 0.06 0.08 0.1 0.12 0.14 0.16 0.18 0.2
time /τNTM
island width / resonant radius
P
ECCD = 1.00*Pmin (CW), τNTM = 10 τrot
Reference case
τcoll = τrot
τcoll = 0
τcoll = .1 τrot
τcoll = 3 τrot
τcoll = .01 τrot
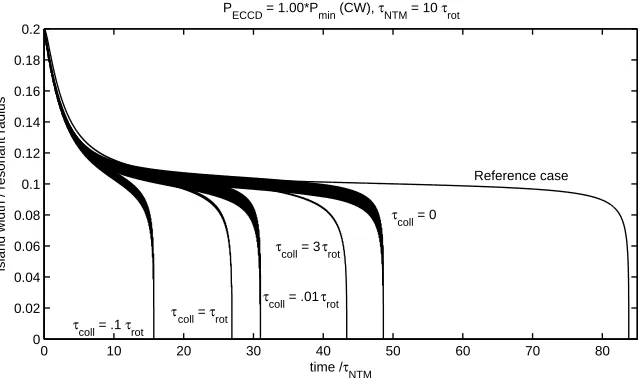
Fig. 4. The island width evolution simulation with a power marginally above Pmin(CW) forτNT M/τrot =10 and differentτcoll/τrotvalues. Additionally, the evolution in the reference case is included.
In a second set of simulations we studied the effect of introducing a finite collision time. To this end, we performed simulations with the same parameters as in case of Fig. 3 andτNT M/τrot =10 but
now for various values ofτcoll/τrot =0, 0.01, 0.1, 1, and 3. As shown by the results given in Fig. 4, the
finite collision time at first results in a further stabilizing effect of the ECCD. The largest stabilizing effect is obtained forτcoll/τrot = 0.1 As the collision time is increased, the oscillations inΔCD and
consequently in the island width are reduced. Also the minimum power required for full suppression is reduced below the value of Pminin the reference case. In case ofτNT M/τrot =1 andτcoll/τrot =0,
the minimum required power for full NTM stabilization is reduced to 95% of Pmin. This effect is larger
5 Conclusion
In this paper the oscillations inΔCDoriginating from the rotation of the island though the EC power deposition region and their dependence onτcoll,τrot, the island size and the power deposition width
have been investigated. Furthermore, their consequences for the island growth or the stabilization are analyzed in the 2D normalized parameter space spanned byτcoll/τrotandτNT M/τrot. This work shows
that the net result of the oscillations inΔCDis a slight increase in the stabilizing effect of ECCD and consequently, a reduction in the minimum power requirement to fully suppress an island.
TheΔCD calculations show that asΔCD is proportional toδJCD, it evolves on the time scale of
τcoll. It takes time forΔCDto reach a quasi-steady state depending on the value ofτcoll. The helically
localized power deposition on a rotating magnetic island leads to oscillations both in the driven current density and in ΔCD at the plasma rotation frequency. Once the quasi-steady state is reached,ΔCD oscillates around its reference value. Because the current drive is assumed to be in the linear regime, the time average over a full rotation period ofΔCDin the case of a constant island width is exactly equal to its reference value regardless of τcoll/τrot. The amplitude of the oscillations increases both with
decreasingτcoll/τrot for a fixed island width as well as with decreasingw/wdepfor a givenτcoll/τrot.
The oscillations inΔCDare damped forτcoll/τrot 10. Furthermore, asτcoll/τrotincreases, the phase
shift of theΔCD oscillation relative to the island rotation increases. The case ofτcoll/τrot = 0 also
represents the efficiency of ΔCD as a function of island phase for a locked mode. The oscillations inΔCD are affected byΔξ as well. The amplitude of these oscillations increases as the helical width decreases saturating for helical widths of 0.2×2πor smaller.
The dynamical modelling with self consistent island width evolution shows that the effect of ro-tation is an oscillation in the island width with the roro-tation period. A decrease in the NTM roro-tation frequency increases the amplitude of this oscillation. The oscillation inΔCDintensifies the net stabi-lizing effect of the ECCD decreasing the time required for full suppression of the mode. Introducing a finite collision time at first provides an extra stabilizing effect. Further increase in the collision time lowers the oscillations inΔCDand also in the island width. Also the minimum power required for full suppression is reduced below the value of Pminin the reference case. The reduction is larger for the
case of wide ECCD deposition.
References
1. R.J. La Haye. Physics of Plasmas, 13(5), May 2006. 2. R. Prater. Physics of Plasmas, 11(5):2349, 2004.
3. F.W. Perkins, R.W. Harwey, M. Mahowski, and M.N. Rosenbluth. In Proc. 24stEPS Conference on Plasma Physics, Berchtesgaden, 9 - 13 June 1997, pages P–III. 1017. ECA vol. 21A, 1997.
4. C.C. Hegna and J.D. Callen. Physics of Plasmas, 4(8):2940–2946, August 1997. 5. O. Sauter. Physics of Plasmas, 11(10):4808–4813, 2004.
6. D. De Lazzari and E. Westerhof. Nuclear Fusion, 49(7):075002, July 2009. 7. R. Fitzpatrick. Physics of Plasmas, 2(3):825–838, March 1995.
8. G. Giruzzi, M. Zabi´ego, T.A. Gianakon, X. Garbet, A. Cardinali, and S. Bernabei. Nuclear Fusion, 39(1):107, 1999.