Diabetes, Metabolic Syndrome and Obesity: Targets and Therapy
Dovepress
O r i g i n A L r e S e A r c h
open access to scientific and medical research
Open Access Full Text Article
evaluation of single nucleotide polymorphisms
of Pro12Ala in peroxisome proliferator-activated
receptor-
γ
and gly308Ala in tumor necrosis
factor-
α
genes in obese Asian indians:
a population-based study
namita Bhagat1,2
Mukta Agrawal1
Kalpana Luthra3
naval K Vikram4
Anoop Misra4
rajeev gupta2
1Department of home Science,
University of rajasthan, Jaipur, rajasthan, india; 2Department of
Medicine, Fortis escorts hospital, Jaipur, rajasthan, india; 3Department
of Biochemistry, All india institute of Medical Sciences, new Delhi, india; 4Department of Medicine,
All india institute of Medical Sciences, new Delhi, india
correspondence: rajeev gupta Department of Medicine, Fortis escorts hospital, Malviya nagar, Jaipur 302017, india Fax +91 141 4008151
email rajeevg@satyam.net.in
Background: A population-based case control study was performed to determine the associations of Pro12Ala polymorphism in peroxisome proliferator-activated receptor-γ (PPARG) and Gly308Ala polymorphism in tumor necrosis factor-α (TNFA) genes in obese subjects. Patients and methods: Of 1,400 eligible subjects, 20 years, we recruited only 1,127. For extreme phenotype case-control design, we evaluated 201 subjects with body mass index (BMI)
30 kg/m2 (Group 1) and 143 with BMI ,20 kg/m2 (Group 2). Clinical, anthropometric,
bio-chemical, and nutritional details and polymorphisms were estimated.
Results: In Group 1, the dietary intake of calories and fats was higher, physical activity was lower, and prevalence of truncal obesity, hypertension, high total cholesterol, low high-density lipoprotein cholesterol, and diabetes was greater than in Group 2. There were no homozygous polymorphisms of either gene. Heterozygous Pro12Ala polymorphism in PPARG was found in 15 (7.5%) subjects in Group 1 and 3 (2.1%) subjects in Group 2 (P = 0.028), and heterozygous Gly308Ala polymorphism in TNFA was found in 19 (9.5%) in Group 1 and 7 (4.9%) in Group 2 (P = 0.115). Presence of heterozygous polymorphism in PPARG and TNFA-predicted obesity with univariate odds ratio ([OR], 95% confidence intervals) of 2.25 (1.32–3.84, P = 0.003) and 1.48 (1.10–1.99, P = 0.009) and with multivariate OR 1.74 (1.03–2.93, P = 0.038) and 1.46 (1.05–2.03, P = 0.024), respectively. The addition of dietary and physical activity variables did not result in significant change.
Conclusion: Obese Asian Indians have greater prevalence of heterozygous polymorphisms of Pro12Ala in PPARG and Gly308Ala in TNFA genes.
Keywords: obesity, Asian Indian, Pro12Ala polymorphism, diet, urban
Introduction
Obesity is emerging as a major public health problem in low income countries including
India.1,2 Early in the 20th century, most populations in which obesity became a public
health problem were in North America and Europe. Recent data show that the largest increases in obesity are in developing countries, such as Mexico, China, and
Thai-land.3,4 Global estimates using both longitudinal and cross-sectional data indicate
that the prevalence of obesity in countries in intermediate development has increased
by 30%–100% over the past decade.3 Serial studies in India have shown a significant
increase in overweight and obesity in urban populations, and some studies have shown
Diabetes, Metabolic Syndrome and Obesity: Targets and Therapy downloaded from https://www.dovepress.com/ by 118.70.13.36 on 21-Aug-2020
For personal use only.
This article was published in the following Dove Press journal: Diabetes, Metabolic Syndrome and Obesity: Targets and Therapy 7 October 2010
Dovepress
Bhagat et al
that the prevalence has almost doubled in the last 20 years.4–6
Significant prevalence of obesity has also been reported
from industrial populations,7 urban slums,8 and among rural
populations9 in India.
There are multiple factors associated with the increase in obesity in developing countries, perhaps the most important being urbanization and globalization of food production
and marketing that result in an obesogenic environment.1,3,10
Obesity has a strong genetic component as well.11 These
genetic differences account for 30%–50% of the variation
in fatness in a population.3 Multiple chromosomal locations,
genes, and genetic polymorphisms have been implicated.11
Although whole-genome analysis techniques have provided important information about chromosomal locations, linkages, and polymorphisms (eg, fat mass and obesity-associated [FTO]
gene),12 the study of single-nucleotide associations (SNPs) are
important for identification of pathophysiological pathways.13
Limited research has been done on associations of SNPs with
obesity in Asian Indians and none has been conclusive.14–18
We performed a population-based epidemiological study in an urban location in India to identify the prevalence
of obesity.19,20 The study used an extreme phenotype
case-control design and compared the prevalence of Pro12Ala
polymorphism in peroxisome proliferator-activated receptor-γ
(PPARG) and Gly308Ala polymorphism in tumor necrosis
factor-α (TNFA) genes in obese (body mass index [BMI]
30 kg/m2) and thin (BMI 20 kg/m2) persons. These
two SNPs were chosen because outside the relationship of FTO gene, these two have the most robust evidence for
obesity.11 Secondly, in India, obesity (especially truncal
obesity) is significantly associated with impaired glucose tolerance and diabetes, and both of these genes have been identified as important in pathobiological pathways that lead to insulin resistance and inflammation in obese subjects. Significant association of these SNPs has previously been reported with type 2 diabetes, insulin resistance, and
cen-tral obesity.11,14–18,21,22 The extreme phenotypic approach
used in this study has been previously evaluated in genetic epidemiological studies and is an important method when
the absolute number of subjects is small.23,24
Methods
A population-based genetic epidemiological study was
performed in an ethnically homogenous group.19 Subjects
belonging to a community that hailed from Punjab region in north India were studied. House-to-house survey was con-ducted to identify obese subjects in this population group and for this the whole population of Punjabi subjects living in that
location was screened. In a previous study, among a similar community at Jaipur, we reported the prevalence of obesity
(BMI 30 kg/m2) of about 25%.20 We, therefore, targeted a
sample size of 1,400 subjects, expecting a response rate of 70%, so that more than 200 obese subjects could be recruited
for the genetic epidemiological study.20 The study was
approved by the institutional ethics committee, and informed consent was obtained from all the participants.
Data collection
A detailed proforma was utilized for data collection. Briefly, we collected information regarding demographic data, past history of major illnesses such as coronary heart disease, hypertension, diabetes or high cholesterol levels,
and smoking or tobacco intake and alcohol intake.25 As the
focus of this case-control genetic epidemiological study
was subjects with high BMI (Group 1, 30 kg/m2) and low
BMI (Group 2, ,20 kg/m2) in this subgroup of subjects
with high and low BMI we performed a detailed dietary evaluation using a validated food frequency questionnaire
and a single 24-hour recall.26 Data from the food frequency
questionnaire were used to identify calorie intake and intake of various macronutrients. Physical activity was inquired
using a previously validated instrument.27 Physical
examina-tion was performed to assess height, weight, waist and hip circumference, and blood pressure (BP) using previously
reported methodology.25 Body fat percent and visceral fat
were analyzed using a Karada Fat-Scan machine (Omron Model No. HBF-362; Omron Healthcare Singapore Pte Ltd, Alexandra Technopark, Singapore) using bioelectric impedance method with this hand-held device. The inputs in the formula are electric resistance, height, weight, age, and gender. Fasting blood sample for glucose and lipid estimation (after overnight fast) was obtained from all the subjects with very low and high BMI. Fasting glucose was determined at a central laboratory using glucose-peroxidase method and external quality control. Quality control measures were also followed for estimation of total cholesterol, high-density
lipoprotein (HDL) cholesterol, and triglycerides.28
Low-density lipoprotein (LDL) cholesterol was estimated using the Friedewald formula.
Diagnostic criteria
The risk factors were classified using standard guidelines.25,29,30
Truncal obesity was defined by waist-to-hip ratio (WHR)
of .0.95 for men and .0.85 for women.20,25 Smokers
included subjects with present or past smoking or any tobacco use. Hypertension was diagnosed when the systolic
Diabetes, Metabolic Syndrome and Obesity: Targets and Therapy downloaded from https://www.dovepress.com/ by 118.70.13.36 on 21-Aug-2020
Dovepress evaluation of single nucleotide polymorphisms of Pro12Ala
or diastolic BP was 140/90 mm Hg on a repeated
single-day measurements or when the individual was a known hypertensive. Dyslipidemia was defined by the presence of
high total cholesterol ($200 mg/dL), high LDL cholesterol
($130 mg/dL), low HDL cholesterol (, 40 mg/dL), or high
triglycerides ($150 mg/dL) according to National
Choles-terol Education Program Adult Treatment Panel-III (ATP-III)
guidelines.30 Diabetes was diagnosed when a subject provided
history of previously diagnosed diabetes or the fasting blood
glucose was 126 mg/dL.
genetic analyses
Blood sample was collected for genetic analyses in groups
with high and low BMI.24 EDTA-anticoagulated venous
blood samples were collected from all study subjects, and the genomic DNA was isolated from whole blood by pro-teinase K digestion followed by ethanol precipitation. DNA
was isolated locally and stored at −70°C. Detection of the
polymorphisms was carried out using amplification and restriction enzyme digestion technique. SNPs of possible
importance in obesity were tabulated (Table 1) and because of financial reasons, we evaluated polymorphisms only in PPARG gene important in adipogenesis and TNFA gene important in inflammatory pathways. In the PPARG gene, we studied the Pro12Ala polymorphisms, and in TNFA gene, the Gly318Ala polymorphism was studied. All the SNP analyses were performed at a national laboratory using previously
described methodologies.31 The Pro12Ala polymorphism
in PPARG gene was genotyped using the upstream primer
5′–GCC AAT TCA AGC CCA GTC-3′ and the downstream
primer 5′–GAT ATG TTT GCA GAC AGT GTA TCA GTG
AAG GAA TCG CTT TCC G-3′. The polymerase chain
reaction (PCR) product was digested overnight using the enzyme BStU1. The Gly318Ala polymorphism in TNFA
gene was genotyped using upstream primer 5′–AGG CAA
TAG GTT TTG AGG GCC AT-3′ and downstream primer
5′–GAG CGT CTG CTG GCT GGG TG-3′. The amplified
product was digested overnight using the restriction enzyme NCo1. The digested PCR products were resolved on 2%–3% agarose gel stained with ethidium bromide. Details including
Table 1 candidate genes and single nucleotide polymorphisms associated with obesity according to biological pathways
Central neuronal signaling pathway
Adipogenesis Energy metabolism and
thermogenesis
Leptin- insulin signaling pathway
Inflammatory cytokines
Hormone signaling pathway
Renin- angiotensin pathway
Undetermined pathways
AgrP AcDc AcP1 ABcc8 iL6 Ar Ace FTO
cArT ADPn DA BTc iL6r ccKAr AgT –
DrD2 APM1 ADrA2B gcgr iL10 crhr1 hSD11B1 –
DrD4 APOA1 ADrB2 iDe LTA cYP11B2 – –
ghrL APOA2 ADrB3 igF2 SerPine1 cYP19A1 – –
gPr24 APOA4 ATP1A2 inS TnF eSr1 – –
hTr1B APOB cAPn10 irS1 – eSr2 – –
hTr2A APOD enPP1 irS2 – ghrhr – –
hTr2c APOe FABP1 LeP – MAOA – –
iDe cBFA2T1 FABP2 LePr – MAOB – –
Mc3r FOXc2 FABP4 PTPrF – MeD12 – –
Mc4r gnB3 FASn reTn – nrOB2 – –
Mc5r inSig2 gAD2 TBc1D1 – ncOA3 – –
nPr3 LDLr gYS1 TcF1 – Pgr – –
nPY LiPc hSPA1B – – SgK – –
nPY2r LiPe PPrgc1A – – SLc6A3 – –
nr3c1 LMnA PTPn1 – – SLc6A14 – –
POMc LPL TUB – – VDr – –
PYY MAcS2 UcP1 – – – – –
Th PLin UcP2 – – – – –
UBL5 POn1 UcP3 – – – – –
Y2r PPArA – – – – – –
– PPArD – – – – – –
– PPArg – – – – – –
– SAh – – – – – –
– ScArB1 – – – – – –
– SOrBS1 – – – – – –
– SreBF1 – – – – – –
Diabetes, Metabolic Syndrome and Obesity: Targets and Therapy downloaded from https://www.dovepress.com/ by 118.70.13.36 on 21-Aug-2020
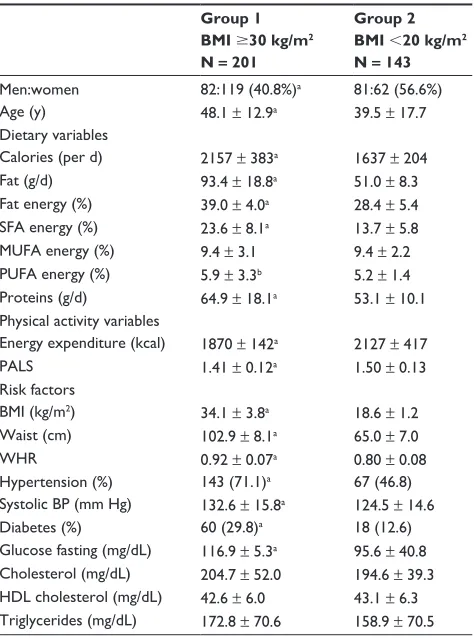
Table 2 Demographic details, lifestyle variables, and cardiovascular risk factors in the study subjects
Group 1 BMI $30 kg/m2
N = 201
Group 2 BMI ,20 kg/m2
N = 143
Men:women 82:119 (40.8%)a 81:62 (56.6%)
Age (y) 48.1 ± 12.9a 39.5 ± 17.7
Dietary variables
calories (per d) 2157 ± 383a 1637 ± 204
Fat (g/d) 93.4 ± 18.8a 51.0 ± 8.3
Fat energy (%) 39.0 ± 4.0a 28.4 ± 5.4
SFA energy (%) 23.6 ± 8.1a 13.7 ± 5.8
MUFA energy (%) 9.4 ± 3.1 9.4 ± 2.2 PUFA energy (%) 5.9 ± 3.3b 5.2 ± 1.4
Proteins (g/d) 64.9 ± 18.1a 53.1 ± 10.1
Physical activity variables
energy expenditure (kcal) 1870 ± 142a 2127 ± 417
PALS 1.41 ± 0.12a 1.50 ± 0.13
risk factors
BMi (kg/m2) 34.1 ± 3.8a 18.6 ± 1.2
Waist (cm) 102.9 ± 8.1a 65.0 ± 7.0
Whr 0.92 ± 0.07a 0.80 ± 0.08
hypertension (%) 143 (71.1)a 67 (46.8)
Systolic BP (mm hg) 132.6 ± 15.8a 124.5 ± 14.6
Diabetes (%) 60 (29.8)a 18 (12.6)
glucose fasting (mg/dL) 116.9 ± 5.3a 95.6 ± 40.8
cholesterol (mg/dL) 204.7 ± 52.0 194.6 ± 39.3 hDL cholesterol (mg/dL) 42.6 ± 6.0 43.1 ± 6.3 Triglycerides (mg/dL) 172.8 ± 70.6 158.9 ± 70.5
Significance level:aP , 0.01; bP , 0.05.
Note: numbers in parentheses are percent. Statistical t-test for continuous variables and chi-square test for ordinal variables.
Abbreviations: BMi, body mass index; SFA, saturated fatty acid; MUFA, monounsaturated fatty acid; PUFA, polyunsaturated fatty acid; PALS, physical activity level score; Whr, waist-to-hip ratio; BP, blood pressure; hDL, high-density lipoprotein.
Dovepress
Bhagat et al
location of SNPs in the respective genes, primer sequences, PCR conditions, and restriction enzymes with product sizes
have been reported earlier.31
Statistical analyses
The numerical variables are reported as mean ± 1 SD, and ordinal variables are reported in percent. Significance of inter-group differences was determined using unpaired t-test for
numerical variables and χ2 test for ordinal variables. Hardy–
Weinberg equilibrium was tested for each of the SNPs based on the genotyping of 440 chromosomes from normal healthy
individuals (average age 35.1 ± 9 years). These were recruited
on a random basis from different locations, including public meeting places, offices, colleges, markets, and hospitals, and
represented population-based controls as reported earlier.32
Pearson’s χ2 test (3 × 2 contingency table) was used to assess
association of SNPs with obesity using the cases (Group 1) and controls (Group 2). Allelic and genotypic associations of SNPs
found significant by the χ2 test were evaluated by computing
odds ratio (OR) and 95% confidence interval (CI). χ2 values
were derived from a series of 2 × 2 contingency tables based
on the frequency of each haplotype vs all others between the two groups. Logistic regression analysis was carried out to correlate various clinical parameters with genotypes and to study pair wise interactions between SNPs of different genes.
P values were subject to Bonferroni’s correction and considered
significant when ,0.05.
Results
The overall response rate in the population study was 80.5%, and 1,127 (men 556, women 571) of 1,400-invited subjects participated in the study. There was a significant prevalence
of cardiovascular risk factors in the overall study subjects.19
In men and women, respectively, smoking or tobacco use was
in 347 (62.4%) and 12 (2.2%), obesity (BMI 25 kg/m2)
in 303 (54.5%) and 350 (61.3%), truncal obesity with high WHR in 339 (61.0%) and 310 (54.30%), and hypertension in 322 (57.9%) and 279 (48.9%). Blood biochemistry results for fasting glucose and lipids were available for 644 subjects (57.1%). High total cholesterol was in 111 (32.6%) men and 120 (39.5%) women, low HDL cholesterol in 103 (30.3%) and 83 (27.3%), high triglycerides in 146 (42.9%) and 132 (43.4%), metabolic syndrome in 166 (48.8%) and 137 (45.1%), and diabetes in 88 (25.9%) and 64 (21.1%), respectively. For the present study, subjects were divided into two groups,
respectively. Subjects with BMI 30 kg/m2 were categorized
into Group 1 (n = 201) and those with BMI 20 kg/m2 as
Group 2 (n = 143). There were more women in Group 1
(119, 59.2%) compared with Group 2 (62, 43.4%; P = 0.004;
Table 2). In Groups 1 vs Group 2, the dietary intake of calo-ries, fat energy percent (en%), saturated fat en%, and proteins was significantly greater. Physical activity measured using physical activity level score (PALS) was greater in Group 2 than in Group 1. In Group 1 vs Group 2, the prevalence (%)
of truncal obesity (49.8 vs 19.6, P , 0.001), hypertension
(71.1 vs 46.8, P , 0.001), high total cholesterol 200 mg/dL
(29.9 vs 18.2, P = 0.006), low HDL cholesterol ,40 mg/dL
(28.9 vs 23.1, P = 0.031), and diabetes (29.9 vs 12.6, P = 0.001)
was significantly greater.
There was no patient with homozygosity in the PPARG or TNFA SNPs in the study Groups (Table 3). The alleles were in Hardy–Weinberg equilibrium. Heterozygous Pro12Ala poly-morphism (AB allele) in PPARG was in 15 (7.5%) subjects in
Group 1 and 3 (2.1%) in Group 2 (P = 0.028), and
heterozy-gous Gly308Ala polymorphism (AB allele) in TNFA was in
Diabetes, Metabolic Syndrome and Obesity: Targets and Therapy downloaded from https://www.dovepress.com/ by 118.70.13.36 on 21-Aug-2020
Dovepress evaluation of single nucleotide polymorphisms of Pro12Ala
19 (9.5%) in Group 1 and 7 (4.9%) in Group 2 (P = 0.115).
Presence of heterozygous polymorphism of PPARG and TNFA genes significantly predicted obesity with
univari-ate OR (95% CIs) of 2.25 (1.32–3.84, P = 0.003) and 1.48
(1.10–1.99, P = 0.009), respectively. These ORs remained
significant after multivariate adjustments for age, gender, and
comorbidities at 1.74 (1.03–2.93, P = 0.038) for AB allele
in PPARG and 1.46 (1.05–2.03, P = 0.024) for AB allele in
TNFA. Addition of dietary and physical activity variables did not result in significant change, suggesting negligible gene-diet or gene-physical activity interactions.
To study the gene-environment interactions, we classified lifestyle variables according to the genetic heterozygosity (Table 4). It was observed that subjects with PPARG AB allele were less physically active and had greater intake of calories and fats. These subjects also had significantly greater BMI, waist size, and WHR. The mean systolic BP and the preva-lence of hypertension were not significantly different among all the three allelic groups. Fasting blood glucose level was
significantly greater in those with PPARG heterozygosity, and the prevalence of diabetes was significantly greater in these subjects. Cholesterol and triglyceride levels also were signifi-cantly greater in these subjects. Subjects with TNFA heterozy-gosity with AB allele or having heterozygous alleles in both the SNPs were also less physically active, consumed more calories and fats, and although BMI and waist size were greater, there was no difference in WHR. The prevalence of hypertension, diabetes and mean lipid levels was not significantly different in groups with either TNFA or both polymorphisms.
Discussion
This is the first study to show that obese Asian Indians residing in north India have significant polymorphisms of heterozygous AB alleles in Pro12Ala in PPARG and in Gly308Ala in TNFA genes. This significance remains after adjustment for comorbidities and dietary and lifestyle variables, suggesting direct pathophysiological influence of these genes. Study of gene–environment interactions shows
Table 3 Distribution of PPArg and TnFA allele polymorphisms in obese and thin subjects
PPARG Pro12Ala polymorphisms TNFA Gly308Ala polymorphisms AA allele BB allele AB allele P value
(χ2 test)
AA allele BB allele AB allele P value (χ2 test)
Obese (BMi $ 30 kg/m2); n = 201 0 0 15 0.028 0 0 19 0.115
Thin (BMi , 20 kg/m2); n = 143 0 0 3 0 0 7
Abbreviations: PPArg, peroxisome proliferator-activated receptor-γ; TnFA, tumor necrosis factor-α.
Table 4 Lifestyle and phenotypic characteristics of study subjects (n = 344) with and without the presence of PPArg and TnFA polymorphisms
PPARG TNFA Both PPARG and TNFA
Present (n = 18)
Absent (n = 326)
Present (n = 26)
Absent (n = 318)
Present (n = 7)
Absent (n = 337)
Men:women 9:9 (50.0) 154:172 (47.2) 11:15 (42.3) 152:166 (47.8) 3:4 (42.8) 160:177 (47.5) PALS 1.48 ± 0.13a 1.56 ± 1.15 1.50 ± 0.18 1.56 ± 1.17 1.47 ± 0.11 1.55 ± 1.10
calorie intake/d 2472 ± 667a 1911 ± 372 2232 ± 526a 1917 ± 391 2581 ± 712a 1927 ± 393
Fat en%/d 40.0 ± 7.5a 34.3 ± 6.9 34.6 ± 8.7 34.5 ± 6.9 40.3 ± 6.4b 34.5 ± 7.0
SFA en%/d 25.5 ± 9.7a 19.2 ± 8.5 21.8 ± 10.4 19.3 ± 8.5 25.5 ± 8.5 19.4 ± 8.7
BMi (kg/m2) 38.0 ± 10.5a 27.1 ± 7.7 33.3 ± 11.1a 27.2 ± 7.8 34.0 ± 10.4a 26.9 ± 7.6
Waist (cm) 108.1 ± 20.6a 86.0 ± 19.5 95.0 ± 24.6b 86.5 ± 19.7 98.4 ± 22.9a 85.8 ± 19.4
Whr 1.01 ± 0.25a 0.88 ± 0.14 0.98 ± 0.23a 0.88 ± 0.13 0.90 ± 0.10 0.87 ± 0.9
hypertension 9 (50.0) 201 (61.6) 15 (57.7) 195 (61.3) 21 (47.7) 189 (63.0)
Systolic BP (mm hg) 128.6 ± 15.9 129.3 ± 15.8 127.9 ± 13.4 129.4 ± 16.0 128.8 ± 13.8 129.3 ± 16.0
Diabetes 18 (100.0)a 60 (18.4) 11 (42.3)b 67 (21.1) 22 (50.0)a 56 (18.7)
glucose fasting (mg/dL) 235.0 ± 65.4a 99.9 ± 35.9 142.8 ± 72.9a 105.5 ± 47.1 155.8 ± 97.9a 82.7 ± 50.1
cholesterol (mg/dL) 220.4 ± 40.9 199.6 ± 47.9 209.5 ± 41.4 200.0 ± 48.2 188.3 ± 66.3 157.4 ± 77.2 hDL cholesterol (mg/dL) 40.8 ± 5.8 42.9 ± 6.1 42.3 ± 5.2 42.8 ± 6.2 38.4 ± 13.1 35.3 ± 17.5 Triglycerides (mg/dL) 223.1 ± 69.5a 164.0 ± 69.5 187.4 ± 72.8 165.7 ± 70.4 168.5 ± 78.5a 125.5 ± 75.9 Significance level:aP , 0.01; bP , 0.05.
Note: numbers in parentheses are percent. Statistical t-test for continuous variables and chi-square test for ordinal variables.
Abbreviations: PPArg, peroxisome proliferator-activated receptor-γ; TnFA, tumor necrosis factor-α; PALS, physical activity level score; SFA, SFA, saturated fatty acid; BMi, body mass index; Whr, waist-to-hip ratio; BP, blood pressure; hDL, high-density lipoprotein.
Diabetes, Metabolic Syndrome and Obesity: Targets and Therapy downloaded from https://www.dovepress.com/ by 118.70.13.36 on 21-Aug-2020
Dovepress
Bhagat et al
that those with PPARG or TNFA polymorphisms consumed more calories and fats, and subjects with PPARG had greater prevalence of diabetes and lipid levels were more. But larger studies are required to confirm these observations.
Over the past two decades, serious efforts were made to unravel genes and genetic markers that predispose to
common obesity.11 The initial epidemiological approaches
have been limited to candidate gene and linkage studies. These approaches have led to the identification of a large number of potential candidate genes and quantitative trait
loci, but very few have been confirmed convincingly.11 The
candidate gene approach is hypothesis-driven and relies on current understanding of the biology and pathophysiology of obesity and related traits. The hypothesis is based on the data derived from animal models, cellular systems, and extreme
or monogenic forms of obesity.3 Genetic variants at these
loci are then tested in population level association studies. The number of genetic association studies has grown expo-nentially over the past 15 years. The latest update of human obesity gene map reports 127 candidate genes associated
with obesity related traits.11,33 Of these, 12 genes (ADIPOQ,
ADRB2, ADRB3, GNB3, HTR2C, NR3C1, LEP, LEPR, PPARG, UCP1, UCP2, and UCP3) have been replicated in
10 or more studies.21 However, the major problem that has
plagued the candidate gene approach is that many of these studies are small (including less than 1,000 individuals)
and, thus, often are underpowered.12 With a small sample
size, positive results do not prove and negative results do
not disprove a true association.24,34 This is a limitation of the
present study also because we studied only 343 subjects. However, this study used an extreme phenotypic case-control design (very high BMI vs very low BMI), and the significant presence of heterozygous polymorphisms suggests possible importance of these genes. However, as there were no subjects with homozygous polymorphisms and the absolute number of AB polymorphisms in cases and controls was small, we sug-gest studies with larger sample sizes to validate these results. These observations, however, are also in consonance with
earlier studies.11 Another issue in genetic epidemiological
studies is genetic heterogeneity, eg, the FTO gene identified
recently using genome-wide association studies35 appears
important mainly in Caucasians and among non-Caucasian
populations variable results have been reported.36,37
Several groups have reported loss-of-function mutations in the ligand-binding domain of human PPARG, specifically
in the adipose-specific PPARG-2.21,23 Inherited lipodystrophic
syndromes caused by PPARG mutations are characterized by altered distribution of subcutaneous fat, insulin resistance,
diabetes, elevated triglycerides, low HDL cholesterol, hypertension, and polycystic ovarian syndrome, but are rare. The most common PPARG genetic variant is a polymorphism replacing alanine with proline at codon 12 (Pro12Ala) in exon
B, which encodes part of the PPARG transactivation domain.38
This variant has an heterozygous allele frequency of 4% in Japanese and can reach up to 28% in white cohorts. Low overall frequency (5.2%) is observed in the present cohort that is consistent with other Asian studies. Multiple gene–gene interactions of PPARG have been reported and increased risk of obesity and diabetes reported for SNPs in APM1g11391A locus, beta-3 adrenergic receptor, interleukin-6, acyl coenzyme
A synthetase, and adiponectin gene loci.38 In the present study,
no interaction was observed with TNFA polymorphism, but because of the small study size and as we did not study the other polymorphisms, we cannot comment on this issue. Gene-environment interactions have also been reported for PPARG with dietary factors and physical activity. The effect of Pro12Ala variant was more apparent in patients with low physical activity, and the effects of polyunsaturated:saturated
fat ratio were additive.38 In this smaller study, we observed that
those with PPARG were less physically active and consumed more calories and fats. Whether PPARG polymorphisms influ-ence physical activity or appetite through known or unknown mechanisms needs more studies. Greater prevalence of dia-betes in those with the presence of homozygous Pro12Ala polymorphisms in PPARG gene and higher total cholesterol and triglyceride levels confirms the well known influence of
PPARG in glucose and lipid metabolism38 and is similar to
earlier studies.11,18,22,38–40 In the present study, we found only
heterozygous Pro12Ala polymorphisms and therefore the results are not comparable with other studies.
TNFA is expressed in adipocytes, and the elevated levels of this cytokine have been linked to obesity and insulin
resis-tance.21 Several population-based studies among Caucasian
subjects have reported association of Gly380Ala SNP in TNFA
gene and obesity but some have reported no association.41–44
On one hand, Brand et al41 studied 176 German Caucasian
subjects for this polymorphism and reported a significant association of this polymorphism with high BMI levels
(P = 0.013). These findings were replicated in some more
studies.42,43 On the other hand, Corbolan et al44 failed to report
a significant association of this polymorphism with BMI in
Spanish Caucasians subjects (n = 313). Similarly, some
stud-ies reported a positive association of this polymorphism with waist size and WHR, whereas others failed to confirm this
association.11 This study has greater sample sizes than most of
above-mentioned studies, and there is a significant association.
Diabetes, Metabolic Syndrome and Obesity: Targets and Therapy downloaded from https://www.dovepress.com/ by 118.70.13.36 on 21-Aug-2020
Dovepress evaluation of single nucleotide polymorphisms of Pro12Ala
Larger studies are needed to confirm these observations as there is a physiological role of TNFA system in obesity and related
metabolic complications.45
Obesity is an important emerging issue in developing
countries.3,10 It is predicted that obesity-related syndromes
can lead to decline in life expectancy.46 Obesity is considered
a heritable neurobehavioral disorder that is highly sensitive
to environmental conditions.47 Large-scale molecular
approaches shall continue to identify genetic factors
important in predisposition to obesity.11 Clinical significance
of such associations needs further studies.
Disclosure
The authors report no conflicts of interest in this work.
References
1. Caballero B. The global epidemic of obesity: an overview. Epidemiol Rev. 2007;29:1–5.
2. Lopez AD, Mathers CD, Ezzati M, Jamison DT, Murray CJL. Global and regional burden of disease and risk factors, 2001: systematic analysis of population health data. Lancet. 2006;367:1747–1757.
3. Haslam DW, James WPT. Obesity. Lancet. 2005;366:1197–1209. 4. Misra A, Khurana L. Obesity and the metabolic syndrome in developing
countries. J Clin Endocrinol Metab. 2008;93 Suppl 1:S9–S30. 5. Gupta R, Joshi PP, Mohan V, Reddy KS, Yusuf S. Epidemiology and
causation of coronary heart disease and stroke in India. Heart. 2008; 94:16–26.
6. Gupta R, Gupta VP, Bhagat N, et al. Obesity is a major determi-nant of coronary risk factors in India: Jaipur Heart Watch Studies. Indian Heart J. 2008;60:26–33.
7. Reddy KS, Prabhakaran D, Chaturvedi V, et al. Methods for establishing a surveillance system for cardiovascular diseases in Indian industrial populations. Bull World Health Organ. 2006;84:461–469.
8. Misra A, Sharma R, Pandey RM, Khanna N. Adverse profiles of dietary nutrients, anthropometery and lipids in urban slum dwellers of north India. Eur J Clin Nutr. 2001;55:727–733.
9. Reddy KS, Prabhakaran D, Shah P, Shah B. Differences in body mass index and waist hip ratios in north Indian rural and urban populations. Obesity Rev. 2002;3:197–202.
10. Popkin BM, Gordon-Larsen P. The nutrition transition: worldwide obesity dynamics and their determinants. Int J Obes. 2004;28:S2–S9. 11. Yang W, Kelly T, He J. Genetic epidemiology of obesity. Epidemiol Rev.
2007;29:49–61.
12. Christensen K, Murray JC. What genomewide association studies can do for medicine. N Engl J Med. 2007;356:1094–1097.
13. McCarthy MI, Abecasis GR, Cardon LR, et al. Genome-wide association studies for complex traits: consensus, uncertainty and challenges. Nat Rev Genet. 2008;9:356–369.
14. Renges HH, Wile DB, McKeigue PM, Marmot MG, Humphries SE. Apolipoprotein B gene polymorphisms are associated with lipid levels in men of South Asian descent. Atherosclerosis. 1991;91:267–275. 15. Saha N, Tay JS, Heng CK, Humphries SE. DNA polymorphisms of the
apolipoprotein B gene are associated with obesity and serum lipids in healthy Indians in Singapore. Clin Genet. 1993;44:113–120. 16. Radha V, Vimaleswaran KS, Ayyappa KA, Mohan V. Association of
lipoprotein lipase gene polymorphisms with obesity and type 2 diabetes in an Asian Indian population. Int J Obes. 2007;31:913–918. 17. Vimaleswaran KS, Radha V, Ramya K, et al. A novel association of a
polymorphism in the first intron of adiponectin gene with type 2 dia-betes, obesity and hypoadiponectinemia in Asian Indians. Hum Genet. 2008;123:599–605.
18. Sanghera DK, Ortega L, Han S, et al. Impact of nine common type 2 diabetes risk polymorphisms in Asian Indian sikhs: PPARG2 (Pro12Ala), IGF2BP2, TCF7L2 and FTO variants confer a significant risk. BMC Med Genet. 2008;9:59.
19. Gupta R, Bhagat N, Misra A, et al. Trends in prevalence of coronary risk factors in an urban Indian population: Jaipur Heart Watch-4. Indian Heart J. 2007;59:346–353.
20. Gupta R, Sarna M, Thanvi J, Rastogi P, Kaul V, Gupta VP. High prevalence of multiple coronary risk factors in punjabi bhatia community: Jaipur Heart Watch-3. Indian Heart J. 2004;57:646–652.
21. Li S, Loos RJF. Progress in the genetics of common obesity: size matters. Curr Opin Lipidol. 2008;19:113–121.
22. Yong EL, Li J, Liu MH. Single gene contributions: genetic variants of peroxisome proliferator activated receptor and mechanisms of dyslipidemias. Curr Opin Lipidol. 2008;19:106–112.
23. Cordell HJ, Clayton DG. Genetic association studies. Lancet. 2005; 366:1121–1131.
24. Hattersley AT, McCarthy MI. What makes a good genetic association study? Lancet. 2005;366:1315–1323.
25. Gupta R, Gupta VP, Sarna M, et al. Prevalence of coronary heart disease and risk factors in an urban Indian population: Jaipur Heart Watch-2. Indian Heart J. 2002;54:59–66.
26. Singhal S, Goyle A, Gupta R. Quantitative food frequency questionnaire and assessment of dietary intake. Natl Med J India. 1998;11: 268–275.
27. Bharathi AV, Sandhya N, Vaz M. The development and characteristics of a physical activity questionnaire for epidemiological studies in urban middle class Indian. Indian J Med Res. 2000;111:95–102.
28. Gupta R, Prakash H, Kaul V. Cholesterol lipoproteins, triglycerides, rural-urban difference and prevalence of dyslipidaemias among males in Rajasthan. J Assoc Physicians India. 1997;45:275–279.
29. Cannon CP, Battler A, Brindis RG, et al. Key elements and data definitions for measuring the clinical management and outcomes of patients with acute coronary syndromes: a report of the American College of Cardiology Task Force on Clinical Data Standards. J Am Coll Cardiol. 2001;38:2114–2130.
30. National Cholesterol Education Program. Detection, evaluation and treatment of high blood cholesterol in adults (Adult Treatment Panel III). Circulation. 2002;106:3143–3421.
31. Bhushan B, Guleria R, Misra A, Luthra K, Vikram NK. TNF-alpha gene polymorphism and TNF-alpha levels in obese Asian Indians with obstructive sleep apnea. Respir Med. 2008;103: 386–392.
32. Prasad PP, Tiwari AK, Prasanna kumar KM, et al. Chronic renal insuf-ficiency in individuals with type 2 diabetes:I. Role of RAAS gene polymorphisms. BMC Med Genet. 2006;7:42.
33. Kelly T, Yang W, Chen CS, Reynolds K, He J. Global burden of obesity in 2005 and projections to 2030. Int J Obes. 2008;32: 1431–1437.
34. Garcia-Closas M, Wacholder S, Caporaso N, Rothman N. Inference issues in cohort and case-control studies of genetic effects and gene-environment interactions. In: Khoury MJ, Little J, Burke W, editors. Human Genome Epidemiology. Oxford, UK: Oxford University Press; 2004: 127–144.
35. Frayling TM, Timpson NJ, Weedon MN, et al. A common variant in the FTO gene is associated with body mass index and predisposes to childhood and adult obesity. Science. 2007;316:889–894.
36. Li H, Wu Y, Loos RJF, et al. Variants in the fat mass and obesity associated (FTO) gene are not associated with obesity in a Chinese Han population. Diabetes. 2008;57:264–268.
37. Ng MC, Park KS, Oh B, et al. Implication of genetic variants near TCF7L2, SLC30A8, HHEX, CDKAL1, CDKN2A/B, IGF2BP2, and FTO in type 2 diabetes and obesity in 6,719 Asians. Diabetes. 2008; 57:2226–2233.
38. Semple RK, Chatterjee VK, O’Rahilly S. Peroxisone proliferator activated receptor gamma and human metabolic disease. J Clin Invest. 2006;116:581–589.
Diabetes, Metabolic Syndrome and Obesity: Targets and Therapy downloaded from https://www.dovepress.com/ by 118.70.13.36 on 21-Aug-2020
Diabetes, Metabolic Syndrome and Obesity: Targets and Therapy
Publish your work in this journal
Submit your manuscript here: http://www.dovepress.com/diabetes-metabolic-syndrome-and-obesity-targets-and-therapy-journal
Diabetes, Metabolic Syndrome and Obesity: Targets and Therapy is an international, peer-reviewed open-access journal committed to the rapid publication of the latest laboratory and clinical findings in the fields of diabetes, metabolic syndrome and obesity research. Original research, review, case reports, hypothesis formation, expert
opinion and commentaries are all considered for publication. The manuscript management system is completely online and includes a very quick and fair peer-review system, which is all easy to use. Visit http://www.dovepress.com/testimonials.php to read real quotes from published authors.
Dovepress
Dovepress
Bhagat et al
39. Tonjes A, Schlotz M, Loeffler M, Stumvoll M. Association of Pro12Ala polymorphism in peroxisone proliferator activated receptor gamma with prediabetic phenotypes: meta-analysis of 57 studies on non-diabetic individuals. Diabetes Care. 2006;29:2489–2497.
40. Ludovico O, Pellegrini F, Di Paola R, et al. Heterogenous effect of peroxisone proliferator activated receptor gamma Pro12Ala variant on type 2 diabetes risk. Obesity. 2007;15:1076–1081.
41. Brand E, Schorr U, Kunz I, et al. Tumor necrosis factor alpha 308 G/A polymorphisms in obese Caucasians. Int J Obes Relat Metab Disord. 2001;25:581–585.
42. Hoffstedt J, Erilsson P, Hellstrom L, Rossner S, Ryden M, Arner P. Excessive fat accumulation is associated with the TNF alpha 308 G/A promoter polymorphism in women but not in men. Diabetologia. 2000;43:117–120.
43. Walston J, Seibert M, Yen CJ, Cheskin LJ, Andersen RE. Tumor necrosis factor alpha −238 and −308 polymorphisms do not associated with traits related to obesity and insulin resistance. Diabetes. 1999;48: 2096–2098.
44. Corbolan MS, Marti A, Forga L, Patino A, Martinez-Gonzales MA, Martinez JA. Influence of two polymorphisms of the tumoral necrosis factor-alpha gene on the obesity phenotype. Diabetes Nutr Metab. 2004;17:17–22.
45. Cawthorn WP, Sethi JK. TNF-alpha and adipocyte biology. FEBS Lett. 2008;582:117–131.
46. Olshansky SJ, Passaro DJ, Hershow RC, et al. A potential decline in life expectancy in the United States in the 21st century. N Engl J Med. 2005;352:1138–1145.
47. O’Rahilly S, Farooqi IS. Human obesity: a heritable neurobehavioral disorder that is highly sensitive to environmental conditions. Diabetes. 2008;57:2905–2910.
Diabetes, Metabolic Syndrome and Obesity: Targets and Therapy downloaded from https://www.dovepress.com/ by 118.70.13.36 on 21-Aug-2020