Article
1
Modelling, parameters identification and
2
experimental validation of a lead acid battery bank
3
using genetic algorithms
4
H. Eduardo Ariza 1, Edison Banguero2, Antonio Correcher 3, Ángel Pérez-Navarro4 and Francisco
5
Morant5
6
1 Grupo de Investigación en Sistemas Inteligentes, Corporación Universitaria Comfacauca, Popayán CP
7
190003, Colombia; [email protected]
8
2 Instituto de Automática e Informática Industrial-ai2, Universitat Politècnica de València, Valencia, CP
9
46022, Spain; [email protected] (E.B); [email protected] (A.C.); [email protected] (F.M.);
10
3 Instituto Universitario de Ingeniería Energética - IUIIE, Universitat Politècnica de València, Valencia, CP
11
46022, Spain; [email protected] (A.N.)
12
* Correspondence: [email protected]; Tel +57-2838-6000
13
14
15
Abstract: Accurate and efficient battery modeling is essential to maximize the performance of
16
isolated energy systems and to extend battery lifetime. This paper proposes a battery model that
17
represents the charging and discharging process of a lead-acid battery bank. This model is
18
validated over real measures taken from a battery bank installed in a research center placed at “El
19
Chocó”, Colombia. In order to fit the model, three optimization algorithms (Particle Swarm
20
Optimization, Cuckoo Search, and Particle Swarm Optimization+Perturbation) are implemented
21
and compared, being the last one a new proposal. This research shows that the model with the
22
proposed algorithm is able to estimate and manage the real battery characteristics as SOC and
23
charging/discharging voltage. The comparison between simulations and real measures shows that
24
the model is able to absorb reading problems, signal delays, and scaling errors. The approach we
25
present can be implemented in other types of batteries especially those used in stand-alone
26
systems.
27
Keywords: Modelling; lead-acid battery; parameter identification; genetic algorithms;
28
experimental validation.
29
30
1. Introduction
31
The energy storage system most often used is battery technology [1]–[5]. Batteries are used as
32
power source for electric vehicles (EV), communication systems, electrical and electronic devices,
33
renewable energy systems (RES), etc. In RES such as stand-alone photovoltaic and wind power, the
34
battery type commonly used is lead acid battery due to their maturity and low cost [6]. These
35
batteries are composed of two-volt elements that connect in series and provide voltages of 12V, 24V,
36
48V, etc. However, lead acid batteries have a high impact on the lifetime costs of stand-alone
37
power-supply systems [6]. Some studies [7,8] reveal that batteries may account for up to 40% of the
38
overall system cost over its lifetime.
39
Accurate and efficient battery modeling is essential to maximize the performance of a system
40
and its battery lifetime. However, due to its non-linear nature [9] the battery charging and
41
discharging process is complex to be accurate modeled. Moreover, many aging phenomena take
42
place inside the battery during its life cycle such as corrosion, gassing effect, self-discharging,
43
diffusion process, etc. [10]. Different models have been developed and implemented to capture the
44
battery performance for various purposes [11]–[15]. Nevertheless, in order to effectively use a
45
specific mathematical model to a real system, highly accurate modeling and low computational time
46
are required [16]; therefore a parameters number must be tuned in order to accurately represent the
47
system working. Because system working depends on a high number of variable factors such as
48
environmental variables, life cycle, or type of facility, among others, some method has to be applied
49
to tune the model parameters.
50
Different methods have been proposed in the literature to identify the battery parameters [17]–
51
[20]. However, genetic algorithms (GA) have shown great performance. GA is a technique for
52
stochastic search, learning, and optimization [21]. GAs work on a set of potential solutions called
53
population. This population is composed of a series of solution known as individuals. The
54
individuals are formed by a series of positions that represent the variables called chromosomes. GA
55
has wide applications in bioinformatics, engineering, physics, computational science, mathematics,
56
and other related fields [22]–[26]
57
Regarding the optimization of hybrid energy system with battery PSO is considered as one of
58
the most used GA due to its good performance, flexibility, and simplicity [27]. Previous studies
59
show that this algorithm is used in the electrochemical model parameter identification of a li-ion
60
battery for automotive applications [28]–[32]. While the application of GA for the parameter
61
identification of lead acid batteries as those used in RES research is scarce, e.g., Guasch et al. [33]
62
used the battery model proposed by [34] and they added two extra parameters: level of energy and
63
state of health. These new parameters are able to predict the degradation of the battery capacity and
64
the increase of self-discharge current in the long time. In order to fit the model, they applied a
65
Levenberg–Marquardt algorithm to achieve a mean voltage error around 1%. Besides to the 21
66
parameters identified in [34], Blaifi et al. [35]–[37] propose an improvement of 4 parameters for the
67
estimation approximately of the gassing and the saturation levels. The simulation results shows that
68
mean error with parameters given by [34] was 1.49%. While the mean error with parameters
69
identification by GA was 0.45%. However, one disadvantage of the model is the high calculation
70
time due to the large number of samples required for a good identification.
71
Another very attractive GA that can be used in the parameters identification is Cuckoo Search
72
(CS) [38, 39]. In this genetic algorithm, the random walk is generated via Lévy flights as search
73
strategy. CS is considered as a modern meta-heuristic algorithm able to solve complex optimization
74
problems with high accuracy [40]–[42].
75
Taking into account the above-mentioned, this paper explores the use of GA to fit a
76
mathematical model of batteries in order to represent the real working of a research center. This
77
research has chosen the model developed by [34] because of its ability to cope with a widest range of
78
lead acid batteries. Additionally, three GA (PSO, PSO+Perturbation, and CS) are implemented and
79
compared to identify the parameters of a lead acid OPzS type battery bank. Where, we present
80
PSO+Perturbation GA as a new proposal for the parameters identification. Moreover, four new
81
parameters are added to the Copetti model. These parameters allow a better adjustment of the
82
curves of charging/discharging voltage of the acid lead battery. Equivalent circuit models and GAs
83
are simulated on LabView. The simulation results are validated with experimental data obtained
84
from a research center “Centro de Investigación en Energías Renovables del Departamento del
85
Chocó (Colombia) – CIERCHOCÓ.
86
This paper is organized as follows. In Section 2, a system description of the research center is
87
presented. In Section 3 presents the battery model, the parameters proposed by Copetti and the
88
addition of four new parameters to the model. Section 4 describes the GAs and their
89
implementation. The results obtained are presented in Section 5. Finally, the conclusions are
90
presented in Section 6.
91
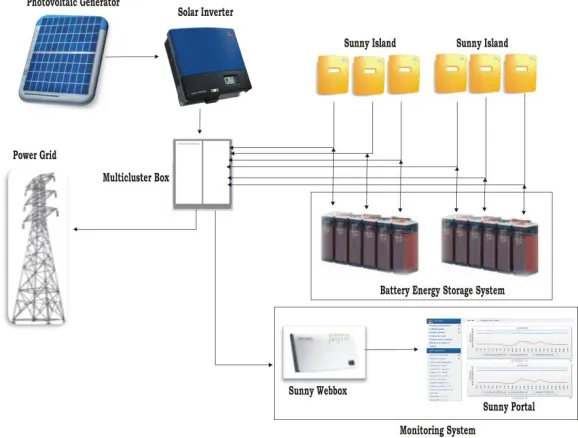
2. Experimental system in CIERCHOCÓ
92
The real battery energy storage system (BESS) is composed of 48 TECHNO SUN
93
2V-OPzS-TCH2765 electrochemical accumulators divided into two branches of 24 cells connected in
94
series. According to the manufacturer’s characteristics, a single cell provides: nominal capacity 2770
95
Ah (C120). Additionally, the building integrates a photovoltaic (BIPV) system (see Figure 1). It is
96
(STP 20000TL-30; SMA) DC/AC inverter, a multicluster box (220V, 60Hz), and 6 sunny island ac/dc
98
chargers inverters. Moreover, a data acquisition system stores data every 15 minutes.
99
100
101
Figure 1. Block diagram of the BIPV system
102
3. Battery model test
103
The Copetti’s model describes four operation modes for the battery system: a charging zone, a
104
discharging zone, an overcharging zone and an intermediate zone representing a soft transition
105
between charging/discharging modes [43]. Moreover, this model is based on a simple resistor model
106
(see Figure 2) that is composed of an open circuit voltage source (Voc) based on the batteries state of
107
charge (SOC), and a resistor R dependent on current (Ibat), temperature (T) and SOC [34], [44], [45].
108
109
Figure 2. Equivalent circuit battery model.
110
According to Figure 2, Vbat is given by equation (1):
111
112
= ± (1)
113
where, Ibat is the current circulating through battery. Ibat<0 during charge and Ibat>0 during
114
discharge.
115
The discharge voltage is simulated through equation (2), while the charge voltage is simulated
116
with equation (3). Where, ns are the electrochemical accumulator’s number, and ΔT is the
117
temperature variation.
118
( ) = [ − (1 − ( ))] − | ( )|
∗ | ( )| + ( ) + ∗
119
( ) = ( + ( )) + ( )
∗ 1 + ( ) +(1 − ( )) +
∗ 1 − ∆ ( ) (3)
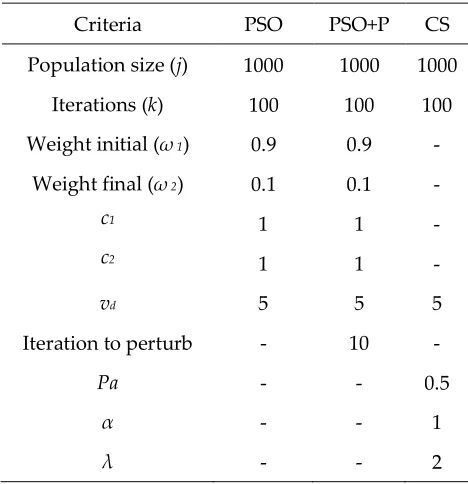
120
∆ = − (4)
The reference temperature (Tref) is 25 0C. The terms P1dc, P2dc, P3dc, P4dc, and P5dc are losses
121
associated with the internal resistance as a function of the duty point [33], while the terms P1c, P2c, P3c,
122
P4c, and P5c are charge parameters. The terms Vbodc is the remaining voltage when the battery is
123
discharged, Kbodc and Kboc relates the open circuit voltage of the battery with its SOC in the discharge
124
and charge cycles respectively. Kc120c is a gain associated with battery capacity. αrdc and αrc provides
125
the relationship with temperature [33].
126
The SOC is understood as the fraction or percentage of the capacity is still available in the
127
battery and is estimated by equation (5). SOCo corresponds to the battery initial SOC and Cbat is
128
battery capacity in Ah.
129
( ) = − ∫ ( ) (5)
where, 0 ≤ ( ) ≤ 1. Equation (5) discrete implementation is:
130
131
( + 1) = ∗ ∗ ∆( ) ( + 1) − ( )
2 + ( ) ∗
1 ∗ _
(6)
where ksoc is an overall gain of SOC; kI is related to coulomb efficiency; Δt is the sampling period;
132
and kc_bat is an associated parameter to battery aging. New parameters (kc120, ksoc, kI, kc_bat) have an
133
initial value of 1 to maintain the original model performance.
134
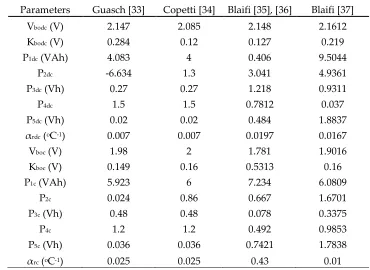
Table 1, compares the parameters identified by [34] with the values published by [33] and [35]–
135
[37] showing a high dispersion between the different authors.
136
Table 1. Nominal values of the identified parameters by some authors.
137
Parameters Guasch [33] Copetti [34] Blaifi [35], [36] Blaifi [37]
Vbodc (V) 2.147 2.085 2.148 2.1612
Kbodc (V) 0.284 0.12 0.127 0.219
P1dc (VAh) 4.083 4 0.406 9.5044
P2dc -6.634 1.3 3.041 4.9361
P3dc (Vh) 0.27 0.27 1.218 0.9311
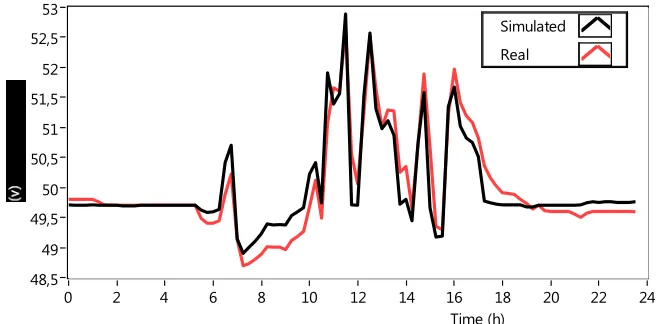
P4dc 1.5 1.5 0.7812 0.037
P5dc (Vh) 0.02 0.02 0.484 1.8837
αrdc (oC-1) 0.007 0.007 0.0197 0.0167
Vboc (V) 1.98 2 1.781 1.9016
Kboc (V) 0.149 0.16 0.5313 0.16
P1c (VAh) 5.923 6 7.234 6.0809
P2c 0.024 0.86 0.667 1.6701
P3c (Vh) 0.48 0.48 0.078 0.3375
P4c 1.2 1.2 0.492 0.9853
P5c (Vh) 0.036 0.036 0.7421 1.7838
αrc (oC-1) 0.025 0.025 0.43 0.01
The model is able to choose the discharging equation when the input signal has a positive sign
139
(+A); otherwise, the model chooses the charging equations if the current sign is negative (-A).
140
Current and temperature are taken as input signals.
141
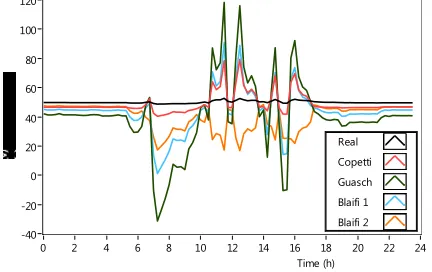
Figure 3 shows a comparison between the experimental system performance and the battery
142
model using parameter sets from Table 1. Furthermore, Table 2 presents the mean errors obtained
143
by simulation with parameters reported in [33]–[37]. In the Table 2 it is observed that with the
144
parameters reported by [34] it obtains the lowest mean error.
145
146
Figure 3. Model test using the parameters published in Table 1.
147
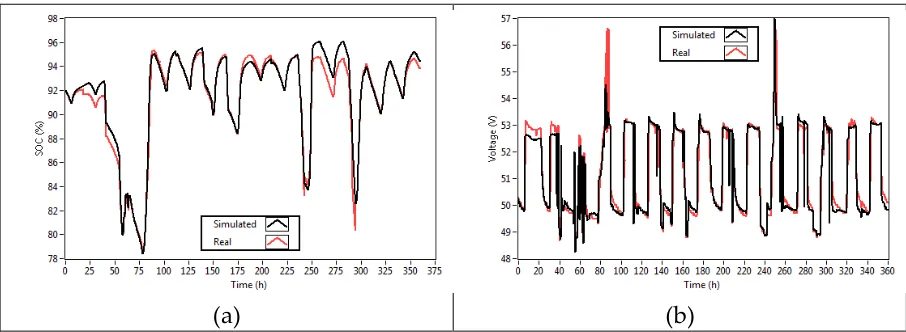
Table 2. Mean error using the parameters reported in the literature.
148
Mean error (%) Charge voltage Discharge voltage
[33] 40.06 37.91
[34] 16.93 7.79
[35], [36] 20.98 22.16
[37] 42.10 14.00
149
In the simulation of battery voltage, it is observed that this model represents the battery
150
dynamics but with different scales and time delays. Therefore, the battery model must be used to fit
151
the real battery dynamics.
152
4. Parameter identification
153
Due to the nonlinearity and complexity of the battery model, this proposal uses GA to find one
154
possible optimal solution that belongs to a Pareto's front. Parameter identification was carried out
155
in the same conditions with different GA in order to compare the algorithms. The general
156
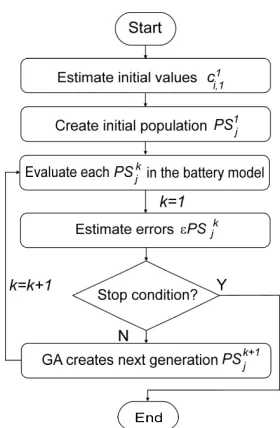
identification process for all GA is shown in Error! Reference source not found., it starts with the
157
estimation of initial coefficients values that are grouped in a parameter set (PS), in the second step,
158
the initial PS is used to creates a random population of size j. In the third step, each single PS is
159
evaluated into the model using inputs signals taken of real system. In the fourth step, the simulated
160
outputs are compared with real outputs to estimate the PS error. Next, if the stop condition is
161
fulfilled the process ends, otherwise, the GA creates a new population using specific criteria and
162
back to the fourth step for a second iteration. The stop condition could be a defined iterations
163
number or get an error lowest that a defined umbral.
164
165
120
-40 -20 0 20 40 60 80 100
Time (h)
24
0 2 4 6 8 10 12 14 16 18 20 22
166
Figure 4. Global identification process algorithm
167
The model describes both charging and discharging processes whit different equations. The
168
input current signal may change from positive sign (discharge) to negative sign (charge) several
169
times in the same simulation, then the identification a PS that represents the real BESS with
170
accuracy, requires the identification of one PS for each working mode. Therefore, a particular PS in
171
the battery model consists of:
172
1 2 3 4 5 120 _
1 2 3 4 ? 120 _
( ) 0;
( ) 0
, , , , , , , , , , ,
, , , , , , , ,
; , , ,
boc boc c c c c c rc c c socc Ic c batc
bodc bodc dc dc dc dc dc rdc c dc socdc Idc c batdc
V K P P P P P k k k k
V K P P P P P k
I A PS
PS
I A PS k k k
A general PS is defined as:
173
1,,
2,,
3,,...
,k k k k k
j j j j i j
PS
c c
c
c
where cki,j represents any parameter of the PS; e.g, , is the value of first parameter (Vbo) in
174
second parameter set of the 8th population PS28. This parameter involve both Vboc and Vbodc.
175
176
In the first step, the initial values coefficients were taken from literature (Table 1). In the second
177
step, the initial population (k=1) of size j is an array of PS that is creates following the bellow rules:
178
1 1
,1 ,1
1
1 1 1
, , ,
1;
1; ( )
i i
j
i j i j d i j
j c c
PS
j c c z v c
j=1 ensure that the first population keeps the initial coefficients. For j ≥ 1, the coefficients values
179
change in a random way, where z represents a is random number (z[-1, 1]) and vd is a value which
180
generates a possible dispersion of the parameters ci,j1 in the initial population such that ci,j1[-vd*ci,j1 ,
181
vd*ci,j1].
182
183
In third step, each PSj1 is evaluated in battery model, and for the next step, different error εPSj1
184
is calculated for charging/discharging operation mode for both system signals, battery Voltage and
185
battery SOC, in first place, the battery voltage error εVPSj1 is calculated as:
186
/ 2k
VPSj Vc Vdc
(7)
where, εVc and εVdc are the battery voltage error (charging/discharging). The mean errors are
187
εVc = ∑ | | and εVdc = ∑ | | (8) where Vm and Vs are the measured and simulated battery voltage respectively, and j is number
189
of samples. In similar way, the battery SOC error εSOCPSj1is calculated as:
190
/ 2k
SOCPSj SOCc SOCdc
(9)
where, εSOCc and εSOCdc are the battery voltage error (charging/discharging). The mean
191
errors are calculates as:
192
εSOCc = ∑ | | and εVdc = ∑ | | (10)
where SOCm and SOCs are the measured and simulated battery SOC respectively, and j is
193
number of samples.
194
195
The goal is to minimize both εPSjk. The optimization process ends when a stop condition is met.
196
If the stop condition is not fulfilled, the GA creates a new population .This new population is
197
evaluated again. Therefore, at each step k, the system runs the model j times. Each time the systems
198
uses a row of PSk. Simulation results are compared with real data so there is a simulation error for
199
each PS. This error is used to generate the next population to be tested or to decide if it is small
200
enough to finish the process. The stop condition is usually defined as a threshold for the minimum
201
εPSjk or as a maximum number of iterations.
202
Each GA uses a particular policy to create the new population from the previous evaluated one.
203
The goal is to converge to the optimal solution in a minimum number of steps. In order to perform
204
this operation, GAs includes random components to search for the global best solution which
205
include values of dispersion to spread or to focus the offspring near a possible solution. The model
206
parameters identification were set with an initial dispersions values between [-5, 5] from the initial
207
value.
208
4.1.GAs description
209
The PSO algorithm is a GA that emulates the behavior of a swarm in the action of the crop [28].
210
The swarm moves around a particle that finds a possible good place (solution) and explores this
211
location; if another particle finds a better solution, the swarm moves to this new place. The
212
advantages of PSO include the gradual reduction of the movement distance at each step (ω) to focus
213
the research on a small area and the capacity to keep the better solution found at each step in the
214
swarm memory (PBest) and the best solution of overall process (Gbest). The algorithm uses two
215
coefficients in order to modulate the influence of Pbest and Gbest in the new swarm step (iteration).
216
On the other hand, one of the most recent published GA is CS [38]–[40], that emulates the
217
behavior of cuckoo birds related to their aggressive strategy of reproduction that colonize and
218
parasite the nests of another bird. The cuckoo chooses a nest with eggs, leaves its own egg; if the
219
egg is accepted and hatches, the brood will be fed by foster's birds. In CS, the probability that the
220
egg be found out and rejected is configurable as Pa ∈ [0, 1]. The CS movement strategy follows the
221
Lévy flights; each step has a random distance and an angular movement conditioned by
222
configurable values: α (α >0), and λ (λ ∈ [1, 3]).
223
4.2.New proposal
224
One important feature of PSO is its ability to gradually focus the search around the local
225
minimum. However, when the algorithm falls around a local minimum it is difficult to get a better
226
solution. This paper proposes the introduction of periodic perturbations inside the population in
227
order to force PSO reactivation. The perturbation will consist of a new population PSjl based on the
228
1,,
2,,
3,,...
,l l l l l
j j j j i j
PS
c c
c
c
,
(
i)
il GBest GBest
i j
c
c
z n
c
(11)where ciGBest is coefficient belonging to GBest until iteration l-1, and n is perturbation value.
230
Because the use of perturbations this proposal is named PSO+P. The perturbation is introduced into
231
iteration around the stabilization of PSO, and then is necessary run first the PSO.
232
4.3.Algorithms configuration criteria
233
Different criteria currently exist for the algorithms configuration. This paper works with the
234
more common configuration [28], [41], [46], [47] as it is shown in Table 3. Population size (j),
235
iterations number (k) and initial dispersion (vd) take equal values in all the algorithms.
236
Table 3. Genetic algorithms configuration.
237
Criteria PSO PSO+P CS
Population size (j) 1000 1000 1000
Iterations (k) 100 100 100
Weight initial (ω 1) 0.9 0.9 -
Weight final (ω 2) 0.1 0.1 -
c1 1 1 -
c2 1 1 -
vd 5 5 5
Iteration to perturb - 10 -
Pa - - 0.5
α - - 1
λ - - 2
238
5. Results and discussion
239
5.1.Optimization results
240
The model duality allows the use of different errors for both battery operation modes
241
(charging/discharging). Therefore, we can study separately each behavior. Figure 5 shows both. In
242
the charge mode, the CS does not find an optimal value of error and its last change takes place near
243
80th iteration. PSO and PSO+P achieve similar error values. Despite PSO presents a fast search, it
244
presents an early jam around a non-optimal solution. On the other hand, the perturbation feature of
245
PSO+P lets it make a wide search and obtaining better results than previous GAs.
246
247
Related to discharge mode, the GAs performance shown similar performances as in charge
248
mode. CS presents a more dynamic behaviour that obtains stabilization in iteration 36th, but with
249
non-adequate optimization value. The fastest algorithm is PSO, which reaches an acceptable value
250
less than 1.0% around the 10th iteration. PSO+P show a slightly slower behavior, but it obtains
251
(a)
(b)
Figure 5. Optimization algorithms. (a) shows the algorithm performance in charge mode for a mean
253
battery voltage, and (b) shows the discharge mode algorithm performance.
254
Results discard CS as a suitable method to fit the battery behavior. Therefore, only PSO and
255
PSO+P need a closer look in order to select the best algorithm. A fast analysis over the curves shows
256
that PSO is the faster algorithm but it falls in local minima so it loses search ability, thus confirming
257
its known limitations. PSO+P obtain the best results but it requires more iterations to achieve it. A
258
quantitative comparison is shown in Table 4. Criteria used to evaluate each algorithm are precision,
259
velocity and computational cost. First, precision value is measured as the lowest error value reached
260
by a GA. Second, the optimization speed is measured with the iteration when the algorithm makes
261
its last improving. At last, computational cost is measured as the average time used by the computer
262
to make single optimization iteration. Scores are calculated in each operation mode
263
(charging/discharging) through the ratio between the obtained value by the algorithm and the
264
lowest value achieved by algorithm. Therefore, a value of 1.00 represents the best result and a value
265
of 2,000 stands for a 100% deviation from the best result. The algorithms ran under a PC with Intel
266
core i5-3200, 31.GHz, 8 GB RAM and operating system W7-64 bits.
267
268
18
0 2 4 6 8 10 12 14 16
Iteration
100 0 5 10 15 20 25 30 35 40 45 50 55 60 65 70 75 80 85 90 95
PSO+P CS PSO
9
0 1 2 3 4 5 6 7 8
Iteration
100 0 5 10 15 20 25 30 35 40 45 50 55 60 65 70 75 80 85 90 95
Table 4. Algorithms Comparison using the minimal mean error reached. d*= discharge mode; c*=
269
Charge mode.
270
271
Criteria/Algorithm
PSO PSO+P Cuckoo
d* c* d* c* d* c*
Precision (error)
Value 0.50 0.91 0.34 0.51 3.09 2.81
Score 1.48 1.78 1.00 1.00 9.23 5.53
Velocity (iteration)
Value 17.00 11.00 91.00 90.00 89.00 97.00
Score 1.00 1.00 5.35 8.18 5.24 8.82
Computational cost (ms/iteration)
Value 0.41 0.41 0.42 0.42 0.71 0.71
Score 1.00 1.00 1.03 1.03 1.72 1.72
272
273
5.2.Model performance and validation
274
Data in Table 4 describes PSO as the best algorithm regarding velocity and computational cost.
275
However, PSO+P show the most accurate fit. Therefore, the model is fit from PSO+P results. These
276
parameters are shown in Table 5.
277
Table 5. Parameters from PSO+P identification in daily data files.
278
Discharge Charge
Vbodc (V) 2.3003 Vboc (V) 2.2823
Kbodc (V) 0.1898 Kboc (V) 1.0227
P1dc (VAh) 20.4751 P1c (VAh) 2.4048
P2dc 0.9282 P2c 1.1928
P3dc (Vh) 0.1481 P3c (Vh) 0.0061
P4dc 2.3350 P4c 0.0285
P5dc (Vh) 0.0362 P5c (Vh) 0.0054
αrdc (oC-1) 0.0365 αrc (oC-1) 0.1008
kIdc* 2.2087 kIc* 0.3254
kc_batdc* 2.5517 kc_batc* 0.3603
ksocdc* 2.5509 ksocc* 16.7918
kc120dc* 0.0470 kc120c* 0.3097
279
Figure 6 shows the results of the identification process with PSO+P. The simulated plot
280
follows with high accuracy the real plot in battery voltage. The battery model with new extracted
281
parameters presents a good matching with the reals measurement obtained from the research center.
282
284
Figure 6. Simulation using identified parameters by PSO+P algorithm with one day data files.
285
The simulation using the identification of parameters with PSO+P significantly improved the
286
mean errors presented in Table 2. The mean errors achieved with this method were 0.29% and 0.44%
287
for the battery voltage signal (discharging/charging, respectively) for an average between the two
288
signals of 0.365%.
289
290
5.3.Experimental validation
291
Model validation is carried out with data from three months divided into 4-day packages to be
292
compared with the results presented in [35]–[37]. In order to validate the developed model under
293
real conditions, this paper uses the parameters shown in Table 5. Figure 7 shows the results of the
294
experimental validation of several data packages for different months; left side shows the simulation
295
of SOC and right side presents the Voltage signal.
296
297
1(a)
1(b)
2(a)
2(b)
53
48,5 49 49,5 50 50,5 51 51,5 52 52,5
Time (h)
24
0 2 4 6 8 10 12 14 16 18 20 22
Simulated
3(a)
3(b)
Figure 7. Battery voltage measurements (red plot) and simulation (black plot) results obtained by
298
PSO+P algorithm identified parameters. 1-3(a) represents the Battery SOC signal; 1-3(b) represent the
299
Battery Voltage Signals.
300
Validations 1 to 3 show that the model is able to follow the dynamics of the battery, despite in
301
some cases it presents possible mistakes reading in the signal which may be due to of the
302
measurement equipment. Those errors are shown as vertical falls and peaks without physic
303
explanation due the reading period of 15 minutes. The mean error of each simulation regard to
304
measured voltage is shown in Table 6.
305
Table 6. Mean error simulated vs measured voltage for 4-day package.
306
Signal SOC Voltage
Simulation (a) (b) (c) (a) (b) (c)
Charge Mode Error (%) 0.0606 0.0827 0.1787 0.2163 0.2504 0.2446 Discharge Mode error (%) 0.1223 0.1335 0.1383 0.3824 0.3347 0.5242 Mean 0.0956 0.1076 0.1602 0.3075 0.2904 0.3582
307
When the battery model is validated for a 15-day package with the parameters shown in Table 5
308
the SOC mean error was 0.46% and voltage mean error 0.45% (see Figure 8). Again the model
309
presents a good matching with the measured signal. However, on day 4th and 11th overcharging
310
events occurred, and the model only was able to represent the second event.
311
312
(a)
(b)
Figure 8 Battery voltage measurements and simulation results obtained by PSO+P algorithm for 15
313
days. (a) represents the Battery SOC signal; (b) represents the Battery Voltage Signals.
314
6. Conclusions
316
The battery model proposed by Copetti has a good performance to represent battery dynamics.
317
However, when tested with real measurements, this model presents problems of scaling and delay
318
in the signal, so this paper have propose the inclusion of four new parameters to improve its
319
modelling capabilities. Despite, the Battery voltage equation includes the SOC equation, and the
320
battery voltage simulation result shows the SOC results in an implicit way, get the SOC simulation
321
results separately lets the model more useful for condition monitoring and the BBES management.
322
323
The model has been fit to represent the real behavior of a BESS placed at “El Chocó”. Colombia.
324
Despite, improvements should be made to the model. The complexity of the model implies the use
325
of GA to perform the optimization, so this paper has tested three GA in order to find the best
326
approach. Besides some well-known algorithms like CS and PSO, a new proposed algorithm
327
(Particle Swarm Optimization+Perturbation) have been used to identify and extract the parameters
328
of the lead acid OPzS type battery. The inclusion of the disturbance makes PSO+P more accurate
329
than PSO.
330
331
The present proposal has the ability to find PS to fit the model no matter the start point from
332
however, to continue the present work is necessary to make a sensibility analysis of the parameters
333
to define the influence of each parameter in the simulation results, and establish its adequate
334
boundaries
335
336
The battery model with the new extracted parameters presents a good matching with the reals
337
measurement obtained from the research center. The main advantage of the developed model is its
338
low computational cost and its ability to absorb reading problems, and scaling errors when the
339
simulation is valid with real measurements. The model and its fitting approach presented in this
340
paper may be applied to other types of batteries especially those used in stand-alone systems.
341
342
The battery model will be used to make a better battery energy management system from
343
research center placed at “El Chocó”. Colombia.
344
345
Author Contributions: The present work was developed with following contributions: Conceptualization,
346
methodology, software, validation, formal analysis, investigation and writing-original draft preparation and
347
data curation, H.E.A; E.B. and A.C.; Writing-review & editing, and supervision Á. P-N. and F.M.
348
Funding: This research was supported by “Implementación de un programa de desarrollo e investigación de
349
energías renovables en el departamento del chocó - BPIN:20130000100285; COLCIENCIAS (Administrative
350
department of science, technology and innovation of Colombia) scholarship program PDBCEx, COLDOC 586,
351
and the support provided by the Corporación Universitaria Comfacauca, Popayán–Colombia.
352
Conflicts of Interest: Authors declare no conflict of interest. The founding sponsors had no role in the design of
353
the study; in the collection, analyses, or interpretation of data; in the writing of the manuscript, and in the
354
decision to publish the results.
355
References
356
1. [1] F. Díaz-González. A. Sumper. O. Gomis-Bellmunt. and R. Villafáfila-Robles. ‘A review of energy
357
storage technologies for wind power applications’. Renew. Sustain. Energy Rev.. vol. 16. no. 4. pp. 2154–
358
2171. 2012.
359
2. [2] A. Evans. V. Strezov. and T. J. Evans. ‘Assessment of utility energy storage options for increased
360
renewable energy penetration’. Renew. Sustain. Energy Rev.. vol. 16. no. 6. pp. 4141–4147. 2012.
361
3. [3] H. L. Ferreira. R. Garde. G. Fulli. W. Kling. and J. P. Lopes. ‘Characterisation of electrical energy
362
4. [4] S. Koohi-Kamali. V. V. Tyagi. N. A. Rahim. N. L. Panwar. and H. Mokhlis. ‘Emergence of energy
364
storage technologies as the solution for reliable operation of smart power systems: A review’. Renew.
365
Sustain. Energy Rev.. vol. 25. pp. 135–165. 2013.
366
5. [5] T. Kousksou. P. Bruel. A. Jamil. T. El Rhafiki. and Y. Zeraouli. ‘Energy storage: Applications and
367
challenges’. Sol. Energy Mater. Sol. Cells. vol. 120. pp. 59–80. 2014.
368
6. [6] R. Kaiser. ‘Optimized battery-management system to improve storage lifetime in renewable energy
369
systems’. J. Power Sources. vol. 168. no. 1. pp. 58–65. 2007.
370
7. [7] A. Sayigh. Renewable Energy in the Service of Mankind Vol I: Selected Topics from the World
371
Renewable Energy Congress WREC 2014. Springer. 2015.
372
8. [8] S. Armstrong. M. E. Glavin. and W. G. Hurley. ‘Comparison of battery charging algorithms for stand
373
alone photovoltaic systems’. Power Electron. Spec. Conf. 2008 PESC 2008 IEEE. pp. 1469–1475. 2008.
374
9. [9] Y. Yin. X. Luo. S. Guo. Z. Zhou. and J. Wang. ‘A battery charging control strategy for renewable
375
energy generation systems’. Proc. World Congr. Eng.. vol. 1. pp. 2–4. 2008.
376
10. [10] R. Saiju and S. Heier. ‘Performance analysis of lead acid battery model for hybrid power system’. in
377
Transmission and Distribution Conference and Exposition. 2008. T&D. IEEE/PES. 2008. pp. 1–6.
378
11. [11] K. M. Tsang. W. L. Chan. Y. K. Wong. and L. Sun. ‘Lithium-ion battery models for computer
379
simulation’. in Automation and Logistics (ICAL). 2010 IEEE International Conference on. 2010. pp. 98–102.
380
12. [12] M. Nikdel. ‘Various battery models for various simulation studies and applications’. Renew. Sustain.
381
Energy Rev.. vol. 32. pp. 477–485. 2014.
382
13. [13] W. H. Zhu. Y. Zhu. and B. J. Tatarchuk. ‘A simplified equivalent circuit model for simulation of
383
Pb-acid batteries at load for energy storage application’. Energy Convers. Manag.. vol. 52. no. 8. pp. 2794–
384
2799. 2011.
385
14. [14] D. Fendri and M. Chaabene. ‘Dynamic model to follow the state of charge of a lead-acid battery
386
connected to photovoltaic panel’. Energy Convers. Manag.. vol. 64. pp. 587–593. 2012.
387
15. [15] E. Hittinger. T. Wiley. J. Kluza. and J. Whitacre. ‘Evaluating the value of batteries in microgrid
388
electricity systems using an improved Energy Systems Model’. Energy Convers. Manag.. vol. 89. pp. 458–
389
472. 2015.
390
16. [16] A. B. Ansari. V. Esfahanian. and F. Torabi. ‘Discharge. rest and charge simulation of lead-acid
391
batteries using an efficient reduced order model based on proper orthogonal decomposition’. Appl.
392
Energy. vol. 173. pp. 152–167. 2016.
393
17. [17] N. Achaibou. M. Haddadi. and A. Malek. ‘Modeling of lead acid batteries in PV systems’. Energy
394
Procedia. vol. 18. pp. 538–544. 2012.
395
18. [18] N. Achaibou. M. Haddadi. and A. Malek. ‘Lead acid batteries simulation including experimental
396
validation’. J. Power Sources. vol. 185. no. 2. pp. 1484–1491. 2008.
397
19. [19] L. Devarakonda and T. Hu. ‘Algebraic method for parameter identification of circuit models for
398
batteries under non-zero initial condition’. J. Power Sources. vol. 268. no. November 2014. pp. 928–940.
399
2014.
400
20. [20] A. Selmani. M. Outanoute. A. Lachhab. M. Guerbaoui. and B. Bouchikhi. ‘Performance Evaluation of
401
Modelling and Simulation of Lead Acid Batteries for Photovoltaic Applications’. vol. 7. no. 2. 2016.
402
21. [21] K. Thirugnanam. E. R. J. TP. M. Singh. and P. Kumar. ‘Mathematical modeling of Li-ion battery using
403
genetic algorithm approach for V2G applications’. IEEE Trans. Energy Convers.. vol. 29. no. 2. pp. 332–343.
404
2014.
405
22. [22] Z. Chen. C. C. Mi. Y. Fu. J. Xu. and X. Gong. ‘Online battery state of health estimation based on
406
Genetic Algorithm for electric and hybrid vehicle applications’. J. Power Sources. vol. 240. pp. 184–192.
407
Oct. 2013.
408
23. [23] W. Liu. L. Liu. I.-Y. Chung. and D. A. Cartes. ‘Real-time particle swarm optimization based
409
parameter identification applied to permanent magnet synchronous machine’. Appl. Soft Comput.. vol.
410
11. no. 2. pp. 2556–2564. 2011.
411
24. [24] L. Guo. Z. Meng. Y. Sun. and L. Wang. ‘Parameter identification and sensitivity analysis of solar cell
412
models with cat swarm optimization algorithm’. Energy Convers. Manag.. vol. 108. pp. 520–528. 2016.
413
25. [25] E. K. Nyarko and R. Scitovski. ‘Solving the parameter identification problem of mathematical models
414
26. [26] P. García-Triviño. A. J. Gil-Mena. F. Llorens-Iborra. C. A. García-Vázquez. L. M. Fernández-Ramírez.
416
and F. Jurado. ‘Power control based on particle swarm optimization of grid-connected inverter for hybrid
417
renewable energy system’. Energy Convers. Manag.. vol. 91. pp. 83–92. 2015.
418
27. [27] M. D. A. Al-Falahi. S. D. G. Jayasinghe. and H. Enshaei. ‘A review on recent size optimization
419
methodologies for standalone solar and wind hybrid renewable energy system’. Energy Convers. Manag..
420
vol. 143. pp. 252–274. 2017.
421
28. [28] M. A. Rahman. S. Anwar. and A. Izadian. ‘Electrochemical model parameter identification of a
422
lithium-ion battery using particle swarm optimization method’. J. Power Sources. vol. 307. pp. 86–97. 2016.
423
29. [29] X. Hu. S. Li. and H. Peng. ‘A comparative study of equivalent circuit models for Li-ion batteries’. J.
424
Power Sources. vol. 198. pp. 359–367. 2012.
425
30. [30] A. Malik. Z. Zhang. and R. K. Agarwal. ‘Extraction of battery parameters using a multi-objective
426
genetic algorithm with a non-linear circuit model’. J. Power Sources. vol. 259. pp. 76–86. 2014.
427
31. [31] J. Brand. Z. Zhang. and R. K. Agarwal. ‘Extraction of battery parameters of the equivalent circuit
428
model using a multi-objective genetic algorithm’. J. Power Sources. vol. 247. pp. 729–737. 2014.
429
32. [32] L. Zhang. L. Wang. G. Hinds. C. Lyu. J. Zheng. and J. Li. ‘Multi-objective optimization of lithium-ion
430
battery model using genetic algorithm approach’. J. Power Sources. vol. 270. pp. 367–378. 2014.
431
33. [33] D. Guasch and S. Silvestre. ‘Dynamic battery model for photovoltaic applications’. Prog. Photovolt.
432
Res. Appl.. vol. 11. no. 3. pp. 193–206. 2003.
433
34. [34] J. B. Copetti. E. Lorenzo. and F. Chenlo. ‘A general battery model for PV system simulation’. Prog.
434
Photovolt. Res. Appl.. vol. 1. no. 4. pp. 283–292. 1993.
435
35. [35] S. Blaifi. S. Moulahoum. I. Colak. and W. Merrouche. ‘An enhanced dynamic model of battery using
436
genetic algorithm suitable for photovoltaic applications’. Appl. Energy. vol. 169. pp. 888–898. May 2016.
437
36. [36] S. Blaifi. S. Moulahoum. I. Colak. and W. Merrouche. ‘Monitoring and enhanced dynamic modeling
438
of battery by genetic algorithm using LabVIEW applied in photovoltaic system’. Electr. Eng.. pp. 1–18.
439
2017.
440
37. [37] S. Blaifi. S. Moulahoum. N. Kabache. and I. Colak. ‘An improved dynamic battery model suitable for
441
photovoltaic applications’. in Renewable Energy Research and Applications (ICRERA). 2015 International
442
Conference on. 2015. pp. 694–698.
443
38. [38] X. S. Yang and S. Deb. ‘Cuckoo Search via L #x00E9;vy flights’. in 2009 World Congress on Nature
444
Biologically Inspired Computing (NaBIC). 2009. pp. 210–214.
445
39. [39] S. Berrazouane and K. Mohammedi. ‘Parameter optimization via cuckoo optimization algorithm of
446
fuzzy controller for energy management of a hybrid power system’. Energy Convers. Manag.. vol. 78. pp.
447
652–660. 2014.
448
40. [40] X.-S. Yang and S. Deb. ‘Engineering optimisation by cuckoo search’. Int. J. Math. Model. Numer.
449
Optim.. vol. 1. no. 4. pp. 330–343. 2010.
450
41. [41] A. H. Gandomi. X.-S. Yang. and A. H. Alavi. ‘Cuckoo search algorithm: a metaheuristic approach to
451
solve structural optimization problems’. Eng. Comput.. vol. 29. no. 1. pp. 17–35. Jan. 2013.
452
42. [42] I. Fister Jr.. X.-S. Yang. I. Fister. J. Brest. and D. Fister. ‘A Brief Review of Nature-Inspired Algorithms
453
for Optimization’. ArXiv13074186 Cs. Jul. 2013.
454
43. [43] C. Burgos. D. Sáez. M. E. Orchard. and R. Cárdenas. ‘Fuzzy modelling for the state-of-charge
455
estimation of lead-acid batteries’. J. Power Sources. vol. 274. pp. 355–366. 2015.
456
44. [44] H. L. Chan. ‘A new battery model for use with battery energy storage systems and electric vehicles
457
power systems’. 2000 IEEE Power Eng. Soc. Winter Meet. Conf. Proc. Cat No00CH37077. vol. 1. no. c. pp.
458
470–475. 2000.
459
45. [45] A. Szumanowski and Y. Chang. ‘Battery management system based on battery nonlinear dynamics
460
modeling’. IEEE Trans. Veh. Technol.. vol. 57. no. 3. pp. 1425–1432. 2008.
461
46. [46] Q. Li. W. Chen. Y. Wang. S. Liu. and J. Jia. ‘Parameter Identification for PEM Fuel-Cell Mechanism
462
Model Based on Effective Informed Adaptive Particle Swarm Optimization’. IEEE Trans. Ind. Electron..
463
vol. 58. no. 6. pp. 2410–2419. Jun. 2011.
464
47. [47] M. Ye. X. Wang. and Y. Xu. ‘Parameter identification for proton exchange membrane fuel cell model
465
using particle swarm optimization’. Int. J. Hydrog. Energy. vol. 34. no. 2. pp. 981–989. 2009.