Experimental and Numerical Study on Temperature
Evolution for Rapid Evaluation of Fatigue Limit
Hung Anh LY1,a, Hirotsugu INOUE1, and Yousuke IRIE2 1
Tokyo Institute of Technology, 2-12-1 Ookayama, Meguro, Tokyo 152-8552, Japan 2
Panasonic Corporation, 1006 Kadoma, Kadoma, Osaka 571-8506, Japan
Abstract. This study is intended to verify the technique of rapid evaluation of fatigue limit through numerical simulation. Temperature evolution of a notched stainless steel specimen subjected to cyclic loading is simulated by elasto-plastic finite element analysis. Amplitude of second harmonic is obtained from the temperature evolution. It has been shown that the fatigue limit evaluated from the second harmonic amplitude agree fairly well with those obtained by thermography experiment and Wöhler method.
1 Introduction
Engineering structures are often subjected to repeated loading, so the evaluation of fatigue limit is definitely necessary. The determination of fatigue limit by traditional Wöhler method is properly a time consuming task. Therefore, various techniques for rapidly evaluating fatigue limit have been considered for more than 100 years [1]: for example, techniques based on change of temperature, change in modulus of elasticity, change of electrical resistance, change of radiation with respect to progressive increase of loading amplitude. Although many attempts have been made, these techniques are not widely applied to practical engineering problems for lack of reliability compared to traditional Wöhler method. However, real engineering products in industry are usually so complicated and produced with a hug mass that Wöhler method cannot be applied to.
Less than 20 years ago, Luong [2] mentioned about use of infrared thermography to evaluate the fatigue limit as a non-destructive and non-contact technique of damage detection for real engineering components. During past 15 years, due to the development of infrared thermography, there is a high possibility to apply this technique in industry. Even though with its advantage, the realistic applicability of the technique has not become clear yet.
Therefore, this study is intended to verify the technique of rapid evaluation of fatigue limit through numerical simulation. Since stress concentration properly exists in real engineering structure, notched-specimen is adopted as an object in the present study.
2 Thermo-mechanical background of temperature evolution
Structures show changes in temperature because of mechanical deformation. Only the thermal and mechanical properties of an isotropic material are considered in this study, and magnetic, electric,
a
e-mail : [email protected]
© Owned by the authors, published by EDP Sciences, 2010 DOI:10.1051/epjconf/20100638007
and any other factors are neglected. The relationship between applied stress (or strain) and the corresponding temperature change in solid materials is known as thermo-mechanical coupling behaviour which consists of thermoelastic and thermoplastic effect. Because heat transfer causes these temperature changes to be dependent on the loading rate and therefore complicated, adiabatic condition is assumed in this study for simplicity.
2.1 Temperature oscillation due to thermoelasticity
Thermoelastic stress analysis refers to evaluation of distribution of sum of the principal stresses in a structure by the measurement of the thermal response resulting from application of cyclic loading within the elastic range of the material. According to the thermodynamic analysis of the entropy change with stress under adiabatic condition, the change in temperature per unit mass is obtained as
3 e
v
T K
T
CD GH
U
' (1)
where T is the absolute temperature, GH is the sum of orthogonal strain changes, D is the coefficient of thermal expansion, Kis the bulk modulus, U is density and CQ is the specific heat at constant volume. Equation (1) is not only derived clearly in [3] but also appeared in [4].
Considering' Te T , so T|T0 ( being the temperature at the reference unstrained state), Equation (1) can be approximated as
0 T 0 3 e v T K T
CD GH
U
' . (2)
Noting that the bulk modulus is expressed as
3 1 2 E K
Q
, (3)
the relationship between Cv and Cp is given by
2 3 1 2 v p TEC C D
U Q
(4)
where Cp is the specific heat at constant pressure, Eis Young’s modulus of the material and Q is Poisson’s ratio. Note that GH is independent of the coordinate system in the analysis.
2.2 Temperature increase due to irreversible plastic energy dissipation
The irreversible plastic deformation causes temperature rise. In order to obtain this inelastic effect, it is assumed that the specimen is stressed under adiabatic condition and energy stored inside the material is ignored. Thus all the irreversible mechanical energy due to the plastic deformation is converted into heat. From the basic thermodynamic equation (energy conservation equation), this behaviour can be written as
v T Q C t t G G U
G G (5)
Since the irreversible mechanical energy is given by W
³
Qdt³
V H
d , integration of Equation (5) with respect to time gives2 2
1 1
A
v p l u
C T d d
H H
H H
U '
³
V H³
V H ' (6)where 'A is the area of current stress-strain hysteresis loop used to calculate 'Tp,H1 and H2 are the minimum and maximum strain of the hysteresis loop, Vl and Vu are the stresses in the loading and unloading part of the hysteresis loop, respectively.
3 Experimental procedures
Material used in this study is SUS304 stainless steel. The geometry of specimen with 3-mm thickness is shown in Figure 1. To obtain the true fatigue limit, Wöhler method was conducted using normal fatigue testing machine. A load-control mode was used with Vmin Vmax 0, where Vmin and
max
V are the minimum and maximum applied stresses, respectively. Rapid evaluation of fatigue limit was also conducted by using an infrared camera (Cedip, Silver 450), in which software (Cedip, Altair LI) was used to obtain a temperature variation component having a frequency twice of the loading frequency (2f-component, hereafter).
Fig. 1. Geometry of 2-mm-notched specimen.
4 Numerical procedures
Numerical simulation was conducted using finite element code ABAQUS. The geometry of notched specimen was modelled by using 8,800 eight-node linear reduced integration elements. Due to symmetry only one-eighth of the specimen was modelled.
A nonlinear hardening material model (Chaboche model) was used to simulate ratcheting. The model has two features to simulate plastic hardening in cyclic loading conditions: the centre of the yield surface moves in stress space (kinematic hardening) and the size of the yield surface evolves with inelastic deformation (isotropic hardening). This combination of kinematic and isotropic hardening is introduced to model the Bauschinger effect and other phenomena such as plastic shakedown, ratcheting, and relaxation of the mean stress.
The non-linear kinematic hardening is governed by x C
1 e JHpsaturated value of increase isotropic deformation resistance and b represents speed of saturation [5]. Mechanical properties of SUS304 are shown in Table. 1, which are obtained from references [9-11]. Repeated loading with sinusoidal wave form of Vmin Vmax 0 was applied to the model at one end until 900 cycles while the other end was fixed in the loading direction. Loading amplitude was varied from 5.0 kN to 7.5 kN in 0.5 kN increments. Stress and strain behaviours of three elements shown in Figure 2 located at notch root were computed in detail. The primary results obtained from the analysis are elastic strain in three coordinate axes e
xx H , e
yy H , e
zz
H and dissipated plastic energy density which corresponds to the irreversible mechanical energy in Equation (6). These results were used as inputs for data analysis procedure as follows:
1) e
xx H , e
yy H , e
zz
H are used to calculate temperature variation due to thermoelasticity by applying Equation (2).
2) Dissipated plastic energy density is used to calculate temperature increase due to irreversible inelastic energy dissipation by applying Equation (6).
3) Temperature evolution at interested element is obtained by combining these two effects in Step 1 and Step 2.
4) Fast Fourier transform (FFT) is applied to temperature evolution with respect to time at every 10 cycles from beginning to 900 cycles of repeated loading process. This step is also applied to temperature evolution caused only by irreversible inelastic energy dissipation obtained in Step 2 in order to compare its 2f-component amplitude with corresponding value of whole temperature evolution. Hanning window function was applied to the data in order to reduce aliasing in FFT.
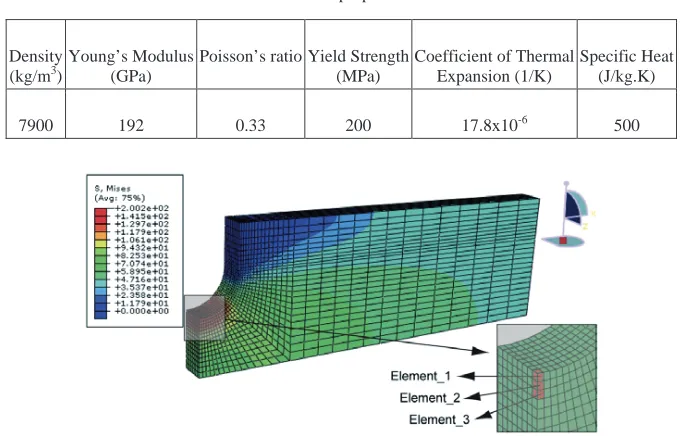
Table 1. Mechanical properties of SUS304.
Density (kg/m3)
Young’s Modulus (GPa)
Poisson’s ratio Yield Strength (MPa)
Coefficient of Thermal Expansion (1/K)
Specific Heat (J/kg.K)
7900 192 0.33 200 17.8x10⁻⁶ 500
Fig. 2. Position of three interested elements.
5 Results and discussions
14th International Conference on Experimental Mechanics
Fig. 3. Stress-strain curves at some cycles during repeated loading (loading amplitude = 6 kN), (a) Element_1; (b) Element_3.
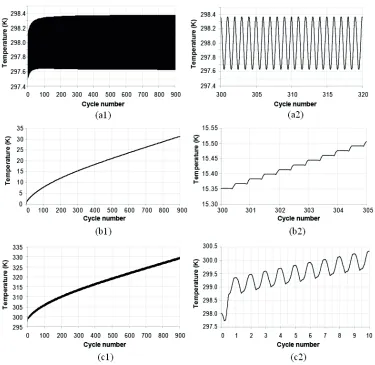
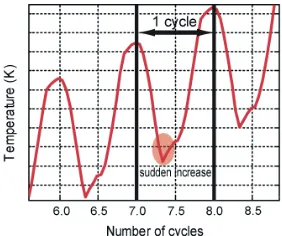
Fig. 5. Temperature evolution of some first cycles at Element_1 (loading amplitude = 6 kN)
Fig. 6. Spectrum of temperature with FFT at Element_1 (loading amplitude = 6 kN, 600th cycles), (a) Result of FFT applied to the whole temperature evolution during fatigue process,
(b) Result of FFT applied to temperature increase due to plastic energy dissipation during fatigue process.
an equal amount of plastic deformation in compression. At the beginning of the repeated loading, the area of hysteresis loop is relatively large. It is understood from Figure 3(a) that the rate of ratcheting gradually decreases while the ratcheting strain increased with the number of cycles. Once the ratcheting is constrained, the plastic shakedown occurs and the ratcheting strain is almost kept constant. At this stage the energy dissipated in each cycle becomes constant. Since stress concentration due to the notch is most severe at the notch-root, stress amplitude is largest and mean stress is lowest. Therefore, plastic shakedown occurs at Element_1 in this simulation while plastic dissipation becomes zero at Element_3 as seen in Figure 3(b). In the following, the temperature evolution of Element_1 will be considered in detail.
Temperature evolution of Element_1 in case of 6 kN loading amplitude is shown in Figure 4. It is clear from Figure 4(b2) that the temperature increases twice during one loading cycle. The mean temperature of Element_1 increases linearly after several loading cycles because plastic energy dissipation at each cycle becomes almost constant, which means that plastic shakedown is attained. The whole temperature evolution during fatigue process is obtained by combining the temperature oscillation due to thermoelasticity and the temperature increase due to irreversible plastic energy dissipation. It can be seen in Figure 4(c1) that mean temperature keeps increasing linearly after hundreds of cycles because heat conduction, heat transfer and any other effects are neglected in this simulation. A more detailed observation at one cycle of temperature evolution in Element_1 is shown in Figure 5, which is extracted from Figure 4(c2). Sudden increase in temperature occurs just before the maximum load (at the minimum temperature) of each cycle, which is due to overloading beyond the yield stress. This phenomenon agrees well with experimental observation [12].
temperature increase only due to plastic dissipation shown in Figure 4(b1). It is seen that the 2f-component amplitudes of these two are close to each other. Therefore, it can be said that the amplitude of 2f-component of the whole temperature evolution mainly reflects the temperature increase caused by plastic energy dissipation during fatigue process.
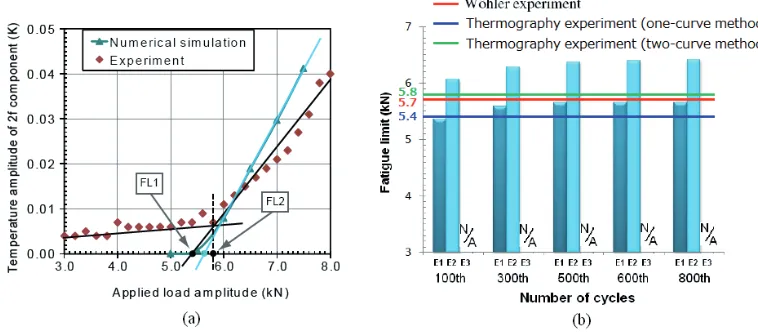
Fig. 7. FFT results at Element_1: (a) Temperature amplitude of 2f-component, (b) Fatigue limit evaluation.
Fig. 8. (a) Fatigue limit evaluation at Element_1 using thermography experiment, (b) Fatigue limit comparison.
Collection of such data for every 10 cycles during fatigue process under various loading amplitudes gives results shown in Figure 7(a). It is observed that 2f-component amplitude becomes almost constant at larger number of cycles and for larger loading amplitude. This means plastic shakedown occurs there. The results are plotted in a rearranged form in Figure 7(b), where the horizontal axis is loading amplitude and the vertical axis is temperature amplitude of 2f-component. It can be seen in Figure 7(b), the curves for different loading cycles tend to converge to a curve if plastic shakedown occurs. According to the one-curve method proposed by Curti et al. [13], the fatigue limit is determined by intersection of a linear line formed by least squares approximation of plots for a specific number of cycles and the horizontal axis. For loading cycles over 500, the fatigue limit can be determined to be 5.6 kN as shown in Figure 7(b). The one-curve method cannot be applied to loading amplitude lower than 5.0 kN since the plastic shakedown does not occur.
cycles are compared in Figure 8(a). Although not only plastic shakedown but also other factors cause energy dissipation in experiment, these results are fairly comparable. Numerical results are larger than experimental results especially for larger loading amplitude because heat conduction is neglected in the numerical simulation. The fatigue limits (FL1 = 5.4 kN and FL2 = 5.8 kN) are determined by applying one-curve method and two-curve method, respectively, to the experimental data. Two-curve method was introduced by Luong [2], in which the fatigue limit is determined by intersection of two lines as shown in Figure 8(a).
The result of fatigue limit evaluation is summarized in Figure 8(b). Fatigue limit cannot be evaluated from Element_3 because only elastic shakedown occurs there. The data obtained from Element_2 provide overestimation of the fatigue limit. Fatigue limit evaluated from Element_1 (5.6 kN) agrees fairly well with that obtained by Wöhler method (5.7 kN) and infrared thermography measurement (5.4 kN by one-curve method and 5.8 kN by two-curve method) except for relatively small number of cycles. These facts mean that the temperature evolution should be measured at an appropriate position (highest stress) and at a sufficiently large number of cycles.
6 Concluding remarks
It can be concluded that rapid fatigue limit evaluation by detecting of 2f-component amplitude can be used once plastic shakedown occurs. Because heat conduction is neglected in this study, the temperature evolutions obtained from numerical analysis are somewhat larger than thermography experiment results especially for larger loading amplitude. Further study is required to consider the effect of heat conduction and heat transfer on the temperature evolution.
References
1. F.H. Vitovec and B.J. Lazan, WADC Technical Report, 53-122 (1953)
2. M.P. Luong, Infrared thermographic scanning of fatigue in metals, Nuclear Engineering and Design,158, 363–376 (1995)
3. G. Pitarresi and E.A. Patterson, A review of the general theory of thermoelastic stress analysis, Journal of Strain Analysis, 38, 405–417 (2003)
4. M.A. Biot, Thermoelasticity and irreversible thermodynamics, Journal of Applied Physics,
27(3), 240–253 (1956)
5. F. Dunne and N. Petrinic, Introduction to Computational Plasticity, Oxford University Press (2007)
6. N. Ohno and J.D. Wang, Kinematic hardening rules with critical state of dynamic recovery, part 1: Formulation and basic features for ratcheting behavior, International Journal of Plasticity, 9, 375-390 (1993)
7. N. Ohno and J.D. Wang, Kinematic hardening rules with critical state of dynamic recovery, part 2: Application to experiments of ratcheting behavior, International Journal of Plasticity, 9, 391– 403 (1993)
8. G. Kang and Q. Kan, Constitutive modeling for uniaxial time-dependent ratcheting of SS304 stainless steel, Mechanics of Materials, 39, 488–499 (2007)
9. Databook on Fatigue Strength of Metallic Materials, 2. The Society of Materials Science, Japan - Elsevier (1996)
10. Technical Handbook of Stainless Steels, Atlas Specialty Metals (2006)
11. G. Kang, Q. Kan, J. Zhang and Y. Sun, Time dependent ratcheting experiments of SS304 stainless steel, International Journal of Plasticity, 22, 858–894 (2006)
12. M.L. Pastor, X. Balandrauda, M. Grdiaca and J.L. Robert, Applying infrared thermography to study the heating of 2024-T3 aluminium specimens under fatigue loading, Infrared Physics & Technology, 51, 505–515 (2008)