Evaluation of the Opening the
World of Learning (OWL) Early
Literacy Program:
Final Report
Submitted to:
Ann Vilcheck
Project Manager, Academic Research
Pearson
501 Boylson Street, Suite 900
Boston, MA 02116
Email: [email protected]
Submitted by:
Noraini Abdullah-Welsh, PhD, Project Director
Jim Schmidt, PhD, Research Associate
Sara Hahn, Research Associate
Armando Tafoya, Research Associate
Marisela Sifuentes, Research Assistant
EXECUTIVE SUMMARY
Pearson contracted with WestEd to develop and conduct an external evaluation of the
Opening the World of Learning
(
OWL
) early literacy curriculum beginning in June 2008.
WestEd employed a rigorous quasi-experimental, matched comparison study to examine the
extent to which the program successfully improved the early literacy development of preschool
students and factors that contribute to the ability of teachers to implement
OWL
with high
fidelity.
Our approach consisted of both formative and summative components and employed mixed
methods, combining quantitative and qualitative data collections. This combination of strategies
provided multiple, independent sources of data about various aspects of the
OWL
curriculum and
its impact on student early literacy. The formative evaluation of the
OWL
curriculum provided
information to stakeholders concerning implementation fidelity, as well as factors contributing to
the ability of teachers to implement the curriculum. Program implementation data was collected
using
OWL
implementation logs, online teacher survey, and site visits of treatment preschools
(that included classroom observations and teacher interviews/focus groups). The summative or
outcome evaluation focused on whether the
OWL
curriculum has achieved its primary objective,
i.e., for preschool students to demonstrate reliable gains on measures of early literacy (namely,
the
Peabody Picture Vocabulary Test
, Third Edition (PPVT-III)).
Together, the formative and summative data collection and analyses addressed the
following key research questions:
•
What is the impact of the
OWL
curriculum on students’ early literacy as
measured by reliable and valid assessment tools? Do students in public
preschools implementing
OWL
make greater gains than comparable students?
•
Do some subpopulations of students benefit more from
OWL
than others?
(e.g., English Language Learners, low socioeconomic status)
•
What factors contribute to the ability of teachers to implement
OWL
with high
fidelity?
o
Is the professional development that teachers receive of sufficient intensity,
duration, and quality?
The data we collected and analyzed attempted to answer these questions by determining the
program’s impact on preschool children’s early literacy as well as understanding the factors that
influenced faithful implementation of the curriculum.
Analyses of gains made by students in the treatment group indicate for all students and
each student subgroup (except White students) made statistically significant gains from their
pretest to posttest scores in their standard scores, percentile ranks, and age equivalence scores.
For the complete group of treatment students exhibited a mean gain of 6.29 standardized scores
from pretest to posttest. The mean gains for subgroups ranged from 4.67 for students in half-day
programs to 10.84 for English Language Learners. We found similar results using percentile
ranks as the measure of change. On average, students whose teachers implemented the OWL
program increased over 10 percentile ranks from pretest to posttest. Treatment students also
demonstrated statistically significant gains in age equivalency scores. On average, they showed
over a one-year gain. These findings were consistent across subgroups based on FRPL eligibility,
ELL status, ethnicity, gender, and program (full or half-day). Although analysis of the PPVT-III
showed that students who were exposed to the
OWL
curriculum demonstrated larger learning
gains than students exposed to the control programs, there was no significant difference in gains
made between the two groups of students. Our data collection and analysis of the implementation
of the
OWL
curriculum also generated a number of key findings.
First, teachers were implementing the
OWL
curriculum with high fidelity and provided
high ratings on the ease of implementation and for students to follow the curriculum. They listed
three factors that were vital to the ease of implementation of the
OWL
curriculum: (1) clear, easy
to follow, and thorough directions for implementation; (2) the suggested activities resulted in
high levels of student engagement; and (3) the core books were central. Although there were
aspects of the curriculum that were difficult to implement (namely,
Let’s Find Out About It/Let’s
Talk About It
, math, and small group activities), they readily modified the curriculum to meet the
needs of the English Language Learners, mixed-age groups, and academic needs of their
students. They also provided feedback on how the curriculum could be improved (namely, the
inclusion of more manipulatives for the math activities or books for English Language Learners).
Second, teachers who participated in workshops on teaching the
OWL
curriculum found
them to be useful but they would like additional
OWL
workshops to help them implement the
curriculum more effectively. Teachers were also receiving a lot of on-site support in
These on-going supports ranged from weekly professional development to cross-site
collaborations where they shared ideas on
OWL
curriculum implementation.
Third, teachers reported high levels of student engagement through the use of the
OWL
curriculum because the topics were relevant to the students’ life experiences and the hands-on
activities were attractive and fun for the students. They also cited the core books as a
contributing factor in high student engagement.
Finally, there were a number of
OWL
materials that would have been invaluable resources
for the teachers but were not used as frequently, namely:
Adaptations for ELL
,
Adaptations for
the Mixed-Age Group
, and
Math Activity Aids
. This could be rectified by providing workshops
on how teachers could more effectively use these resources or soliciting their direct feedback on
how these could be improved to be more effective. Many teachers attended
OWL
workshops
when they first adopted the curriculum up to three years ago so a refresher course might be
beneficial.
TABLE OF CONTENTS
EXECUTIVE SUMMARY ...I
INTRODUCTION... 1
BACKGROUND AND PURPOSE... 2
B
RIEFL
ITERATURER
EVIEW... 2
P
ROGRAMO
VERVIEW... 3
P
URPOSE OF THES
TUDY... 4
O
VERVIEW OFW
ESTE
D’
SE
VALUATIONA
PPROACH... 5
METHODS ... 7
E
VALUATIOND
ESIGN... 7
S
TUDYS
AMPLE... 8
M
EASURESU
SED TOA
SSESSP
ROGRAMI
MPLEMENTATION ANDI
MPACT... 12
Measures of Program Impact ... 13
Measures of Program Implementation ... 13
RESULTS ... 16
D
ESCRIPTION OF THES
TUDYS
AMPLE... 16
P
OWERA
NALYSIS... 20
F
INDINGS ON THEI
MPACT ONS
TUDENTS’
E
ARLYL
ITERACYD
EVELOPMENT... 20
Description of Analytic Methods ... 20
Model Specification ... 28
Findings Based on Analysis of PPVT-III Data ... 32
F
INDINGS ONP
ROGRAMI
MPLEMENTATION... 35
Data Analysis ... 35
Implementation Logs... 36
Online Teacher Survey... 42
Classroom Observations... 45
Post Interviews... 47
DISCUSSION ... 49
I
NTERPRETATION OF THER
ESULTS... 49
E
XTENT TO WHICH THER
ESULTSM
AY BEG
ENERALIZED... 53
F
ACTORS THATM
AYA
CCOUNT FOR THEO
BSERVEDI
MPACT... 54
P
ROBLEMS THATO
CCURREDI
N IMPLEMENTING THEE
VALUATIOND
ESIGN... 55
CONCLUSIONS ... 56
S
UMMARY OFK
EYF
INDINGS... 56
REFERENCES... 58
APPENDICES ... 60
A
PPENDIXA:
OWL
I
MPLEMENTATIONL
OG... 61
Pearson Implementation Log Data... 73
A
PPENDIXB:
O
NLINET
EACHERS
URVEY... 98
Online Teacher Survey Data... 103
Pearson Pre-Observation Data ... 112
A
PPENDIXD:
OWL
T
EACHERP
OSTI
NTERVIEW... 113
Pearson Post Interview Data ... 114
A
PPENDIXE:
OWL
C
LASSROOMS
ITEV
ISIT... 120
INTRODUCTION
Pearson contracted with WestEd to develop and conduct an external evaluation of the
Opening the World of Learning
(
OWL
) early literacy curriculum beginning in June 2008. The
WestEd evaluation approach comprised a mixed method study that used the
Peabody Picture
Vocabulary,
Third Edition (PPVT-III) to determine the impact of the
OWL
curriculum on the
early literacy development of preschool students and on-line teacher surveys,
OWL
implementation logs, and site visits (that included classroom observations and teacher
interviews/focus groups) to examine factors that contribute to teachers’ ability to implement the
OWL
curriculum with high fidelity.
This Final Report discusses the evaluation activities and findings for the study. We begin
with the background and purpose of the
OWL
study, followed by a discussion of methods used
and results, and conclude with a summary of findings and significance of findings for key
stakeholders.
BACKGROUND AND PURPOSE
WestEd conducted an evaluation of the effectiveness and impact of the
Opening the World
of Learning
(
OWL
) early literacy curriculum on children’s early literacy development. Our
evaluation attempted to determine:
•
What is the impact of the
OWL
curriculum on students’ early literacy as
measured by reliable and valid assessment tools? Do students in public
preschools implementing
OWL
make greater gains than comparable students?
•
Do some subpopulations of students benefit more from
OWL
than others?
(e.g., English Language Learners, low socioeconomic status)
•
What factors contribute to the ability of teachers to implement
OWL
with high
fidelity?
o
What aspects of the curriculum make it easy to implement? Are there aspects that
make it difficult to implement?
o
Does
OWL
engage children? Do children find some
OWL
themes more or less
engaging than others?
o
Is classroom management sufficiently addressed by the
OWL
curriculum?
o
Is the professional development that teachers receive of sufficient intensity,
duration, and quality?
Brief Literature Review
It is abundantly clear from research (Barnett, Jung, Wong, Cook, & Lamy, 2007; Cannon &
Karoly, 2007; Gormley, Gayer, Phillips, & Dawson, 2005) that well-designed preschool
programs serving children one or two years before kindergarten entry can improve measures of
school readiness and increase performance on academic achievement tests in the early
elementary grades. Early language development is also related to long-term reading success as
well as the development of socio-emotional skills (Sirin, 2005; Hart & Risley, 1995). Reading
research demonstrates that early literacy development begins before children start kindergarten
morphemic awareness. Preschool language skills support the development of phonemic
awareness and play a critical role in promoting reading comprehension in the middle grades.
Research also indicates that in addition to the short-term impact on school achievement, the
early development of cognitive skills builds a strong foundation for success that is sustained
through adulthood (National Scientific Council on the Developing Child, 2007; Schweinhart,
Montie, Xiang, Barnett, Belfield, & Nores, 2005). A number of studies have shown that the
amount of time children spent talking with and listening to adults, as well as the quality of the
conversations, were strongly associated with children’s language development (McCartney,
1984; Dickinson, 2001). Dickinson (2001) found that children benefited the most when their
conversations with teachers were sustained, included varied vocabulary, and encouraged to think
and use language to discuss ideas, as well as past and future events. Consequently, children’s
preschool experience plays a critical role in supporting the development of reading skills.
No reading program can be effective without teachers possessing adequate levels of
knowledge and skill. The National Reading Panel (NRP) Report addressed the need for teachers
to participate in training that would enable them to provide a comprehensive reading program.
Other research findings also indicate that teachers who engaged in sustained professional
development efforts adopted new practices that improve the quality of their instruction in
language and literacy development, which in turn translated to improved children’s learning
(Dickinson, Anastasopoulos, Miller, Caswell, & Peisner-Feinberg, 2002).
Program Overview
By drawing upon scientifically based reading research such as the works cited above, the
OWL
curriculum targets early literacy abilities and provides preschool children with instructional
supports focused on multiple aspects of reading development. The principles that guided the
development of the
OWL
curriculum are based on research on best practices in early childhood
development:
•
OWL
provides a comprehensive approach that targets all critical early literacy
skills by addressing all components in an integrated fashion, not in isolation,
through activities that promote the utilization of different language modalities
and components.
•
By focusing on language,
OWL
emphasizes and supports children’s language
learning experiences by systematically embedding attention to vocabulary
within meaningful extended discourse through book reading and teacher-child
conversations.
•
Attention to phonological awareness through activities such as singing,
reading predictable books, teacher-led games, and child-initiated writing
activities enables preschool children to attend to the sounds of language.
•
By learning about letters,
OWL
teaches children about the link between
recognition of letters and writing. Through repeated teacher-led games and
child-initiated activities, children experiment with letters as they learn to
distinguish the shapes and sound of the different letters, as well as associate
letters with their names.
•
Acquiring social skills is a critical component of early childhood experiences
as children learn self-control and how to negotiate social interactions.
OWL
provides explicit instruction in these areas by interweaving discussions of
social and emotional issues into discussions about books and conversations
about on-going classroom events. Children also engage in repeated group
activities designed to keep them on task and motivating child-initiated
activities that they can either do individually or with others.
•
OWL
promotes a learning community by nurturing in children a desire to learn
and a sense of competence as learners. It helps children become
self-sustaining learners by increasing children’s awareness of words and interest in
learning them, enabling them to discover that they can use writing for their
own purposes, as well as by drawing their interest to books and learning from
different types of books.
Purpose of the Study
Developed by Pearson, the
OWL
early literacy curriculum is based on research in reading
and early childhood education. To date, the program developers have conducted three pilot
studies to examine the effectiveness of the program in improving early literacy development in
preschool children. However, these studies involved small sample sizes and did not include
comparison groups. WestEd proposed a larger scale evaluation study of the
OWL
curriculum
with approximately 800 preschool children in the treatment and comparison groups combined.
We selected treatment schools from a list of preschools that were implementing the
OWL
program and found matched comparison schools. To attain the desired sample size, we recruited
up to nine preschools in public school districts located in the south and southwest of the United
language, numeracy, socio-emotional, cognitive, and gross motor development in a language–
enriched environment, our evaluation attempted to document the degree to which the program’s
comprehensive approach to preschool services enhances early literacy outcomes. It also
examined the effectiveness of the
OWL
professional development opportunities in enabling
teachers to implement the program with fidelity in their classrooms and provide
recommendations on how these offerings could be improved.
Finally, the National Early Literacy Panel (NELP) Report (2008) discussed a number of
gaps in the existing research on early literacy development that include: lack of studies with clear
literacy outcome measures and efficacy studies of programs that examine the impact of programs
as implemented by “real” preschool teachers within the context of “real” classrooms. Although
conceptualized prior to the release of the NELP Report, the WestEd evaluation study of the
OWL
curriculum is clearly a step towards addressing these gaps.
Overview of WestEd’s Evaluation Approach
WestEd’s evaluation of the
OWL
early literacy curriculum examined the extent to which it
has successfully improved preschool children’s development of their early literacy and the extent
to which the professional development activities adequately prepared teachers to implement the
program effectively. Our approach consisted of both formative and summative components and
employed mixed methods, combining quantitative and qualitative data collections. This
combination of strategies provided multiple, independent sources of data about various aspects
of the
OWL
curriculum and its impact on student early literacy.
Formative evaluations helped structure programs by providing information that facilitates
program development, improves service delivery, and/or enhances program outcomes. The
formative evaluation of the
OWL
curriculum provided information to stakeholders concerning
implementation fidelity, as well as factors contributing to the ability of teachers to implement the
curriculum. The summative or outcome evaluation focused on whether the
OWL
curriculum has
achieved its primary objective, i.e., for preschool students to demonstrate reliable gains on
measures of early literacy.
Together, the formative and summative data collection and analyses addressed the
following key research questions:
•
What is the impact of the
OWL
curriculum on student early literacy as
measured by reliable and valid assessment tools? Do students in public
preschools implementing
OWL
make greater gains than comparable students?
•
Do some subpopulations of students benefit more from
OWL
than others?
(e.g., English Language Learners, low socioeconomic status)
•
What factors contribute to the ability of teachers to implement
OWL
with high
fidelity?
o
What aspects of the curriculum make it easy to implement? Are there aspects that
make it difficult to implement?
o
Does
OWL
engage children? Do children find some
OWL
themes more or less
engaging than others?
o
Is classroom management sufficiently addressed by the
OWL
curriculum?
o
Is the professional development that teachers receive of sufficient intensity,
duration, and quality?
The data we collected and analyzed attempted to answer these questions by determining the
curriculum’s impact on preschool children’s early literacy as well as understanding the factors
that influenced faithful implementation of the curriculum.
METHODS
In this section, we describe the evaluation design (including the method for selecting sites),
study sample, and measures used to examine program implementation and impact.
Evaluation Design
WestEd employed a rigorous quasi-experimental, matched comparison study to assess the
implementation and effectiveness of the
OWL
early literacy curriculum. Quasi-experimental
designs do not use random assignment of participants to intervention and control groups but
instead depend on applying appropriate measurement and statistical controls to nonequivalent
groups to determine intervention impacts on the outcomes of interest. Our design relied on a
matching process using cluster analysis to create a viable comparison group. We believe this to
be the most appropriate evaluation design given the parameters of program implementation and
the research questions to be addressed. The design included two conditions: (1) a treatment
group comprising of approximately 300 preschoolers in public preschools implementing
OWL
;
and 2) a matched comparison group of about 300 preschoolers in preschools not implementing
OWL
.
A critical aspect of our formative evaluation was the use of implementation logs to assess
the fidelity of implementation of the
OWL
curriculum and to identify those factors predictive of
good versus poor implementation. We also conducted classroom observations to gather
contextual information on classroom implementation. Additionally, we used an on-line teacher
survey to address broader issues of implementation (i.e., the curriculum and professional
development). Both quantitative and qualitative data were collected as part of our formative
evaluation.
Our summative or outcome evaluation relied heavily on the assessment of preschoolers’
literacy skills and the collection and analysis of quantitative data. We used the
Peabody Picture
Vocabulary Test
-Third Edition (PPVT-III), an assessment mandated by the US Department of
Education to meet the Government Performance and Results Act (GPRA) requirements for all
Early Reading First grantees.
This combination of methods and attention to the triangulation of findings across data
sources will yield useful information for the further refinement of the
OWL
curriculum and
teacher professional development.
Study Sample
Our first task was to select preschool classrooms for participation in the treatment
condition. We initially targeted Early Reading First (ERF) preschools that were implementing
the
OWL
curriculum and drew a sample of classrooms from ERF funded preschools provided to
WestEd by Pearson. Several factors were considered when we selected the classrooms for the
treatment condition including, but not limited to, the following:
•
Geographic region (i.e., urban public preschools in the central, west,
northeast, and southeast)
•
The existing use of the PPVT-III (i.e., whether or not literacy assessments
were already being implemented in the classroom)
•
Teacher experience using the
OWL
curriculum
•
District/school characteristics
The selection criteria were finalized with input from Pearson. WestEd began the
recruitment process for treatment schools by contacting ERF coordinators to determine their
interest in participating in the study. However, the effort did not lead to any ERF schools in the
sample so we expanded to recruit other public preschools that were implementing the
OWL
curriculum and PPVT-III. We sent a letter describing the study and explaining the requirements
for treatment group participation. We followed up with a phone call to answer questions and
further solicit study participation. Recruiting public preschools that implemented the
OWL
curriculum and PPVT-III proved to be challenging because not all schools that implemented the
OWL
program administered the PPVT-III as part of their regular practice.
Once schools were recruited for treatment group participation, matched comparison
classrooms were selected. Our initial preference was to select treatment and comparison
classrooms within the same school; however, this was not possible due to school-wide
implementation of the
OWL
curriculum. We also discovered that the
OWL
curriculum was being
implemented district-wide. Therefore, we used cluster analysis to recruit matched districts and
classrooms within them for the comparison condition. Among the factors we used in the cluster
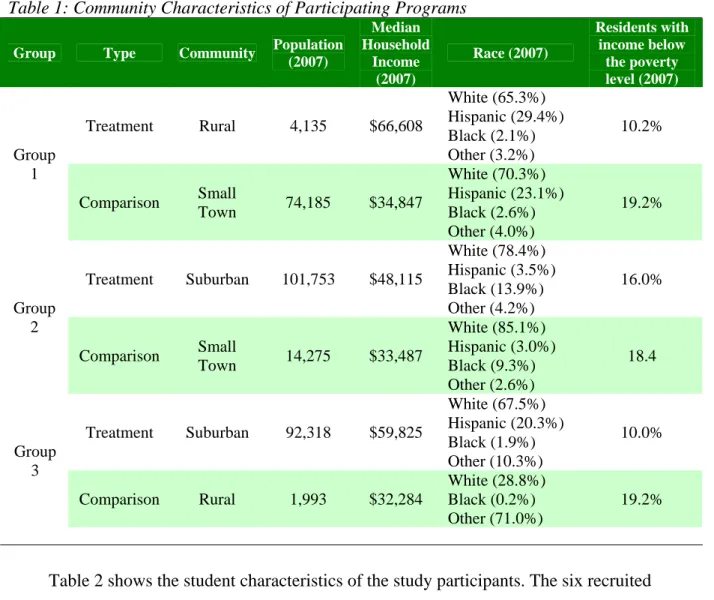
books for the classroom library). Table 1 describes the community characteristics of the six
programs recruited to participate in the study.
Table 1: Community Characteristics of Participating Programs
Group Type Community Population (2007) Median Household Income (2007) Race (2007) Residents with income below the poverty level (2007) Treatment Rural 4,135 $66,608 White (65.3%) Hispanic (29.4%) Black (2.1%) Other (3.2%) 10.2% Group 1 Comparison Small Town 74,185 $34,847 White (70.3%) Hispanic (23.1%) Black (2.6%) Other (4.0%) 19.2% Treatment Suburban 101,753 $48,115 White (78.4%) Hispanic (3.5%) Black (13.9%) Other (4.2%) 16.0% Group 2 Comparison Small Town 14,275 $33,487 White (85.1%) Hispanic (3.0%) Black (9.3%) Other (2.6%) 18.4 Treatment Suburban 92,318 $59,825 White (67.5%) Hispanic (20.3%) Black (1.9%) Other (10.3%) 10.0% Group 3 Comparison Rural 1,993 $32,284 White (28.8%) Black (0.2%) Other (71.0%) 19.2%
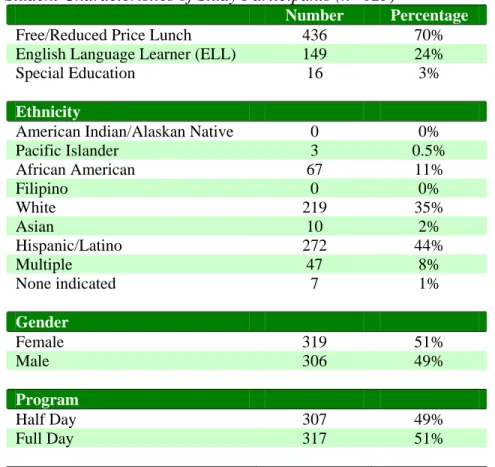
Table 2 shows the student characteristics of the study participants. The six recruited
programs provided service to a total of 625 students in public preschools in California and
Tennessee. About 70 percent (n=436) of the students in the
OWL
study were on free/reduced
price lunch and 24 percent (n=149) were identified as English Language Learners. About 3
percent (n=16) were identified as special education students.
Table 2: Student Characteristics of Study Participants (n=625)
Number Percentage
Free/Reduced Price Lunch 436 70%
English Language Learner (ELL) 149 24%
Special Education 16 3%
Ethnicity
American Indian/Alaskan Native 0 0%
Pacific Islander 3 0.5% African American 67 11% Filipino 0 0% White 219 35% Asian 10 2% Hispanic/Latino 272 44% Multiple 47 8% None indicated 7 1% Gender Female 319 51% Male 306 49% Program Half Day 307 49% Full Day 317 51%
Hispanic/Latino students were the largest group at 44 percent (n=272), followed by White
students at 35 percent (n=219), African-American students at 11 percent (n=67), and Asian at 2
percent (n=10). Eight percent (n=47) were of multiple ethnicities. There were 7 students (1
percent) whose ethnicities were unknown and less than 1 percent (n=3) who were
Pacific-Islanders. About 51 percent (n=319) of the students were female and 49 percent (n=306) were
male. Finally, approximately 51 percent (n=317) participated in full day and 49 percent (n=307)
were in the half day preschool programs.
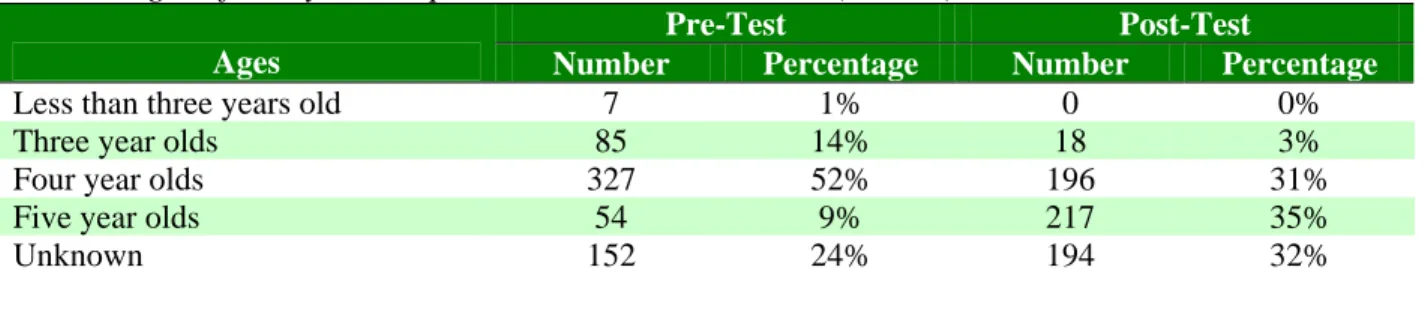
Table 3 compares the ages of the students at pre- and post-test. At pre-test, about 52
percent (n=327) were four years of age, 14 percent (n=85) were three years old, and 9 percent
(n=54) were five years old. At post-test, 35 percent (n=217) were five years old, 31 percent
Table 3: Ages of Study Participants at Pre- and Post-Test (n=625)
Pre-Test Post-Test
Ages Number Percentage Number Percentage
Less than three years old 7 1% 0 0%
Three year olds 85 14% 18 3%
Four year olds 327 52% 196 31%
Five year olds 54 9% 217 35%
Unknown 152 24% 194 32%
Table 4 shows the teacher characteristics of the teacher participants (including years of
teaching experience, certification, and length of time they had used the curriculum).
Table 4: Teacher Characteristics of Study Participants (n=34)
Length of Teaching Experience Number Percentage
0 to 5 years 9 26%
6 to 10 years 7 21%
11 to 15 years 0 0%
16 to 20 years 3 9%
More than 20 years 2 6%
Unknown 13 38%
Certification*
Early Childhood Education Units 14 37%
Preschool 6 16%
Other 5 13%
Unknown 13 34%
Highest Degree Attained
Associate degree from community college 4 12%
Bachelor’s degree from a four-year college 12 35%
Master’s degree 2 6%
Post-graduate degree 3 9%
Unknown 13 38%
Length of Time Used the Curriculum
Less than one year 4 18%
One to three years 17 77%
Four to six years 1 5%
More than six years 0 0%
Unknown 12 35%
* Some comparison teachers selected more than one response to certification item
We were also unable determine teacher characteristics from about a third of the teachers
because they did not provide the requested information on either the online teacher survey or in
response to email requests. The available data indicate that approximately 26 percent (n=9) of
the teachers had 0 to 5, 21 percent (n=7) had 6 to 10 (n=6), and 15 percent (n=5) had 16 or more
years of teaching experience. About 37 percent (n=14) had completed early childhood education
units, 16 percent (n=6) were certified to teach preschool, and 13 percent (n=5) had other
certification. About 35 percent (n=12) of the teachers had a bachelor’s degree from a four-year
college, 12 percent (n=4) had an associate degree from community college, 6 percent (n=2) had a
Master’s degree, and 9 percent (n=3) had post-graduate degree. Finally, over 50 percent (n=17)
had been using their existing preschool curriculum for one to three years and 18 percent (n=4)
for less than one year.
Measures Used to Assess Program Implementation and Impact
To assess program implementation, WestEd developed and used evaluation tools (i.e.,
implementation logs/surveys) that are described below and included in the Appendix. Pearson
reviewed and approved the WestEd-developed instruments (namely, the classroom observation
protocol, implementation log, and online teacher survey), which were also reviewed and
approved through an IRB process. In addition, we used an individually administered assessment
to determine program impact on preschool students. Table 5 summarizes the research questions
and the measures used.
Table 5: Research Questions and Data Sources
Questions
Data Source
•
What is the impact of the
OWL
curriculum on student early
literacy as measured by reliable and valid assessment tools? Do
students in public preschools implementing
OWL
make greater
gains than comparable students?
PPVT-III
•
Do some subpopulations of students benefit more from
OWL
than others? (e.g., English language Learners, low
socioeconomic status)
PPVT-III
•
What factors contribute to the ability of teachers to implement
OWL
with high fidelity?
o
What aspects of the curriculum make it easy to implement?
Are there aspects that make it difficult to implement?
o
Does
OWL
engage children? Do children find some
OWL
themes more or less engaging than others?
Classroom observation,
teacher focus groups,
online teacher survey,
implementation logs
Measures of Program Impact
Children’s literacy skills were measured using the
Peabody Picture Vocabulary Test-Third
Edition, Receptive
(PPVT-III). The PPVT-III has demonstrated good reliability and validity as a
measure of children’s emerging literacy and pre-reading skills and is a required Government and
Performance Results Act (GPRA) indicator for Early Reading First (ERF) grantees. The
PPVT-III is a 204-item test in Standard English administered by having children point to one of four
pictures shown when given a word to identify (Dunn & Dunn, 1997). The PPVT-III directly
measures vocabulary size, with the rank order of item difficulty being highly correlated with
word use frequency. This test is also used as a quick indicator of general cognitive ability,
correlating with other measures of linguistic and cognitive development related to school
success.
Although some recruited public preschools did not administer the PPVT-III, they
volunteered to do so as part of their participation in the
OWL
study. WestEd staff trained
teachers at these schools in the use of the PPVT-III. In addition, we purchased and loaned the
testing booklets to the schools so they could administer the assessments at no cost. The schools
provided their pretest PPVT-III data by January 2009, and the posttest data was submitted by the
end of July 2009.
Measures of Program Implementation
Measures of program implementation were collected through classroom observations and
teacher interviews/focus groups, online teacher survey, and implementation logs.
Implementation log
The fidelity with which the
OWL
curriculum is implemented was assessed using an
implementation log developed by WestEd and completed by teachers who implemented the
OWL
curriculum (see Appendix A:
OWL Implementation Log
). We began the process of instrument
development by examining assessments already in place. Implementation fidelity was assessed
for each four- to six-week theme of the
OWL
curriculum, which permitted the identification of
implementation issues specific to each unit. Teachers were asked questions regarding the length
of time they took to implement the
OWL
unit, ease in the use of the materials and its
effectiveness in engaging students, possible modifications made to the
OWL
materials, their use
of supplemental program, and their feedback on the component or activity that was most difficult
to implement.
On-line Teacher Survey
Teachers who implemented the
OWL
curriculum were surveyed to help gain a deeper
understanding of the factors contributing to the ability of teachers to implement the
OWL
curriculum with high fidelity (Appendix B:
On-Line Teacher Survey
). The survey included items
assessing the quality of teacher professional development, aspects of the curriculum facilitating
implementation (i.e., adequacy of materials and other resources, child engagement) and
classroom management (i.e., re-teaching concepts). The survey consisted of both close-ended
(i.e., Likert-scaled) and open-ended items. The use of an on-line survey eased instrument
administration in multi-site contexts and facilitated centralized data management. Although a
hard copy was available for teachers unable or unwilling to complete the assessment on-line, all
teachers who responded did so online.
Site Visits
To gain insight into teacher implementation of the
OWL
curriculum, two WestEd staff
members conducted site visits to the three treatment schools in December 2008 and May 2009.
The site visits included observations of: eight classrooms in Treatment 1; seven classrooms in
Treatment 2; and three classrooms in Treatment 3. The site visits were intended to determine the
level of implementation and impact of the
OWL
curriculum. The visits included pre- and
post-observation teacher interviews/focus groups and classroom post-observations.
Through the pre-observation teacher interviews, WestEd staff collected contextual
information such as the unit being implemented, materials being used, and the classroom
objective for the day (Appendix C:
OWL Pre-Observation
). Instead of conducting individual
post-observation interviews because of teacher time constraints, WestEd staff conducted onsite
post-observation teacher focus groups that lasted approximately an hour. During the focus
groups, teachers discussed: strengths of the
OWL
curriculum; barriers they experienced with the
curriculum and how these were overcome; support or guidance they received from their school
site or program coordinator in implementing the
OWL
curriculum; their use of non-
OWL
supplementals; training/professional development they attended to assist in their implementation
of the
OWL
curriculum;
OWL
materials that they use daily; and whether they found the materials
to conduct the classroom observations (Appendix E). The checklist also allowed WestEd staff to
examine the overall implementation of the
OWL
curriculum in each treatment school.
RESULTS
In this section, we describe the study sample (including the types of programs in the
comparison preschools and the curriculum being implemented, followed by a description of the
students and teacher characteristics in both the treatment and comparison preschools. We also
discuss the power analysis, findings from our analysis of the measures of program impact on
students’ early literacy development (including a description of analytic method and model
specification) and program implementation (namely, the Implementation Logs, On-Line Teacher
Survey, and Site Visits).
Description of the Study Sample
We recruited six public preschool programs during an eight-month recruitment period and
terminated recruitment efforts in February 2009 to allow ample time to occur between the
administration of the pre- and post-treatment PPVT-III. Through the recruitment, we discovered
that the PPVT-III was not administered consistently across all six preschools. Although two
treatment preschools and one comparison preschool administered the PPVT-III, the test was only
administered once upon admission into their preschool program. Also, the preschools did not use
the two forms as pre- and post-test and instead regularly administered Form A in the fall and
Form B in the spring admission.
However, the preschools were willing to administer the PPVT-III as part of their
participation in the
OWL
study. Consequently, we purchased the PPVT-III for all six preschools
to administer the PPVT-III as post-test in the spring or as both pre-test and post-test. Because
some preschools were recruited earlier than others, there was also a longer time period between
the pre- and post-test at some of the preschools (as seen in Table 6). At Treatment 1, we
combined the PPVT-III data for students who were tested in April and May 2008 with those
tested in fall 2008 as pre-test to increase the sample size because the coordinator would not retest
the children in fall 2008.
Table 6 also shows the timelines for the administration of the PPVT-III at each preschool
and the type of curriculum being implemented. There were six public preschools in the study –
three treatment and three comparison sites. Four preschools were located in California and two
Table 6: Treatment and Comparison Preschools: Curriculum and PPVT-III Testing Timelines
Group Type Curriculum Program Type Pre-PPVT-III
Timeline
Post-PPVT-III Timeline Treatment 1 Opening the
World of
Learning (OWL)
6 half day and 2 full day classrooms April, May, September, October, November, December May Group 1
Comparison 1 Other 4 half day
classrooms
December May
Treatment 2 Opening the World of Learning (OWL) 7 full day classrooms December, January, February May Group 2
Comparison 2 Other 7 full day
classrooms
September, November
May Treatment 3 Opening the
World of Learning (OWL) 3 half day classrooms September, October, November May Group 3
Comparison 3 Other 1 full day
classroom
February May
Table 7 shows the distribution of students across the sites. A total of 625 students and 30
teachers in six public preschools participated in the study. About 53 percent (n=176) of the
students were at Treatment 1, 36 percent (n=120) at Treatment 2, and about 11 percent (n=37) at
Treatment 3. In addition, about 45 percent of the students were at Comparison 1 (n=133) and
Comparison 2 (n=131), and about 10 percent (n=28) were at Comparison 3.
Table 7: Treatment and Comparison Preschool Programs: Program Type, Number of Teachers,
and Number and Percentage of Students by Preschool Program
Number of Teachers (n=30) Number of Students (n=625) Percentage of Students Treatment Program Treatment 1 8 176 53% Treatment 2 7 120 36% Treatment 3 3 37 11% Total 18 333 Comparison Program Comparison 1 4 133 46% Comparison 2 7 131 45% Comparison 3 1 28 10% Total 12 292
As seen in Table 8, there were 333 preschool students in the treatment preschools and 292
in the comparison preschools.
Table 8: Demographics of Treatment and Comparison Students
Treatment (n=333) Comparison (n=292)
Number Percentage Number Percentage
Free/Reduced Price Lunch 230 69% 200 68%
English Language Learner (ELL) 120 36% 29 10%
Special Education 16 5% 0 0%
Ethnicity
American Indian/Alaskan Native 0 0% 0 0%
Pacific Islander 1 0.3% 2 1% African American 42 13% 25 9% Filipino 0 0% 0 0% White 90 27% 129 44% Asian 9 3% 1 0.3% Hispanic/Latino 163 49% 109 37% Multiple 28 8% 19 7% None indicated 0 0% 7 2% Gender Female 167 50% 152 52% Male 166 50% 140 48% Program Half Day 174 52% 133 46% Full Day 159 48% 158 54%
There were slightly more students on free/reduced price lunch at the treatment than at
comparison preschools. Sixty-nine percent (n=230) of treatment students were on free lunch and
reduced price lunch. Sixty-eight percent comparison students (n=200) were on free lunch and
reduced priced lunch. Thirty-six percent (n=120) of treatment
students were identified as English
Language Learners and 29 (10 percent) were in the comparison group. There were 167 female
(50 percent) and 166 male (50 percent) students in the treatment programs and 152 female (52
percent) and 140 male (48 percent) students in the comparison programs. Fifty-two percent
(n=174) of treatment
students were enrolled in half day and 48 percent (n=159) in full day
percent of treatment teachers (n=6) and 44 percent (n=7) of the comparison teachers because
they did not provide the requested information.
Table 9: Comparison of Teacher Characteristics: Treatment and Comparison Programs (n=34)
Treatment (n=18) Comparison (n=16)
Length of Teaching Experience Number Percentage Number Percentage
0 to 5 years 5 28% 4 25%
6 to 10 years 6 33% 1 6%
11 to 15 years 0 0% 0 0%
16 to 20 years 1 6% 2 13%
More than 20 years 0 0% 2 13%
Unknown 6 33% 7 44%
Certification*
Early Childhood Education Units 6 33% 8 40%
Preschool 1 6% 5 25%
Other 5 28% 0 0%
Unknown 6 33% 7 35%
Highest Degree Attained
Associate degree from community college 0 0% 4 25%
Bachelor’s degree from a four-year college 8 44% 4 25%
Master’s degree 1 6% 1 6%
Post-graduate degree 3 17% 0 0%
Unknown 6 33% 7 44%
Length of Time Used the Curriculum
Less than one year 3 17% 1 6%
One to three years 9 50% 8 50%
Four to six years 1 6% 0 0%
More than six year 0 0% 0 0%
Unknown 5 28% 7 44%
* Some comparison teachers selected more than one response to certification item.
The available data indicates that more treatment teachers had 0 to 5 and 6 to 10 years of
teaching experience than the comparison teachers. About 25 percent of the comparison teachers
had 0 to 5 years (n=4), 13 percent (n=2) had 16 to 20, and 13 percent (n=2) had more than 20
years of teaching experience. Only 6 percent (n=1) of treatment teachers had 16 to 20 years of
teaching experience and none had more than 20 years of experience. Forty percent (n=8) of
comparison teachers had completed early childhood units and 33 percent (n=6) of treatment
teachers had. In addition, 25 percent (n=5) of comparison teachers were certified to teach
preschool in contrast to 6 percent (n=1) of treatment teachers.
Twenty-eight percent (n=5) of treatment teachers had other certification. Forty-four percent
(n=8) of treatment teachers had bachelor’s degree from a four-year college and about 25 percent
(n=4) of comparison teachers did. Seventeen percent (n=3) of the treatment teachers had
post-graduate degrees and none in the comparison group did. An analysis of the length of time the
teachers had used their preschool curriculum indicated that a majority of teachers in both groups
had been using their preschool curriculum for one to three years.
Power Analysis
Our preliminary estimate of the sample size for the treatment and comparison sites was
determined using power analysis. Given an expected small effect size (.20) with a significance
criterion (alpha) of .05 and with a power level of .80 (a typically agreed-upon power level), the
necessary sample size was calculated at 786. Using that estimate of the needed sample size, and
allowing for attrition, we had decided upon sample sizes of 400 each for the treatment and
comparison groups with a total sample of approximately 800 preschoolers. Difficulty
encountered in recruiting public preschools resulted in a sample size of 625. However, our
statistician informed us that the number of students post-tested would be sufficient for
determining small to medium effect size using one measure and power = .80 and alpha set at .05
(conventional levels).
Findings on the Impact on Students’ Early Literacy Development
In this section, we describe the analytic methods and model specification used to determine
the impact of the
OWL
curriculum on the early literacy development of preschool students,
followed by a discussion of the findings to address the following research questions:
•
What is the impact of the
OWL
curriculum on student early literacy as
measured by reliable and valid assessment tools?
•
Do some subpopulations of
stu
dents benefit more from
OWL
than others?
(e.g., English Language Learners, low socioeconomic status)
•
Do students in public preschools implementing
OWL
make greater gains than
comparable students?
treatment group came from three preschool programs in three districts. The comparison group
students were from three preschool programs in three different districts. Pretest and posttest data
were available for 345 children, 218 target children and 127 comparison children.
Treatment Group Analysis
This portion of the report describes the learning gains revealed by performance on the
PPVT-III by
OWL
participants during the study period. Three outcome measures were
investigated (standard scores, percentile ranks, and age equivalence scores) both for participants
overall and for participant subgroups. Participant subgroups were defined by eligibility for free/
reduced-price lunch, English language learners, ethnicity, gender and program (full or half-day).
Sub-group analysis addressed two questions: 1) Are gains statistically significant for subgroups
and; 2) are there differences in gains between the categories of the subgroups? We performed
paired sample
t
-tests using pretest and posttest PPVT-III scores to address the first question and
independent samples
t
-tests to address the question of differences between subgroup populations.
In the case of the ethnicity-defined subgroup, which has three categories, we performed a
one-way analysis of variance (ANOVA) with post-hoc
t
-tests to examine subgroup-category
differences. Table 10 presents the results to the first question: What is the impact of the
OWL
curriculum on student early literacy, specifically: Are gains statistically significant overall and
for subgroups?
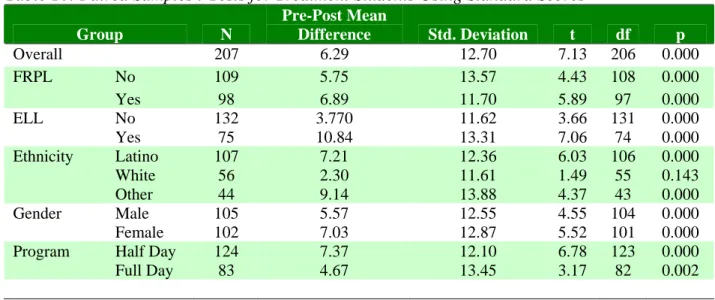
Table 10: Paired Samples t-Tests for Treatment Students Using Standard Scores
Group N Pre-Post Mean Difference Std. Deviation t df p Overall 207 6.29 12.70 7.13 206 0.000 No 109 5.75 13.57 4.43 108 0.000 FRPL Yes 98 6.89 11.70 5.89 97 0.000 No 132 3.770 11.62 3.66 131 0.000 ELL Yes 75 10.84 13.31 7.06 74 0.000 Latino 107 7.21 12.36 6.03 106 0.000 White 56 2.30 11.61 1.49 55 0.143 Ethnicity Other 44 9.14 13.88 4.37 43 0.000 Male 105 5.57 12.55 4.55 104 0.000 Gender Female 102 7.03 12.87 5.52 101 0.000 Half Day 124 7.37 12.10 6.78 123 0.000 Program Full Day 83 4.67 13.45 3.17 82 0.002
Results show that for the whole group and for each subgroup category (with one
exception), treatment students made statistically significant gains from pretest to posttest scores.
The exception was with white children, whose gains were not statistically significant. The
overall gain for the whole group was 6.29 standard scores. The range of gains for the subgroups
was 2.30 for children designated as “White” to 10.84 for ELL students.
The next analysis addressed the question: Are there differences in gains by treatment
subjects within subgroup categories? For example, do gains for students in full day programs
differ from gains for students in half-day programs? Tables 11 and 12 display results.
Table 11: Independent Samples t-Tests for Treatment Students Using Standard Scores
Group N Mean Difference Std. Error of Difference t df p
FRPL 207 -1.14 1.77 -0.64 205 0.522
ELL 207 -7.14 1.77 -4.03 205 0.000
Gender 207 -1.46 1.77 -0.83 205 0.410
Program 207 2.69 1.79 1.50 205 0.135
Table 12: One-Way ANOVA for Treatment Students Using Standard Scores
Ethnicity N Sum of Squares Mean Square F df p
Between Groups 207 1336.11 668.06 4.275 2 0.015
Within Groups 207 31882.50 156.29 204
Total 207 33218.61 206
Table 11 shows that there are statistically significant differences in mean gains between
pretest and posttest between English language learners (
M
= 10.84) and non-English language
learners (
M
= 3.70), with English language learners making significantly higher gains (
p
< .001)
than non-English language learners do.
There were also significant differences in gains among ethnic groups, as seen in Table 12.
Post-hoc analysis revealed that the only significant difference was between the white and other
group of treatment students, as seen in Table 13. Students in the ethnic group “Other” showed
higher gains than the white students did (
M
= 9.137,
M
= 2.3, respectively).
Table 13: Post-Hoc Tests for Treatment Students by Ethnicity Using Standard Scores
Ethnicity Mean Difference Std. Error p
Latino White 4.90 2.06 0.055
We performed similar analyses for the treatment group, using percentile ranks as the
outcome variable. Tables 14 displays the results for the analysis that addressed the question “Are
gains statistically significant for all treatment students and treatment student subgroups?” We
performed non-parametric tests (Wilcoxon signed-rank test) for outcomes measured on a
continuous, non-interval scale.
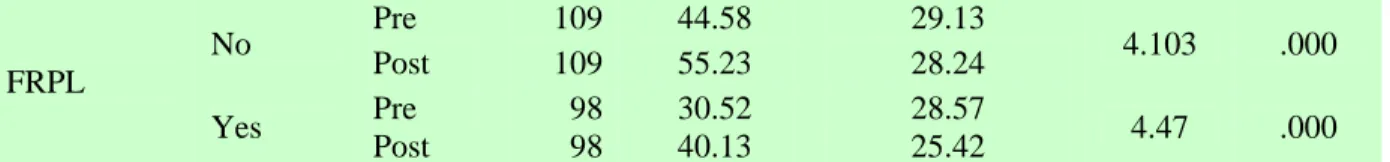
Table 14: Paired Samples Wilcoxon Signed Ranks Tests for Treatment Students Using
Percentile Ranks
Group Rank N Mean Std. Deviation Z p
Pre 207 37.92 29.64 Overall Post 207 48.08 27.92 6.029 .000 Pre 109 44.58 29.13 No Post 109 55.23 28.24 4.103 .000 Pre 98 30.52 28.57 FRPL Yes Post 98 40.13 25.42 4.47 .000 Pre 132 48.97 28.49 No Post 132 55.30 25.78 3.23 .001 Pre 75 18.48 20.21 ELL Yes Post 75 35.38 27.14 5.49 .000 Pre 107 26.40 24.46 Latino Post 107 37.90 25.92 4.89 .000 Pre 56 58.77 26.32 White Post 56 62.70 25.09 1.40 .160 Pre 44 39.41 30.81 Ethnicity Other Post 44 54.25 26.40 3.34 .001 Pre 105 38.11 29.00 Male Post 105 47.52 28.43 4.42 .000 Pre 102 37.73 30.43 Gender Female Post 102 48.67 27.50 4.13 .000 Pre 124 35.17 29.00 Half Day Post 124 47.57 29.43 5.95 .000 Pre 83 42.03 31.53 Program Full Day Post 83 48.86 25.65 2.32 .020
The result displayed in Table 14 show that the changes in percentile ranks from pretest to
posttest were statistically significant or all subgroups, except for the ethnicity group “White.”
The mean gain in percentile ranks was over 10 points; subgroups changes in percentile ranks
ranged from about 4 points for white students to almost 17 points for ELL students.
The next analysis addressed the question “Are there differences in gains between the
categories of the subgroups?” We performed non-parametric (Mann-Whitney U) tests to address
this question. Table 15 displays the results of the analysis.
Table 15: Mann-Whitney U Tests for Treatment Students Using Percentile Ranks
Group N Pre-Post Mean Difference Std. Deviation Z p No 109 10.65 25.14 FRPL Yes 98 9.62 20.81 0.210 0.833 No 132 6.34 22.15 ELL Yes 75 16.90 23.47 3.099 .002 Latino 107 11.50 22.21 White 56 3.92 21.54 Ethnicity Other 44 14.84 26.06 7.1111 0.029 Male 105 9.41 22.32 Gender Female 102 10.94 24.04 0.059 0.953 Half Day 124 12.39 21.70 Program Full Day 83 6.83 24.92 1.576 0.115 1Kruskal Wallis Test with Chi-Square statistic used for Ethnicity.
Results of the analysis for differences among subgroup categories for treatment students
using change in percentile ranks are similar to those of the analysis of the standard scores.
English language learners showed a greater gain in percentile ranks (
M
= 10.65) than
non-English Language Learners (
M
= 6.34) and ethnicity group “Other” showed a significant
difference in change in percentile ranks (
M
= 14.84 from “White” (
M
= 3.92).
The final analysis of the treatment group looked at changes in age equivalency scores. We
addressed the same research questions as in the two preceding analyses: Are gains statistically
significant for all treatment participants and subgroups and; 2) are there differences in gains
between the categories of the subgroups? The results of the analysis to address the first question
are displayed below in Table 16.
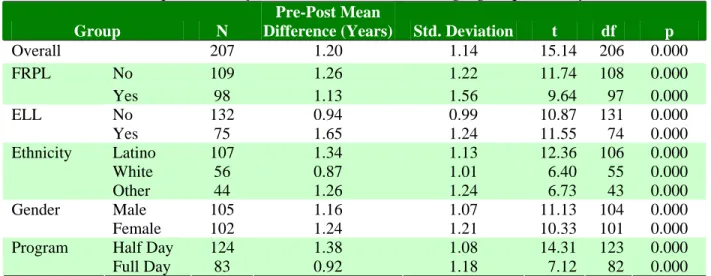
Table 16: Paired Samples t-Tests for Treatment Students Using Age Equivalency Scores
Group N
Pre-Post Mean
Difference (Years) Std. Deviation t df p
Overall 207 1.20 1.14 15.14 206 0.000 No 109 1.26 1.22 11.74 108 0.000 FRPL Yes 98 1.13 1.56 9.64 97 0.000 No 132 0.94 0.99 10.87 131 0.000 ELL
The results show that there were statistically significant gains in age equivalency scores for
the treatment group from pretest to posttest, both overall, and for each subgroup category. The
average age equivalency change for the whole treatment group was a little over one year. The
age equivalency changes for the subgroups ranged from 0.92 for students in full-day programs to
1.65 years for ELL students. These results differ slightly from the standard score and percentile
rank analysis; the ethnicity group “White” (mean gain = .87 years,
p
< .001) did not show
significant gains on the other two outcome measures. As seen with the other outcome measures,
a diverse group of students whose teachers implemented the
OWL
curriculum exhibited
significant gains from pretest to posttest.
Tables 17 and 18 show the results for the analysis that addressed the question of whether
there were differences among the subgroup categories in age equivalency scores.
Table 17: Independent Samples t-Tests for Treatment Students Using Age Equivalency Scores
Group N Mean Difference (Months) Std. Error of Difference t df p FRPL 207 1.64 1.90 .861 205 0.390 ELL 207 -8.45 2.00 -4.22 205 0.000 Gender 207 -0.95 1.90 -0.49 205 0.619 Program 207 5.57 1.90 2.93 205 0.004
Table 18: One-Way ANOVA for Treatment Students Using Age Equivalency Scores
Ethnicity N Sum of Squares Mean Square F df p Between Groups 207 1235.45 617.73 3.391 2 0.036 Within Groups 207 37164.90 182.18 204 Total 207 38400.35 206
As seen in the analysis of standard scores, Table 17 shows that there are statistically
significant differences in mean gains in age equivalency scores between pretest and posttest
between English language learners (
M
= 19.76) and non-English language learners (
M
= 11.31),
with English language learners making significantly higher gains (
p
< .001) than non-English
language learners do. Not seen in the other outcome measures, there is also a significant
difference (
p
< .05) in the change in age equivalency scores between those participants who were
enrolled in half-day programs (
M
= 16.60) and those participants who attend full day programs
(
M
= 11.04).
There were also significant differences in gains among ethnic groups, as seen in Table 18.
Post-hoc analysis revealed that the only significant difference was between the white and other
group of treatment students, displayed in Table 19. Students in the ethnic group “Other” showed
higher gains than the white students did (
M
= 9.137,
M
= 2.3, respectively).
Table 19: Post-Hoc Tests for Treatment Students by Ethnicity Using Age Equivalency Scores
Ethnicity Mean Difference (Months) Std. Error p Latino White 5.72 2.23 0.033 Other 0.99 2.42 1.000 White Latino -5.72 2.23 0.033 Other -4.73 2.72 0.251 Other Latino -0.99 2.42 1.000 White 4.73 2.72 0.251There were a small number of students (n=11) from the target group designated as Special
Education students, but none from the comparison group. We removed these students from the
final analysis sample to further maintain group comparability. However, a separate analysis of
these 11 students showed that they exhibited increased scores on the PPVT-III. The average
change in standard scores from pretest to posttest was a gain of 7.1 (
SD
= 14.73); the average
gain in percentile ranks was 5.3 (
SD
= 17.13). The resultant outcome analysis data consisted of
207 treatment and 124 comparison students (total n = 334).
Treatment and Comparison Group Equivalency Analysis
We performed an analysis to test the equivalency between the treatment group students and
the comparison group students on several key demographic features. The counts and percents for
gender, race/ethnicity, primary language, eligibility for free or reduced-price lunch (FRPL),
English Language Learners, and whether they attended full or half day classes for the two groups
of students are displayed in Table 20.
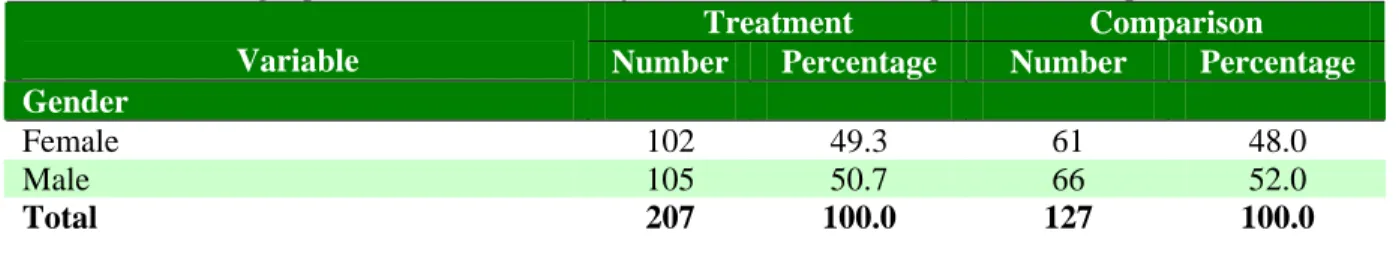
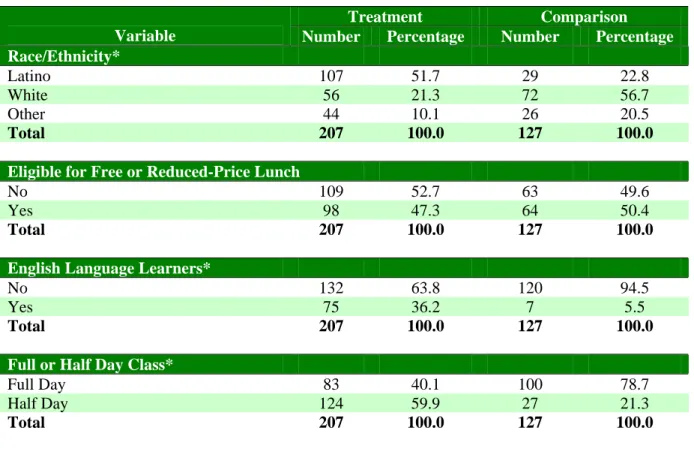
Table 20: Demographic Characteristics of Treatment and Comparison Group Students
Treatment Comparison
Variable Number Percentage Number Percentage
Treatment Comparison
Variable Number Percentage Number Percentage
Race/Ethnicity*
Latino 107 51.7 29 22.8
White 56 21.3 72 56.7
Other 44 10.1 26 20.5
Total 207 100.0 127 100.0
Eligible for Free or Reduced-Price Lunch
No 109 52.7 63 49.6
Yes 98 47.3 64 50.4
Total 207 100.0 127 100.0
English Language Learners*
No 132 63.8 120 94.5
Yes 75 36.2 7 5.5
Total 207 100.0 127 100.0
Full or Half Day Class*
Full Day 83 40.1 100 78.7
Half Day 124 59.9 27 21.3
Total 207 100.0 127 100.0
*Significant at p < .001
We performed tests to see if any of the observed differences between the groups were
statistically significant. Contingency Coefficient (C) tests for nominal data revealed that the
groups differ statistically on three of the characteristics: race/ethnicity, C = .305, p < .001;
English Language Learners, C = .327, p < .001; and full/half day class, C = .353, p < .001.
We also checked for group differences in age at pretest, time between testing, and pretest
scores. We observed statistically significant differences between the groups in age at pretest and
number of months between pretest and posttest. Differences in standardized pretest scores were
not significant. Results are displayed in Table 21.
Table 21: Group differences in age at pretest, time between testing, and pretest scores
Variable N Mean Std. Deviation Mean Difference t df p Treatment 207 4.2128 .54991 Age at Pretest Comparison 124 4.5592 .33407 -.346 -7.130 329 .000 Treatment 207 7.00 2.708 Number of Months Between Pre and Post Test
Comparison 122 6.23 1.184 .766 3.535 327 .000
Treatment 207 92.3382 16.75470 .385 .226 332 .821
Standardized
Model Specification
Our original analysis plan called for running analysis of covariance (ANCOVA), with
posttest standardized scores as the dependent variable, group membership (treatment vs.
comparison) as the dependent variable, while controlling for standardized pretest scores. We
used the standardized scores because different forms of the PPVT were used and raw scores from
different test forms are not equivalent (Williams & Wang, 1997). However, preliminary analysis
determined that the data did not meet the necessary assumptions for ANCOVA. ANCOVA
assumes equal sample sizes and homogeneity of slopes. An initial analysis of variance
(ANOVA) of pretest and posttest scores revealed that the slopes of the two groups were not
homogenous (see Figure 1). Research has shown that this violation can result in a Type I Error
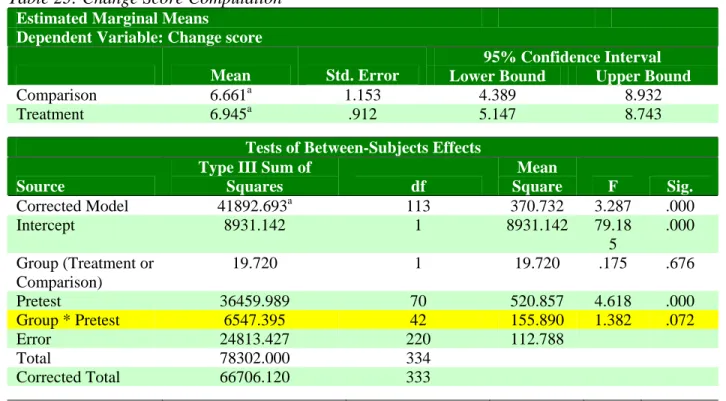
(Hamilton, 1977). Results of the ANOVA are displayed in Table 22.
Table 22: Results of the ANOVA
Estimated Marginal MeansDependent Variable: Standardized Posttest Scores
95% Confidence Interval Mean
Std.
Error Lower Bound Upper Bound
Comparison 97.309a 1.014 95.313 99.304
Treatment 98.559a .794 96.997 100.122
Tests of Between-Subjects Effects Source
Type III Sum of
Squares df Mean Square F Sig. Corrected Model 21333.799a 3 7111.266 58.475 .000 Intercept 31205.487 1 31205.48 7 256.599 .000 Group (Treatment or Comparison) 2843.253 1 2843.253 23.380 .000 Pretest 10136.510 1 10136.51 0 83.351 .000 Group * Pretest 3113.278 1 3113.278 25.600 .000 Error 40131.854 330 121.612 Total 3274692.000 334 Corrected Total 61465.653 333