Content of Higher Fatty Acids in Green Vegetables
R. VIdRIh
1*, S. FIlIp
2and J. hRIbaR
11department of Food Science and Technology, biotechnical Faculty, University of ljubljana, SI-1111 ljubljana, Slovenia; 2pekarna pečjak, d.o.o., SI-1291 Škofljica, Slovenia,
*E-mail: rajko.vidrih@bf.uni-lj.si
Abstract: Green vegetables are considered an important source of some nutritionally important constituents that have health benefits (e.g. vitamins, minerals, antioxidants, fibre). Epidemiological data suggest that consuming a diet rich in fruit and vegetables can lower the risks for chronic diseases, such as cardiovascular diseases and cancer. Over the past 100–150 years, there have been enormous increases in the consumption of omega-6 fatty acids due to the increased intake of vegetable oils from various seeds. Studies have indicated that a high intake of omega-6 fatty acids shifts the physiological state to one that is prothrombotic and pro-aggregatory, whereas omega-3 fatty acids have anti-inflammatory, antithrombotic, anti-arrhythmic, hypolipidemic and vasodilatory properties. Literature data regarding the contents of higher fatty acids (e.g. omega-6 fatty acids) in vegetables are scarce, although vegetables are known to contain a high proportion of n-3 fatty acids. Here, the fatty acid content and composition was determined for 26 green vegetables that are commonly available in Slovenia, by gas-liquid chromatography and in situ transesterification. The fatty acid analysis revealed C16:0, C16:1, C18:0, C18:1, C18:2n-6 and C18:3n-3. The total fatty acid content in the veg-etables ranged from 500 mg/100 g fresh weight (f.w.) in red cabbage, to 4.000 mg/100 g f.w. in tarragon. The proportion of saturated fatty acids (as g/100 g total fatty acids) ranged from 12% to 35%. All of the vegetables contained a high proportion of poly-unsaturated fatty acids (PUFAs), ranging from 45% to 81% of total fatty acids. The omega-3 PUFA proportion ranged from 5% in carrot to 60% in tarragon. The content of mono-unsaturated fatty acids ranged from 1% to 25%. French beans, tarragon and radish sprouts contained the highest concentrations of C16:1, at 5 mg/100 g f.w. Consumption of 100 g of tarragon meets 13.2% of daily requirements for α-linolenic acid; similarly, for radish sprouts 9.4%, for mangold 6.9%, for ruccola 5.4%, for green salad 5.0%, and for kale 4.7%. Green vegetables are an important source of 18:3n-3 PUFAs, especially for vegetarian populations.
Keywords: higher fatty acids; green vegetables; gas-liquid chromatography
IntroduCtIon
The omega-3 (n-3) fatty acids are essential fatty acids, and they are necessary from conception throughout life (Innis 1993; Simopoulos 1997; Simopoulos et al. 1999; Connor 2000; Bahri et al. 2002; de Lorgeril & Salen 2004). Indeed, a dietary recommendation for prevention of car-diovascular diseases is the regular consumption of n-3 fatty acids. Fish and fish oils contain long-chain polyunsaturated fatty acids (PUFAs; e.g. eicosapentaenoic and docosahexaenoic acid) that have preventive roles in coronary heart diseases (Brophy 2009). In the past, the human diet con-tained approximately equal amounts of omega-6
(n-6) and n-3 essential fatty acids (Simopoulos 2002); a reducedconsumption of foods rich in n-3 fatty acids and an increased consumption of n-6 fatty acids results in an imbalance in the ratio of n-6/n-3 fatty acids. An n-6/n-3 ratio from 4 to 10 has been recommended in various countries.
While the n-3 series of PUFAs are present mainly in fish oils (e.g. from cod, salmon, sardine, sole), the n-6 series are more common in vegetable oils (e.g. from seeds of grape, corn, sunflower). Guil et al. (1996) have shown high n-3/n-6 ratios in some wild plants, which would thus indicate good nutritional qualities with respect to these fatty acids. α-linolenic acid (C18:3) is part of the n-3 series, and it is known to be present in many plants
(Ghafoorunissa & Pangrekar 1993; Pereira et al. 2001; Liu et al. 2002), along with C16:3n-3 in some plant species (Mongrand et al. 1998). α-linolenic acid can also act as a precursor of long-chain PUFAs. However, although α-linolenic acid has been shown to increase the synthesis of long-chain PUFAs (Liou et al. 2007), according to Indu and Ghafoorunissa (1992), high long-term intake of α-linolenic acid provides only modest benefits compared to fish oils. It has also been shown that supplementation of high doses of α-linolenic acid, in the form of linseed oil, produce antiaggregatory effects (Budowski 1988). The aim of the present study was to determine the importance of green vegetables as a source of fatty acids, and especially of α-linolenic acid.
MAtErIAL And MEtHodS
Samples.All of the green vegetable, mushroom and legume samples were purchased fresh in a market in Ljubljana. The edible portions were separated from those non-edible, and washed under running tap water. Excess water was removed in a kitchen centrifuge; the edible portion was then dehydrated immediately by lyophilisation.
Preparation of methyl esters of fatty acids. Fatty acid methyl esters (FAMEs) were prepared from the lyophilised samples of green vegetables, mush-rooms and some legumes according to the method described by Garces and Mancha (1993).
Analytical conditions.The FAMEs were sepa-rated using an HP 6890 N gas chromatograph (Agi-lent Technologies, Palo Alto, CA, USA) equipped with a flame ionisation detector and a Supelco SPB-PUFA capillary column (No: 24314; 30 m × 0.25 mm × 0.5 μm); the column temperature was kept at 210°C. The injector temperature was 220°C and the detector temperature 280°C. The flow
rate of the carrier gas (He, Istrabenz 99.9999%) was 1.0 ml/min.
The following fatty acids were detected in green vegetables: C16:0, C16:1, C18:0, C18:1, C18:2n-6, C18:3n-3. Reliability and accuracy of the ana-lytical methods for the detection of fatty acids were ensured by the use of the certified reference matrix that consisted of a mixture of 37 FAME standards (Supelco 37 Component FAME mix, Sigma-Aldrich, St. Louis, MO, USA). The amounts of each of the fatty acids were calculated from the areas of the internal standards (heptadecanoic acid). The contents of the particular fatty acids are expressed as percentages of the sum of all of the fatty acids analysed.
Statistical methods. The data were evaluated using the method of variance analysis with the Duncan test (p < 0.05) of the SAS/SAT Software programme.
rESuLtS And dISCuSSIon
Following the methods described by Garces and Mancha (1993), the average contents of the fatty acids in samples from green vegetables, mushrooms and some legumes are presented in Table 1. The most abundant was linoleic acid (C18:2), followed by α-linolenic acid (C18:3). The average ratio of n-6n/n-3 is 1.45, and it is thus very suitable ac-cording to nutritional recommendations.
The total fatty acid concentrations of the veg-etables under study ranged from 500 mg/100 g f.w. in red cabbage, to 4.000 mg/100 g f.w. in tar-ragon. The differences among the different fatty acid contents (as g/100 g total fatty acids) were statistically significant (p < 0.05), with the excep-tion of C16:1.
According to the fatty acid compositions listed in Table 2, these vegetables can be divided in the following groups:
Table 1. Average fatty acid composition of the green vegetables, mushrooms and legumes analysed, and average rela-tive levels of these fatty acids
Average content of fatty acids in all samples (mg/100 g f.w.)
C16:0 C16:1 C18:0 C18:1 C18:2 C18:3
402.58 22.96 61.70 258.07 833.42 623.44
Average relative levels of fatty acids (%a)
22.15 1.20 3.66 7.67 38.70 26.62
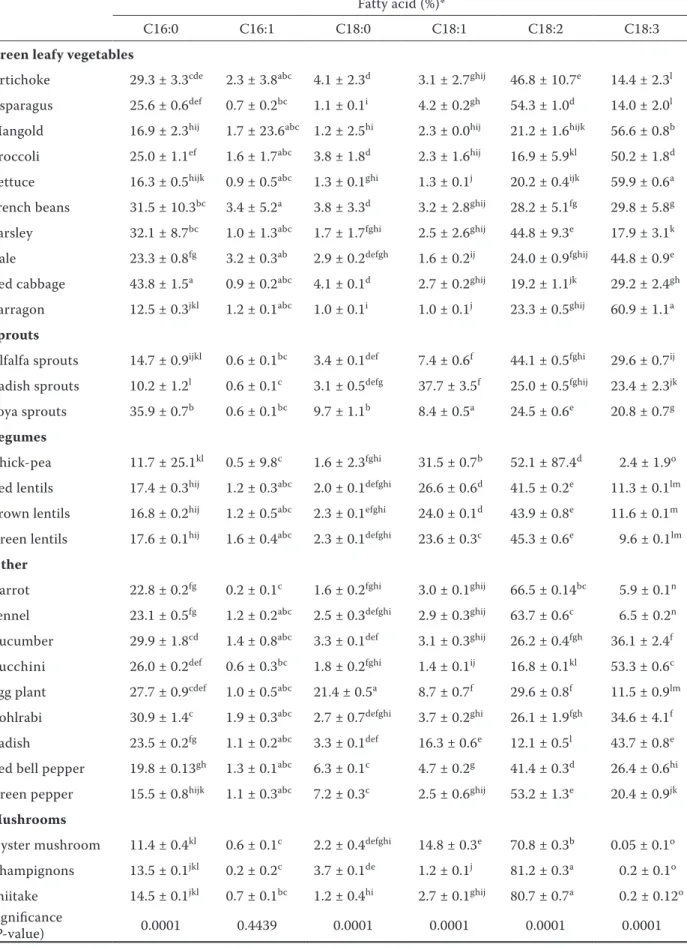
Table 2. Fatty acid composition of vegetables
Fatty acid (%)*
C16:0 C16:1 C18:0 C18:1 C18:2 C18:3
Green leafy vegetables
Artichoke 29.3 ± 3.3cde 2.3 ± 3.8abc 4.1 ± 2.3d 3.1 ± 2.7ghij 46.8 ± 10.7e 14.4 ± 2.3l
Asparagus 25.6 ± 0.6def 0.7 ± 0.2bc 1.1 ± 0.1i 4.2 ± 0.2gh 54.3 ± 1.0d 14.0 ± 2.0l
Mangold 16.9 ± 2.3hij 1.7 ± 23.6abc 1.2 ± 2.5hi 2.3 ± 0.0hij 21.2 ± 1.6hijk 56.6 ± 0.8b
Broccoli 25.0 ± 1.1ef 1.6 ± 1.7abc 3.8 ± 1.8d 2.3 ± 1.6hij 16.9 ± 5.9kl 50.2 ± 1.8d
Lettuce 16.3 ± 0.5hijk 0.9 ± 0.5abc 1.3 ± 0.1ghi 1.3 ± 0.1j 20.2 ± 0.4ijk 59.9 ± 0.6a
French beans 31.5 ± 10.3bc 3.4 ± 5.2a 3.8 ± 3.3d 3.2 ± 2.8ghij 28.2 ± 5.1fg 29.8 ± 5.8g
Parsley 32.1 ± 8.7bc 1.0 ± 1.3abc 1.7 ± 1.7fghi 2.5 ± 2.6ghij 44.8 ± 9.3e 17.9 ± 3.1k
Kale 23.3 ± 0.8fg 3.2 ± 0.3ab 2.9 ± 0.2defgh 1.6 ± 0.2ij 24.0 ± 0.9fghij 44.8 ± 0.9e
Red cabbage 43.8 ± 1.5a 0.9 ± 0.2abc 4.1 ± 0.1d 2.7 ± 0.2ghij 19.2 ± 1.1jk 29.2 ± 2.4gh
Tarragon 12.5 ± 0.3jkl 1.2 ± 0.1abc 1.0 ± 0.1i 1.0 ± 0.1j 23.3 ± 0.5ghij 60.9 ± 1.1a
Sprouts
Alfalfa sprouts 14.7 ± 0.9ijkl 0.6 ± 0.1bc 3.4 ± 0.1def 7.4 ± 0.6f 44.1 ± 0.5fghi 29.6 ± 0.7ij
Radish sprouts 10.2 ± 1.2l 0.6 ± 0.1c 3.1 ± 0.5defg 37.7 ± 3.5f 25.0 ± 0.5fghij 23.4 ± 2.3jk
Soya sprouts 35.9 ± 0.7b 0.6 ± 0.1bc 9.7 ± 1.1b 8.4 ± 0.5a 24.5 ± 0.6e 20.8 ± 0.7g
Legumes
Chick-pea 11.7 ± 25.1kl 0.5 ± 9.8c 1.6 ± 2.3fghi 31.5 ± 0.7b 52.1 ± 87.4d 2.4 ± 1.9o
Red lentils 17.4 ± 0.3hij 1.2 ± 0.3abc 2.0 ± 0.1defghi 26.6 ± 0.6d 41.5 ± 0.2e 11.3 ± 0.1lm
Brown lentils 16.8 ± 0.2hij 1.2 ± 0.5abc 2.3 ± 0.1efghi 24.0 ± 0.1d 43.9 ± 0.8e 11.6 ± 0.1m
Green lentils 17.6 ± 0.1hij 1.6 ± 0.4abc 2.3 ± 0.1defghi 23.6 ± 0.3c 45.3 ± 0.6e 9.6 ± 0.1lm
other
Carrot 22.8 ± 0.2fg 0.2 ± 0.1c 1.6 ± 0.2fghi 3.0 ± 0.1ghij 66.5 ± 0.14bc 5.9 ± 0.1n
Fennel 23.1 ± 0.5fg 1.2 ± 0.2abc 2.5 ± 0.3defghi 2.9 ± 0.3ghij 63.7 ± 0.6c 6.5 ± 0.2n
Cucumber 29.9 ± 1.8cd 1.4 ± 0.8abc 3.3 ± 0.1def 3.1 ± 0.3ghij 26.2 ± 0.4fgh 36.1 ± 2.4f
Zucchini 26.0 ± 0.2def 0.6 ± 0.3bc 1.8 ± 0.2fghi 1.4 ± 0.1ij 16.8 ± 0.1kl 53.3 ± 0.6c
Egg plant 27.7 ± 0.9cdef 1.0 ± 0.5abc 21.4 ± 0.5a 8.7 ± 0.7f 29.6 ± 0.8f 11.5 ± 0.9lm
Kohlrabi 30.9 ± 1.4c 1.9 ± 0.3abc 2.7 ± 0.7defghi 3.7 ± 0.2ghi 26.1 ± 1.9fgh 34.6 ± 4.1f
Radish 23.5 ± 0.2fg 1.1 ± 0.2abc 3.3 ± 0.1def 16.3 ± 0.6e 12.1 ± 0.5l 43.7 ± 0.8e
Red bell pepper 19.8 ± 0.13gh 1.3 ± 0.1abc 6.3 ± 0.1c 4.7 ± 0.2g 41.4 ± 0.3d 26.4 ± 0.6hi
Green pepper 15.5 ± 0.8hijk 1.1 ± 0.3abc 7.2 ± 0.3c 2.5 ± 0.6ghij 53.2 ± 1.3e 20.4 ± 0.9jk
Mushrooms
Oyster mushroom 11.4 ± 0.4kl 0.6 ± 0.1c 2.2 ± 0.4defghi 14.8 ± 0.3e 70.8 ± 0.3b 0.05 ± 0.1o
Champignons 13.5 ± 0.1jkl 0.2 ± 0.2c 3.7 ± 0.1de 1.2 ± 0.1j 81.2 ± 0.3a 0.2 ± 0.1o
Shiitake 14.5 ± 0.1jkl 0.7 ± 0.1bc 1.2 ± 0.4hi 2.7 ± 0.1ghij 80.7 ± 0.7a 0.2 ± 0.12o
Significance
(p-value) 0.0001 0.4439 0.0001 0.0001 0.0001 0.0001
1. Vegetables with high levels of C16:0 (> 30%): red cabbage (43.9%), soya sprouts (35.9%), parsley (32.1%), French beans (31.5%), and kohlrabi (31.0%);
2. Vegetables with high levels of C16:1 (> 2%): French beans (3.4%), kale (3.2%), artichoke (2.3%);
3. Vegetables with high levels of C18:0 (> 7%): egg plant (21.4%), soya sprouts (9.7%), and green pepper (7.3%);
4. Vegetables with high levels of C18:1 (> 30%): radish sprouts (37.7%), chick-pea (30.5%); 5. Vegetables with high levels of C18:2 (> 60%):
shiitake (81.2%), champignons (80.7%), oys-ter mushroom (70.8%), carrot (66.5%), fennel (63.7%);
6. Vegetables with high levels of C18:3 (> 50%): tarragon (61.0%), green lettuce (59.9%), man-gold (56.7%), zucchini (53.3%), and broccoli (50.2%).
Our data of the fatty acid contents generally cor-respond well to those of previous studies (Souci et al. 2000; Salvini et al. 2002 and USDA National Nutrient Database for Standard Reference 2005), although a slightly higher variation was seen for C18:2 and C18:3 in most of the vegetables. In mushrooms, in particular, our data for C18:2 show substantially higher values compared to those of Souci et al. (2000) and Salvini et al. (2002).
Tarragon, lettuce, ruccola, mangold and radish sprouts have the highest amounts of α-linolenic acid. According to current dietary recommen-dations, 100 g of tarragon would cover 13% of the daily needs for α-linolenic acid. In countries like China, where daily vegetable consumption can amount to 1 kg (personal communication), vegetable intake may indeed satisfy the needs for α-linolenic acid.
Ruccola, radish, courgette, green lettuce, broccoli, mangold, tarragon, kale, red cabbage, cucumber, kohlrabi and French beans all have an n-6n/n-3 ratio below 1. In developed countries, the actual n-6n/n-3 ratio in food is between 10 and 20 to 1, with the current recommendations for the n-6n/n-3 ratio as less than 10 to 1.
Only carrot, chick-pea, champignons, shiitake mushrooms and oyster mushrooms have an n-6/ n-3 ratio above 10. Green vegetables in general have a suitable n-6n/n-3 ratio, which corresponds to the current nutritional recommendations (Si-mopoulos 1999; Si(Si-mopoulos et al. 1999; Souci et al. 2000; Bahri et al. 2002; Salvini et al. 2002;
USDA National Nutrient Database for Standard Reference, 2005).
ConCLuSIonS
The method developed in the present study has proven to be reliable for the analysis of fatty acids in these vegetables. Our data correspond well with those of other studies, with the exception of mushrooms, where our data show higher values for C18:2. In general, higher variations were seen in our data for C18:2 and C18:3n-3.
From the nutritional point of view, the most im-portant components in vegetable are antioxidants (vitamins) and dietary fibre. The green vegetables in our study appear to be a good source of α-linolenic acid, and they also have a suitable n-6n/n-3 ratio. Although the content of fatty acids in vegetables is rather low, they still represent an important nu-tritional factor, which will be especially important in vegetarian populations.
references
Bahri D., Gusko A., Hamm M., Kasper H., Klor HU., Neuberger D., Singer P. (2002): Significance and recommended dietary intake of long-chain omega-3 fatty acids – A consensus statement of the omega-3 working group. Ernahrungs-Umschau, 49: 94. Brophy J.M. (2009): n-3 polyunsaturated fatty acids
re-duced morbidity and mortality in chronic heart failure. Annals of Internal Medicine, 150: 1–11.
Budowski P. (1988): ω-3 fatty acids in health and dis-ease. World Review of Nutrition and Dietetics, 57: 214–274.
Connor W.E. (2000): Importance of n-3 fatty acids in health and disease. American Journal of the Clinical Nutrition, 71: 171–175.
De Lorgeril M., Salen P. (2004): Alpha-linolenic acid and coronary heart disease. Nutrition Metabolism and Cardiovascular Diseases, 14: 162–169.
Garces R., Mancha M. (1993): One-step lipid extrac-tion and fatty acid methyl esters preparaextrac-tion from fresh plant tissues. Analytical Biochemistry, 211: 139–143.
Ghafoorunissa, Pangrekar J. (1993): Vegetables as source of α-linolenic acid in Indian diets. Food chem-istry, 47: 121–124.
Guil J.L., Torija M.E., Gimenez J.J., Rodriquez I. (1996): Identification of fatty acids in edible wild plants
by gas chromatography. Journal of chromatography A, 719: 229–235.
Indu M., Ghafoorunissa (1992): n-3 fatty acids in Indian diets – comparison of the effects of precur-sor (α-linolenic acid) vs product (long chain n-3 pol-yunsaturated fatty acids). Nutrition Research, 12: 569–582.
Innis S.M. (1993): Essential fatty-acid requirements in human-nutrition. Canadian Journal of Physiology and Pharmacology, 71: 699–706.
Liu L., Howe P., Zhou Y., Hocart C., Zhang R. (2002): Fatty acid profiles of leaves of nine edible wild plants: an Australian study. Journal of Food Lipids, 9: 65– 71.
Liou Y.A., King D.J., Zibrik D., Innis S.M. (2007): Decreasing linoleic acid with constant α-linolenic acid in dietary fats increases (n-3) eicosapentaenoic acid in plasma phospholipids in healthy men. Journal of Nutrition, 13: 945–952.
Mongrand S., Bessoule J.J., Cabantous F., Cassa-gne C. (1998): The C16:3\C18:3 fatty acid balance in photosynthetic tissues from 468 plant species. Phyto-chemistry, 49: 1049–1064.
Pereira C., Li D., Sinclair A.J. (2001): The α-linolenic acid content of green vegetables commonly available in Australia. International Journal of Vitamin and Nutrition Research, 71: 223–228.
Salvini S., Parpinel M., Gnagnarella P., Maison-neuve P., Turrini A. (2002): Food Composition Da-tabase for Epidemiological Studies in Italy. Milano. European Institute of Oncology. (2000) Availabel at: http://www.ieo.it/inglese/research/b_dati.htm (October 2005): 132–201.
SAS/SAT Software. Version 8.01. (1999): Cary, SAS Institute Inc: software.
Simopoulos A.P. (1997): Essential fatty acids in health and chronic disease. Food Reviews International, 13: 623–631.
Simopoulos A.P. (2002): Omega-3 fatty acids in wild plants, nuts and seeds. Asia Pacific Journal of Clinical Nutrition, Supplementum, 6(11): 163–173.
Simopoulos A.P., Leaf A., Salem N. (1999): Essenti-ality of and recommended dietary intakes for omega – 6 and omega – 3 fatty acids. Annals of Nutrition & Metabolism, 43: 127–130.
Souci S.W., Fachmann W., Kraut H. (2000): Food
Composition and Nutrition Tables. 5th Revised and
Completed Edition. Stuttgart, Scientific Publishers: 635–869.
USDA National Nutrient Database for Standard
Refer-ence. Release 18. 2005.USDA – United States
Depart-ment of Agriculture. (October 2005) Availabel at: http://www.nal.usda.gov/fnic/foodcomp/ (November 2005).