Annual Risk
Annual Risk
European Agency for the Management of Operational Cooperation at the External Borders of the Member States of the European Union
Rondo ONZ 1 00-124 Warsaw, Poland T +48 22 205 95 00 F +48 22 205 95 01 [email protected] www.frontex.europa.eu Warsaw, April 2013 Risk Analysis Unit
Frontex reference number: 4901
Printed version:
OPOCE Catalogue number: TT-AC-13-001-EN-C ISBN 978-92-95033-70-2
ISSN 1977-4451 DOI 10.2819/30496
Cover photo by Maciej Noskowski, © 2013 Photos.com, a division of Getty Images. All rights reserved.
DISCLAIMERS
This is a Frontex staff working document. This publication or its contents do not imply the expression of any opinion whatsoever on the part of Frontex concerning the legal status of any country, territory or city or its authorities, or concerning the delimitation of its frontiers or boundaries. All maps and charts included in this report are the sole property of Frontex and any unauthorised use is prohibited. Frontex disclaims any liability with respect to the bound-aries, names and designations used on the maps.
ACKNOWLEDGMENTS
The Frontex Annual Risk Analysis 2013 has been prepared by the Frontex Risk Analysis Unit. During the course of developing this product, many colleagues at Frontex and outside con-tributed to it and their assistance is hereby acknowledged with gratitude.
PDF:
TT-AC-13-001-EN-N ISBN 9978-92-95033-69-6 ISSN 1977-446X
Table of contents
Executive summary #5 1. Introduction #8 2. Methodology #9
3. Situational picture in 2012 #13
3.1. Passenger flow across the EU’s external borders #13 3.2. Visa #14
3.3. Illegal border-crossing #19 3.4. Detections of facilitators #35 3.5. Document fraud #37
3.6. Refusals of entry #40 3.7. Detections of illegal stay #41 3.8. Asylum applications #43 3.9. Returns #44
3.10. Other illegal activities #45 4. Environmental scan #56 5. Outlook #61
6. Conclusions #63 7. Statistical annex #64
CIRAM Common Integrated Risk Analysis Model
CIREFI Centre for Information, Discussion and Exchange on the Crossing of Frontiers and Immigration DG Directorate-General
EASO European Asylum Support Office EBF European Borders Fund
EC European Commission
EDF-ARA European Union Document-Fraud Annual Risk Analysis EDF-RAN European Union Document-Fraud Risk Analysis Network EES Entry-Exit System
EFCA European Fisheries Control Agency
EMCDDA European Monitoring Centre for Drugs and Drug Addiction EMN European Migration Network
EPN European Patrol Network EU European Union
EU-LISA European Agency for the operational management of large-scale IT systems in the area of freedom, security and justice
EUR euro
EURODAC European Dactyloscopy
EUROSUR European border surveillance system FRAN Frontex Risk Analysis Network fYROM former Yugoslav Republic of Macedonia IBM integrated border management
ICMPD International Centre for Migration Policy Development ILO International Labour Organization
IOM International Organization for Migration ISF Internal Security Fund
JO Joint Operation
JORA Frontex Joint Operations Reporting Application MFF Multi-annual Financial Framework
MS Member State
NCC National Coordination Centre NOK Norwegian krone
OCG organised crime group PNR Passenger Name Record
PVLMM Post Visa-Liberalisation Monitoring Mechanism
OCRIEST Office Central de Répression de l’Immigration Irrégulière et de l’Emploi d’Etrangers sans Titre RAU Frontex Risk Analysis Unit
RTP registered traveller programme SAC Schengen Associated Country SIS Schengen Information System THB trafficking in human beings UK United Kingdom
UKBA United Kingdom Border Agency
UNHCR United Nations High Commissioner for Refugees UNODC United Nations Office on Drugs and Crime USA United States of America
VIN vehicle identification number VIS Visa Information System
Detections of illegal border-crossing along the EU’s external borders dropped sharply in 2012 to about 73 000, i.e. half the num-ber reported in 2011. This was the first time since systematic data collection began in 2008 that annual detections have plunged under 100 000.
In the Central Mediterranean area, the large number of detections in 2011, which suddenly increased following the Arab Spring in Tunisia and Libya, had been significantly reduced by the end of 2011. However, throughout 2012, detections steadily increased and by the end of the year they totalled more than 10 300. Starting from 2008, considerable numbers of migrants had been detected crossing ille-gally the border between Turkey and Greece, along the so-called Eastern Mediterranean route. The situation changed dramatically in August 2012 when the Greek authorities mo-bilised unprecedented resources at their land border with Turkey, including the deployment of 1 800 additional Greek police officers. The number of detected illegal border-crossings rapidly dropped from about 2 000 in the first week of August to below 10 per week in Oc-tober 2012.
The enhanced controls along the Greek-Turk-ish land border led to a moderate increase in detections of illegal border-crossing in the Aegean Sea and at the land border between Bulgaria and Turkey, but simultaneous
mitiga-tion efforts in Turkey and Bulgaria have so far contained the displacements. There remains the risk of resurgence of irregular migration, since many migrants may be waiting for the conclusion of the Greek operations before they continue their journey towards Europe. Many migrants who cross the border ille-gally to Greece move on to other Member States, mostly through the land route across the Western Balkans. Contrary to the de-crease at the Greek-Turkish land border, there was no decrease in detections of illegal bor-der-crossing on the Western Balkan route (6 390, +37%).
In 2012, in the Western Mediterranean area between North Africa and Spain, detections of illegal border-crossing decreased by nearly a quarter compared to 2011 but remained above the levels recorded in previous years (6 400, -24%).
In 2012, Afghans remained the most detected nationality for illegal border-crossing at EU level, but their number considerably dropped compared to 2011. Syrians stand out, with large increases in detections of illegal border-crossing and for using fraudulent documents compared to 2011. Most of the detected Syr-ians applied for asylum in the EU, fleeing the civil war in their country.
There were large increases in refusals of en-try at the Polish land border with Belarus and
Executive summary
Ukraine. However, these increases were off-set by a decrease in refusals of entry issued at other border sections, resulting in a sta-ble total at EU level compared to 2011 (-3%, 115 000 refusals of entry).
Detections of illegal stayers, which totalled about 350 000 in the EU in 2012, have shown a stable but slightly declining long-term trend since 2008. Most migrants detected illegally staying in the EU were from Afghanistan and Morocco.
Despite a short-term increase of 10% between 2011 and 2012, the overall trend of detections of facilitators of irregular migration has been falling since 2008, totalling about 7 700 in 2012. This long-term decline may be in part due to a widespread shift towards the abuse of legal channels (such as overstaying, abuse of visa-free regime, etc.) and document fraud, which results in facilitators being able to op-erate remotely and inconspicuously. In 2012, there were around 8 000 detections of migrants using fraudulent documents to enter the EU or Schengen area illegally. Preliminary data on asylum applications in 2012 indicate an overall increase of about 7% compared to the previous year. While Afghans continue to account for the largest share of applications, much of the increase was due to an increasing number of applications sub-mitted by Syrian nationals.
The number of asylum applications submitted in the EU by Western Balkan citizens, mostly those from Serbia, remained unabated in 2012. Consequently, following the implementation of the visa facilitation agreement with five Western Balkan countries that started at the end of 2009, there are now discussions in the EU about the possible reintroduction of the visa regime.
In 2012, there was a steady trend of about 160 000 third-country nationals effectively returned to third countries. Greece reported the largest number of returns of a single na-tionality (Albanians), and effective returns in Greece increased markedly in the last quar-ter of 2012 following the launch of the Xenios Zeus operation.
Looking ahead, the assessment of risks along the EU’s external borders shows that despite a sharp reduction in detections between 2011 and 2012, the risks associated with illegal bor-der-crossing along the land and sea external borders remain among the highest, in par-ticular in the southern section of the bor-der of the EU.
The risk of illegal border-crossing along the land borders of the Eastern Mediterranean route, including the Greek and Bulgarian land border with Turkey, is assessed amongst the highest. This comes after several years of large numbers of migrants detected at the Greek land border with Turkey. Although the flow abruptly stopped in August 2012, there are re-ports of uncertainties related to the sustaina-bility of the efforts and growing evidence that migrants are waiting in Turkey for the end of the operation. Increases at the neighbouring sea border (Aegean Sea), at the land border between Bulgaria and Turkey and increases in detections of document fraud from Istan-bul airports, although so far relatively small, indicate that alternatives to the Greek land border are being explored by facilitators. Many of the migrants who crossed illegally through the Eastern Mediterranean route are expected to continue making secondary movements across the Western Balkans and within the EU.
The risk of illegal border-crossing across the Central Mediterranean area was also assessed amongst the highest due the continued vol-atile situation in countries of departure in
North Africa. Crisis situations are still likely to arise at the southern border with thousands of people trying to cross the border illegally in the span of several weeks or months. Past experiences also show that these crises take their toll on human lives, and are very diffi-cult to predict and quell without a coordi-nated response.
Most risks associated with document fraud were assessed as high. Indeed, document fraudsters not only undermine border se-curity but also the internal sese-curity of the EU. These risks are also common to nearly all Member States, as they are associated with passenger flows and border checks, which are a specific expertise of border-control authorities.
Fraud is expected mostly among EU travel documents (e.g. passports, visas and ID cards). False pretence or deception is used to ob-tain a wide range of documents. The most common technique is to use fraudulent doc-uments to obtain short-term visas.
Most risks associated with the abuse of legal channels are assessed as high as they are common and widely spread phenomena.
Based on currently available information, the risks associated with cross-border criminal-ity are assessed as moderate, including the risks of trafficking in human beings, terror-ism, smuggling of illicit drugs and exit of sto-len vehicles.
The ARA conclusions and identified risks at the EU’s external borders are meant to help effectively balance and prioritise the alloca-tion of resources.
Frontex operational activities aim to strengthen border security by ensuring the coordination of Member States’ actions in the implementation of Community measures relating to the management of the external borders. The coordination of operational ac-tivities also contributes to better allocation of Member States’ resources and protection of the area of freedom, security and justice. The ARA 2013 concentrates on the current scope of Frontex operational activities, which
ders. Hence, a full section is devoted to the phenomenon of trafficking in human beings (THB), the combating of which was tasked to Frontex pursuant to the EU action plan (2005/C 311/01) on best practices, standards and procedures for combating and prevent-ing THB.
The Frontex Risk Analysis Unit (RAU) would like to express its gratitude to all members of the Frontex Risk Analysis Network (FRAN) in Member States for their efforts in provid-ing data and information, as well as Europol, EASO and the European Commission, which have contributed to the ARA 2013, and all Frontex colleagues involved in the prepara-tion of this report.
2.1. Data exchange
A coherent and full analysis of the risks affect-ing security at the external borders requires, above all, the adoption of common tors. Consistent monitoring of these indica-tors will then allow effective measures to be taken on the ground. The analysis will need to identify the risks that arise at the exter-nal borders themselves and those that arise in third countries.
The backbone of the ARA 2013 is the monthly statistics exchanged between Member States within the framework of the Frontex Risk Analysis Network (FRAN). This regular data-exchange exercise was launched in September 2007 and then refined in 2008. Thanks to the FRAN members’ efforts, a much larger statis-tical coverage was achieved in 2011, focusing on seven key indicators of irregular migration: (1) detections of illegal border-crossing, (2) re-fusals of entry, (3) detections of illegal stay, (4) asylum applications, (5) detections of fa-cilitators, (6) detections of forged documents and (7) return decisions and effective returns. Following the closing of the CIREFI working group in April 2010, most of its mandate, in particular those concerning the exchange of data, were transferred to the FRAN. Most indicators monitored by CIREFI had already been part of the monthly data exchange among FRAN members and only the statis-tics on returns had to be added as the sev-enth indicator of the regular data exchange as of January 2011.
In 2011, the original FRAN indicator on forged documents was updated to enable the anal-ysis of complex modi operandi. Following a successful pilot study, the European Un-ion Document-Fraud Risk Analysis Net-work (EDF-RAN) was formed in early 2012 to oversee the exchange of a much more comprehensive and detailed indicator on doc-ument fraud, including the abuse of genuine documents.
Member States were not requested to an-swer specific questions in support of this analysis. Rather, bi-monthly analytical re-ports and incident rere-ports of Member States routinely collected within the FRAN and Member States’ contributions to several Tai-lored Risk Analyses produced in 2012 were both important sources of information, es-pecially as regards the analysis of routes and
modi operandi.
Open-source information was also effectively exploited, especially in identifying the main push and pull factors for irregular migration to the EU. Among others, these sources included reports issued by government agencies, in-ternational and non-governmental organisa-tions, as well as official EU reports, such as the European Commission’s reports on third countries, and mainstream news agencies. The data exchanged within the FRAN are compiled and analysed on a quarterly ba-sis. Priority is given to the use of the data for management purposes and to its fast sharing © adisa, fotolia.com
among Member State border-control author-ities. Member States’ data that are processed by Frontex are not treated as official statistics, and thus may occasionally vary from the data officially published by national authorities. Throughout 2012, some FRAN Members per-formed backdated updates of their 2011 statis-tics. These updates have been accounted for in this document and so some data presented here may differ from the data presented a year ago in the 2012 Annual Risk Analysis. External borders refer to the borders be-tween Member States and third countries. The borders between the Schengen Associ-ated Countries (Norway, Iceland and Switzer-land) and third countries are also considered as external borders. The borders between the Schengen Associated Countries and Schen-gen Member States are considered as inter-nal borders. For the indicators on detections of facilitators, illegal stay and asylum, statis-tics are also reported for detections at the land borders between the Schengen Mem-ber States and Schengen candidates (Bulgaria, Romania) or non-Schengen Member States (the UK, Ireland), so that a total for Member States and the Schengen Associated Coun-tries as a whole can be presented. It was not possible to make this distinction for air and sea borders because Member States do not habitually differentiate between extra-EU and intra-EU air and sea connections but tend to aggregate data for all arrivals per airport. In turn, Europol contributed to the ARA 2013 by providing information on facilitated irreg-ular migration. EASO also contributed to the section on asylum applications.
2.2. Quality of available data
Consistent with other law-enforcement in-dicators, variation in administrative data re-lated to border control depends on several factors. In this case, the number of detectionsof illegal border-crossing and refusals of en-try are both functions of the amount of ef-fort spent detecting migrants and the actual flow of irregular migrants to the EU. For ex-ample, increased detections of illegal border-crossing might be due to a real increase in the flow of irregular migrants, or may in fact be an outcome of more resources made availa-ble to detect migrants. In exceptional cases, increased resources may produce a rise in re-ported detections while effectively masking the actual decrease in the flow of migrants, resulting from a strong deterrent effect. Conservative estimates of the number of ir-regular migrants within the EU vary between three and six million, according to the results of Clandestino, an EU-sponsored project im-plemented by the ICMPD. Other estimates put the figure of irregular migrants at eight million, of which 80% are staying inside the Schengen area, half of them having originally entered it legally. However, there is currently no estimate of the annual flow of irregular migrants crossing the border illegally. Information on national-level resources for border-control authorities and their alloca-tion is currently only partially known. These data are provided by Member States them-selves either within the Schengen evaluation mechanism or within the External Borders Fund reporting. Without systematic and re-liable information on resources allocated to border control and without estimates of ir-regular migration flows, it is not possible to assess the performance and impact of the border controls put in place, and the analy-ses of the situation at the EU’s external bor-ders are limited to descriptive statistics of the administrative data provided by Mem-ber States.
As highlighted in the Schengen Catalogue, variation in regular passenger flow is an im-portant factor to be taken into account in the allocation of border-control resources.
How-ever, regular flows of passengers across the EU’s external borders are currently not re-corded systematically.
Data on the number of EU visas issued and their places of issue would improve the char-acterisation of third-country passenger flows. However, this information, which is collected within the Council Visa Working Party and published by the European Commission, is not yet available for 2012. For the purpose of the ARA, data from 2008 to 2011 are dis-cussed as an introduction to the general sit-uation at the borders.
2.3. Application of the Common
Integrated Risk Analysis Model
(CIRAM)
A key development in the CIRAM 2.0 up-date released in 2011 was the adoption of a management approach to risk analysis that defines risk as a function of the threat,
vul-nerability and impact. Such an approach en-deavours to reflect the spirit of the Schengen Borders Code and the Frontex Regulation, both of which emphasise risk analysis as a key tool in ensuring the optimal allocation of resources within constraints of budget, staff and efficiency of equipment.
According to the model, a ‘threat’ is a force or pressure acting upon the external borders that is characterised by both its magnitude and likelihood; ‘vulnerability’ is defined as the capacity of a system to mitigate the threat and ‘impact’ is determined as the potential consequences of the threat. In this way, the structured and systematic breakdown of risk presented as conclusion provides for an as-sessment of the relative overall risks posed by different threats as a function of the relevant vulnerabilities and impact, and therefore will be of much use to decision-makers in setting priorities, in formulating counter-measures and designating operational targets.
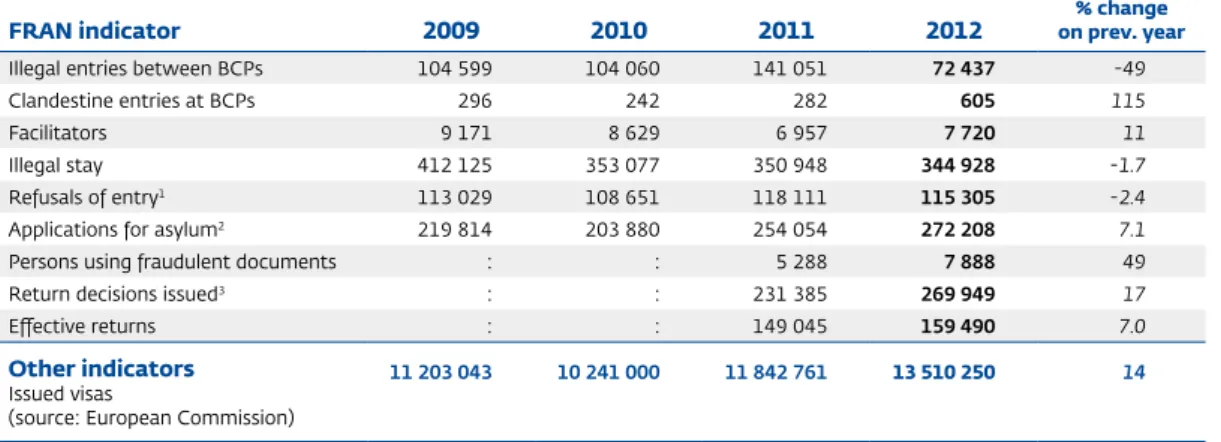
Table 1. Annual overview of situation at the border
FRAN indicator 2009 2010 2011 2012 on prev. year% change
Illegal entries between BCPs 104 599 104 060 141 051 72 437 -49
Clandestine entries at BCPs 296 242 282 605 115
Facilitators 9 171 8 629 6 957 7 720 11
Illegal stay 412 125 353 077 350 948 344 928 -1.7
Refusals of entry1 113 029 108 651 118 111 115 305 -2.4
Applications for asylum2 219 814 203 880 254 054 272 208 7.1
Persons using fraudulent documents : : 5 288 7 888 49
Return decisions issued3 : : 231 385 269 949 17
Effective returns : : 149 045 159 490 7.0
Other indicators
Issued visas
(source: European Commission)
11 203 043 10 241 000 11 842 761 13 510 250 14
Source: FRAN data as of 12 February 2013 1 EDF-RAN data as of 12 February 2013
2 For France, only asylum applications at the external borders are reported, not inland applications. For the Netherlands, inland asylum applications in Q3 and Q4 2012 are not available at this moment.
3.1. Passenger flow across the
EU’s external borders
Passenger flow is an indicator of the volume of checks that border guards have to perform, relative to the number of border guards. Cit-izens enjoying free movement are subject to minimum checks, while third-country nation-als, whether they require visas or not, are sub-ject to more thorough checks, as defined by the Schengen Borders Code. Hence, the na-ture and extent of passenger flow determine to a large extent the planning and allocation of resources for border checks.
Passenger flow data also prove useful in an-alysing indicators of irregular migration, in particular refusals of entry and detections of document fraud. Indeed, differences in the rates of refusal of entry over passenger flow may help identify best practice and eventu-ally ensure that checks are performed in a harmonised way across the BCPs of the EU. Similarly, detections of document fraud are most effectively analysed in connection with passenger flows and detection rates, rather than the number of detections, and provide the most useful tool for assessing border checks and flows of document fraudsters. At European level there is no systematic re-porting on passenger flows by BCP, border section or as a total for the EU’s external bor-der. Member States reported data on passen-ger flow in the framework of the European
Borders Fund (EBF), but this excludes the UK and Ireland, which do not participate in the EBF, and including crossings between non-Schengen and Schengen Member States (France-UK, Belgium-UK, Romania-Hungary). The total at the air border represents all pas-senger flows, including paspas-sengers from EU countries. The EBF total for sea border cross-ing probably also includes crosscross-ings between Member States. Given these uncertainties, it is difficult to estimate the EU total pas-senger flow from third countries that could usefully be analysed against the number of refusals of entry and detections of fraudu-lent documents.
Air borders
Eurostat provides data on air passenger flow (EU nationals and third-country nationals) coming only from third countries, which to-talled 125 million in 2011, including the UK and Ireland. At the air borders, estimates derived from Eurostat data released in January 2013, show a steady trend of + 1% in arrivals from third countries between 2010 and 2011, at a total of about 125 million arrivals from outside the EU in 2011. The UK, Germany and France ranked amongst the first, with more than 20 million arrivals from third countries. Italy and the Netherlands follow at a distance with less than 10 million arrivals from third countries. The largest numbers of arrivals are reported from the airport of London Heathrow with © fotolia.com
approximately 17 million passengers, followed by Paris-Charles De Gaulle airport (13 million) and Frankfurt airport (11 million). At Frank-furt airport, as at many airports in the EU, the top priority is now on reducing the time for check-in, security and passport control. Land borders
At the external land borders of the EU, al-though there is no systematic collection of passenger flow data at EU level, the busiest border section for entries of passengers is probably the border between Slovenia and Croatia, with approximately 23 million annual entries. The land border between Spain and Morocco is also a very busy border section, totalling more than 10 million annual entries (for both Ceuta and Melilla). The land border between Poland and Ukraine, with approxi-mately seven million passengers annually, also belongs to the busiest land border sections. Along the eastern land border, stretching for more than 4 000 km from Romania to Fin-land, one recurring pattern is the strong sea-sonality of regular passenger flows, with most of the crossings (entry/exit) taking place dur-ing the summer months. This requires an op-timal mobilisation of resources during this period to avoid undue waiting time for bona fide travellers.
Passenger flows are widely expected to in-crease at the land borders in the coming years, in particular along the main BCPs at the land borders with the Russian Federa-tion, Ukraine and Turkey. While all BCPs are equipped to meet the standards required by the Schengen Borders Code, differences in the nature of the flow of passengers and commercial traffic explains the differences in staffing levels between BCPs. A study* per-formed by the Center for the Study of De-mocracy, based on Member States answers for 2009, shows that there can be important differences in the characteristics of BCPs.
3.2. Visa
Visa policy acts as a form of pre-entry pro-cedure to ensure that third-country nation-als comply with entry requirements, which helps to prevent irregular migration. In this respect, particularly important in prevent-ing subsequent illegal stayprevent-ing is the role of consular offices in third countries deter-mining whether a third-country national should be granted a visa or not. Member States have introduced a variety of specific measures in their visa-issuing procedures to tackle irregular migration, which includes the assessment of willingness to return, the training of personnel at embassies and con-sulates, and cooperation and information exchange with other entities and Member States. Other preventive measures include the use of biometric data in the visa appli-cation process, as well as the identifiappli-cation of specific categories of migrants who might misuse their visa and awareness raising in third countries of the consequences of mak-ing fraudulent applications.**
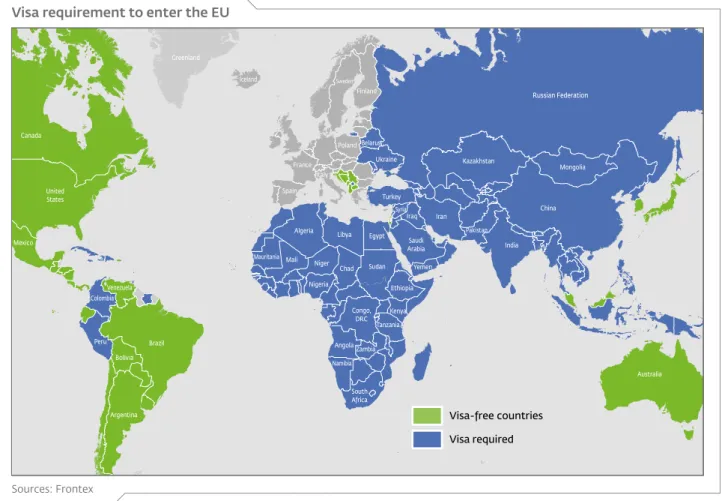
The Community Code on Visas, which en-tered into force in April 2010, sets out the common requirements for issuing transit and short-term visas to enter the terri-tory of Member States. There are cur-rently over 100 nationalities that require a visa to enter the EU, covering more than 80% of non-EU population of the world. Nevertheless, about one billion nation-als from approximately 40 third countries do not require an EU visa. These include Australia, Canada, Croatia, Japan, New Zealand and the USA. The list of coun-tries whose nationals require a visa to travel to the UK or Ireland differs slightly from other EU countries. As indicated in the Visa Code, statistical data are an im-portant means of monitoring migratory movements and can serve as an efficient management tool.
* Center for the Study of Democracy, Better Management of EU borders through Cooperation, 2011
** European Migration Network Inform, Visa policy as Migration Channels, December 2012
Recent changes to Schengen regulations have seen a simplification of the visa re-gime. Schengen Member States now issue only three types of visa: (1) airport tran-sit visa (A) – valid only for airport trantran-sit, does not entitle the holder to leave the transit zone of the airport; (2) short-stay visa (C); (3) national long-stay visas (D) and residence permits. Generally, a short-stay visa issued by one of the Schengen States (visa C) entitles its holder to travel
throughout the 26 Schengen States for up to three months within a six-month pe-riod. Visas for visits exceeding that period remain subject to national procedures. The data include visas issued by the Schen-gen Associated Countries (Iceland, Nor-way, Switzerland), as well as by Romania and Bulgaria, which have not yet joined the Schengen area, and exclude visa data in the UK and Ireland, which are not part of the Schengen area.
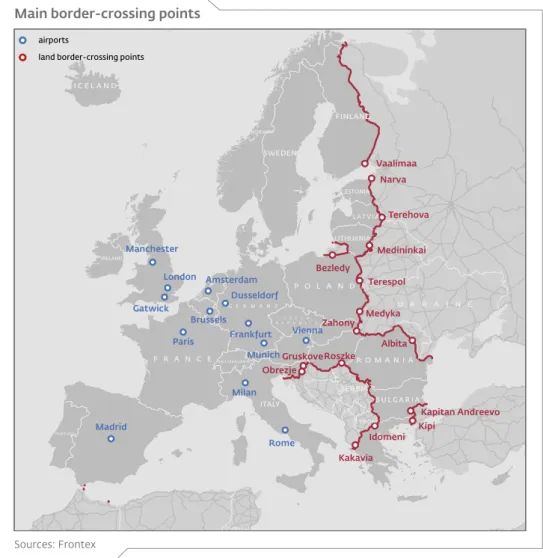
Manchester London Gatwick Madrid Rome Milan Vienna Amsterdam Dusseldorf Frankfurt Munich Brussels Paris Vaalimaa Narva Terehova Medininkai Bezledy Terespol Medyka Zahony Albita Kapitan Andreevo Kakavia Roszke Gruskove Obrezje Kipi Idomeni I C E L A N D IRELAND PORTUGAL NORWAY SWEDEN TU N I S IA ITALY FYR OM B U L G A R I A C Z E C H R E P U B L I C P O L A N D F R A N C E G E R M A N Y SW ITZER LA N D ESTONIA FINLAND L A T V I A LITHUANIA R O M A N I A U K R A I N E SERBIA airports
land border-crossing points
Main border-crossing points
Sources: Frontex
Figure 1. There is no systematic reporting of passenger flow across the EU’s external borders, but partial information provided by Member States shows the possible border-crossing points (BCPs) with the largest flows of passengers through the external borders
Data for 2012 are not yet available, but the European Commission, through its DG Home Affairs has released the data for 2011. VIS data are collected on the basis of the place where the application is made, and not on the citizenship of the visa applicant. Thus, for instance, applications made in the Russian Federation do not necessarily concern only Russian nationals. However, in the following overview, the country where the visas were delivered was used as the most suitable ap-proximation of the visas issued to citizens of that country. Visas broken down by national-ities are available at the national level, where they can be used for operational purposes.
In 2011 more than 13.8 million visas (all types) were issued by Schengen and non-Schengen Member States (including Bul-garia and Romania, but excluding the UK and Ireland). The vast majority of visas is-sued were category C, or short-stay visas, accounting for 98% of all visas issued, fol-lowed by long-stay visas (2%) and airport transit (A) visas (0.1%).
The annual increase of 4% between 2010 and 2011 increased the number of visas to a level similar to that of 2007, i.e. before the eco-nomic crisis hit the EU and significantly re-duced the number of visitors.
Venezuela Argentina Bolivia Brazil Peru Canada Mexico Colombia Greenland Iceland Spain Mali Mauritania Ethiopia Mongolia Iraq Kazakhstan Russian Federation Sweden Algeria Libya Chad Niger Nigeria Italy Egypt Syria Turkey Poland France United States Belarus Finland Ukraine India Yemen Iran Saudi Arabia Pakistan China Kenya Tanzania Zambia South Africa Angola Congo, DRC Namibia Australia Sudan Visa required Visa-free countries Sources: Frontex
Visa requirement to enter the EU
Consistent with every year since 2007, in 2011 the Russian Federation was where most short-term visas were issued (5 556 941) rep-resenting a 24% increase compared to the previous year. Visas issued in the top three countries account for 58% of all short-stay visas issued in 2011. Figure 3 illustrates the number of visas issued in 2010 and 2011 for the top five third countries in 2011 (circle size) and the degree of change (slopes) be-tween the years.
This significant increase in the number of vi-sas issued in the Russian Federation is simi-lar to the increase of 28% observed between 2009 and 2010. In total, short-term visas is-sued in the Russian Federation accounted for 41% of all category C visas issued by Member States in 2011. Ukraine followed with 1 270 157 visas issued in 2011 marking an increase of 20% compared to 2010. As in 2010, China, ranked third with 1 031 866, saw the most significant increase in the number of visas issued from 2010 to 2011, i.e. by 31% and so it is shown at the top of Figure 3.
Most short-term visas were issued by France (1 938 556 visas issued, or 14% of all short-term visas issued), followed by a group of four Member States (Germany, Italy, Spain and Finland) that all issued more than 1 million vi-sas. Together, these five Member States ac-counted for 56% of all issued short-stay visas. Table 3 (overleaf) shows the numbers of vi-sas issued by the top ten Member States in
specific third countries. This table clearly il-lustrates the large increase in the number of visas issued in the Russian Federation by sev-eral Member States. Spain reported the largest increase (+52%), and in most Member States, the number of visas delivered in the Russian Federation represented a double digit increase.
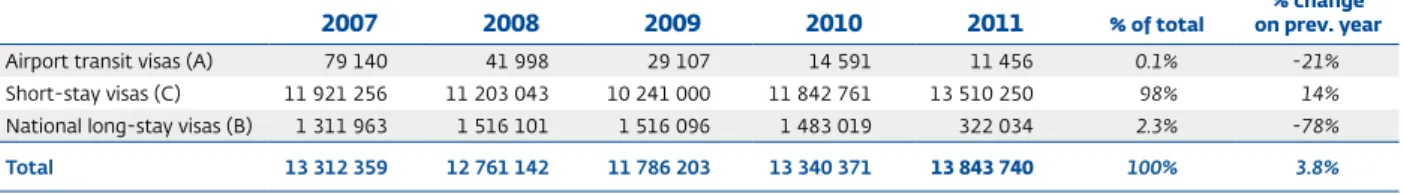
Table 2. The vast majority of visas issued are short-stay visas, accounting for more than 90% of all visas issued
2007 2008 2009 2010 2011 % of total on prev. year% change
Airport transit visas (A) 79 140 41 998 29 107 14 591 11 456 0.1% -21%
Short-stay visas (C) 11 921 256 11 203 043 10 241 000 11 842 761 13 510 250 98% 14%
National long-stay visas (B) 1 311 963 1 516 101 1 516 096 1 483 019 322 034 2.3% -78%
Total 13 312 359 12 761 142 11 786 203 13 340 371 13 843 740 100% 3.8%
Source: European Commission
2010 2011 China Belarus Russian Fed. Ukraine Turkey
Figure 3. About 50% of all visas were issued in the Russian Federation, Ukraine and China. Visas issued in the Russian Federation, China and Belarus showed significant increases
Overstaying the legal visa period
There are no data available on the rate of people who arrive on short-term visas but do no depart before their visa expires (over-staying). However, experiences from coun-tries implementing entry-exit systems, like Australia or Thailand, showed that such in-dicator can be useful for decision-makers when assessing visa applications. Indeed, it is generally believed that overstaying is a very common modus operandi for irregu-lar migration to the EU.
Visa refusals
The consulate competent for dealing with visa applications assesses:
1. whether the applicant fulfils the entry conditions;
2. the risk of irregular immigration; 3. the applicant’s intention to leave the
ter-ritory of the Member State before the ex-piry of the visa;
4. whether the applicant presents a risk to the security or public health of the Mem-ber State.
As a result, some visa applications are re-fused. There are no data on the reasons for refusals of visa applications, but the overall refusal rate for visa applications may be de-termined per third country where visas are issued. Combined with additional informa-tion and tailored to operainforma-tional needs, the rate of refusals of visa in consulates may be used by border-control authorities to deter-Table 3. The number of visas issued in the Russian Federation increased significantly for many Member States between 2010 and 2011
Member State Third country 2010 2011 % share of total Finland Russian Federation 952 056 1 182 876 8.8%
Spain Russian Federation 461 367 699 815 5.2%
Italy Russian Federation 456 209 579 492 4.3%
Greece Russian Federation 374 558 513 223 3.8%
Bulgaria Russian Federation 315 948 393 816 2.9%
Germany Russian Federation 350 002 375 103 2.8%
Poland Ukraine 302 266 369 893 2.7%
France Russian Federation 295 421 339 253 2.5%
Czech Republic Russian Federation 267 266 339 083 2.5%
Poland Belarus 148 891 244 037 1.8%
France China 198 898 237 679 1.8%
Italy China 151 547 230 166 1.7%
Poland Russian Federation 155 846 210 926 1.6%
Germany China 184 374 208 287 1.5%
Bulgaria Ukraine 102 505 157 162 1.2%
France Algeria 125 934 154 180 1.1%
France Morocco 136 575 147 884 1.1%
Lithuania Russian Federation 120 464 147 760 1.1%
Lithuania Belarus 106 451 144 328 1.1%
Germany Turkey 124 130 141 114 1.0%
Other Other 6 512 053 6 694 173 50%
Total 11 842 761 13 510 250 100%
mine the countries of origin presenting the highest risk of irregular migration.
In 2011, about 6% of the 14 373 334 visa appli-cations were rejected. This proportion rose to 32% for applications made in West Africa, and to 20% in the Caribbean. Visa refusal rates varied widely between Member States, from 17% of 242 857 applications in Belgium to 1% of 1 259 643 applications in Finland.
UK visas
In 2011 for the UK alone, data on entry clear-ance visas and admissions of those who are subject to immigration control coming to the UK for study, work and family reasons show that: student immigration has seen a general increase since 2005, rising particularly rap-idly in 2009; work-related immigration has fallen overall since 2006; and family immigra-tion has shown a slow overall decrease since 2006. The latest visa data for 2011 indicate the number of student visas has fallen since a peak in the year ending June 2010 and work visas have continued to fall after a slight in-crease in the year ending March 2011. Visas for family reasons also fell.
Excluding visitor and transit visas, 6% fewer visas were issued in 2011 (564 000) than in 2010 (597 000). However, there were a re-cord 1.7 million visitor visas issued in 2011, 11% more than a year earlier (1.5 million).* In total, the UK issued 2 272 891 visas, with a refusal rate of 12%. The UK Border Agency (UKBA) published extensive statistics on vi-sas issued, including breakdown by nation-alities, but also by categories of visa (work, student, family, other) and categories of spon-sors, broken down by nationalities and places of delivery.
Resident permits
An EMN note released in September 2012** showed that more than 1.93 million first resi-dence permits were issued in 2011, an increase of 15% compared to 2010. This total excludes Belgium, Cyprus and Poland, which amounted to some 188 400 residence permits in 2010. Most residence permits were issued by Italy (331 000) and France (193 400).
At EU level, the Single Permit Directive was adopted in December 2011. The new legis-lation provides for a single application pro-cedure for a single permit for third-country nationals to reside and work on the territory of a Member State. Negotiations continued on the proposals for directives on the condi-tions of entry and residence of third-country nationals for the purpose of seasonal em-ployment and on conditions of entry and residence of third-country nationals in the framework of an intra-corporate transfer. Infringement procedures for non-communi-cation of national measures transposing the EU Blue Card Directive*** were launched in 2011 in respect of six Member States. In 2012, a second set of infringement procedures were launched in respect of five Member States.
3.3. Illegal border-crossing
Detections of illegal border-crossing along the EU’s external borders sharply dropped in 2012 to 72 437 detections, a 49% decrease compared to 2011 due mainly to the com-bined effects of enhanced surveillance at the land border between Greece and Turkey, where detections decreased by 44%, and to a sharp drop in the Central Mediterranean, where detections fell from 59 000 in 2011, mostly in connection to the Arab Spring, to 10 379 in 2012 (-82%).In the first half of 2012, detections in the Cen-tral Mediterranean area were much reduced
* UK Home Office,
Immigration Statistics, Summary of key facts, 2011 *** Blue Card is an EU-wide work permit allowing high-skilled non-EU citizens to reside and work in the EU. ** European Migration Network Inform,
Developments in Legal Migration and Mobility in 2011, 2012
compared to the peak period of February– September 2011 that registered most of the departures connected to people leaving Tuni-sia and Libya. Most detections of illegal bor-der-crossing along the external borders were on the South-Eastern border of the EU. The situation changed drastically in August 2012 when the Greek authorities mobilised unprec-edented resources at their land border with Turkey, including the deployment of 1 800 ad-ditional Greek Police Officers. Detections of illegal border-crossing rapidly dropped from about 2 000 in the first week of August to less than 10 per week in October 2012. Looking at nationalities, despite an over 43% reduction compared to 2011, at 13 169 detec-tions, Afghans still accounted for 18% of all de-tections of illegal border-crossing at EU level. The majority of these Afghan migrants was detected at the land border between Greece and Turkey, where detections fell after August 2012. Afghans continued to be detected mak-ing secondary movement across the Hungar-ian land border with Serbia.
In 2012, the nationality with the most dra-matic change in the number of detections
were Syrians, both in terms of relative growth and absolute number, from 1 616 in 2011 to 7 903 in 2012 (+389%). A large majority of all detected Syrian migrants were reported from the Greek land border with Turkey. Migrants from Eritrea (5 038 detections in 2012, +67%) and Somalia (2 604, +66%) were increasingly detected in the Central Mediterranean route. 3.3.1. Routes
In the annual total for 2012, detections of ille-gal border-crossing on the Eastern Mediter-ranean route still accounted for the largest percentage of all detections (37 214, 51% of 2012 total). Many migrants who crossed the border illegally to Greece continue to other Member States, either through the land route across the Western Balkans, or through ferry links to Italy or by air to other Schengen Member States.
Throughout 2012, detections in the Central Mediterranean region steadily increased to reach an annual total of 10 379 (14% of the to-tal). Most migrants were from sub-Saharan countries and departed from Libya.
In the Western Mediterranean area, at the land and sea borders between northern Africa and Spain, detections of illegal border-cross-ing totalled 6 397, representborder-cross-ing a 24% decrease compared to 2011. This level is comparable to the detections reported in 2008 and 2010. Most migrants were Algerians or sub-Saha-rans departing from Morocco and Algeria. In March 2012, Belarusian authorities ap-peared to relax their border surveillance, resulting in increased detections of illegal border-crossing in Lithuania and Poland. Compared to 2011, detections increased by 52% along the eastern land border, totalling nearly 1 600. However, as was the case in previous years, this total represented only a small fraction of all detections in the EU (2%).
2012 2011 0 5 000 10 000 15 000 20 000 25 000 30 000 35 000
Syria Somalia Eritrea Tunisia Pakistan Afghanistan
Top Increase Top Decrease
Figure 4. At EU level, while Afghans continued to rank first, Syrians were the fastest growing nationality detected for illegal border-crossing between 2011 and 2012
Table 4. Detections of illegal border-crossing between BCPs
Routes 2010 2011 2012 Share of total % change on prev. year
Eastern Mediterranean route (Greece, Bulgaria and Cyprus) 55 688 57 025 37 224 51 -35
Land 49 513 55 558 32 854 -41 Afghanistan 21 389 19 308 7 973 -59 Syria 495 1 216 6 216 411 Bangladesh 1 496 3 541 4 598 30 Sea 6 175 1 467 4 370 198 Afghanistan 1 373 310 1 593 414 Syria 139 76 906 1 092 Palestine 1 500 128 408 219
Central Mediterranean route (Italy and Malta) 1 662 59 002 10 379 14 -82
Somalia 82 1 400 3 394 142
Tunisia 650 27 964 2 244 -92
Eritrea 55 641 1 889 195
Western Mediterranean route 5 003 8 448 6 397 8.8 -24
Sea 3 436 5 103 3 558 -30 Algeria 1 242 1 037 1 048 1.1 Morocco 300 775 364 -53 Chad 46 230 262 14 Land 1 567 3 345 2 839 -15 Not specified 1 108 2 610 1 410 -46 Algeria 459 735 967 32 Morocco 0 0 144 n.a.
Western Balkan route 2 371 4 658 6 391 8.8 37
Afghanistan 469 983 1 665 69
Kosovo* 372 498 942 89
Pakistan 39 604 861 43
Circular route from Albania to Greece 35 297 5 269 5 502 7.6 4.4
Albania 32 451 5 022 5 398 7.5
fYROM 49 23 36 57
Kosovo* 21 37 34 -8.1
Apulia and Calabria (Italy) 2 788 5 259 4 772 6.6 -9.3
Afghanistan 1 664 2 274 1 705 -25
Pakistan 53 992 1 156 17
Bangladesh 12 209 497 138
Eastern borders route 1 052 1 049 1 597 2.2 52
Georgia 144 209 328 57
Somalia 48 120 263 119
Afghanistan 132 105 200 90
Western African route 196 340 174 0.2 -49
Morocco 179 321 104 -68
Gambia 1 2 39 1 850
Senegal 2 4 15 275
Other 3 1 1 0 0
Iran 0 0 1 n.a.
Russian Federation 2 0 0 n.a.
Somalia 0 1 0 -100
Total 104 060 141 051 72 437 - 49
* This designation is without prejudice to positions on status, and is in line with UNSCR 1244 and the ICJ Opinion on the Kosovo declaration of independence. Source: FRAN data as of 12 February 2013
n Eastern Mediterranean route
Since data collection began in early 2008, the Eastern Mediterranean has maintained its status as a hotspot of irregular migration. Detections have followed a remarkably sea-sonal pattern invariably peaking in the third quarter of each year and concentrated at the border between Greece and Turkey. How-ever, following the implementation of a set of Greek operations in August 2012 as well as the continued implementation of
Fron-tex-coordinated JOs (Aeneas, Hermes and Poseidon Sea), by the end of the year, detec-tions dropped off to almost negligible levels. The operation Xenios Zeus focuses on inland detections of illegal stay in Greece and their subsequent return, while the operation As-pida enhances the surveillance on the Greek-Turkish land border.
The operational activities included:
(a) deployment of a 1 881 additional Police Officers to the Evros region and
tech-1 597 +52% 37 224 37 224 37 224 37 224
----35%
35%
35%
35%
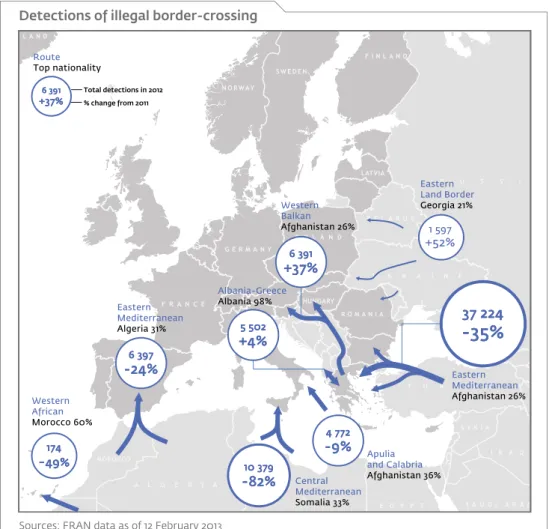
174 174 174 174 ----49%49%49%49% 6 397 6 397 6 397 6 397 ----24%24%24%24% 10 379 10 379 10 379 10 379 ----82%82%82%82% 4444 772772772772 ----9%9%9%9% 6 391 6 391 6 391 6 391 +37% +37%+37% +37% 5 502 5 502 5 502 5 502 +4% +4%+4% +4% Eastern Land Border Georgia 21% Eastern Mediterranean Afghanistan 26% Apulia and Calabria Afghanistan 36% Central Mediterranean Somalia 33% Western African Morocco 60% Eastern Mediterranean Algeria 31% Albania-Greece Albania 98% Western Balkan Afghanistan 26% Route Top nationality 6 391 6 391 6 391 6 391 +37% +37% +37%+37% Total detections in 2012% change from 2011
Detections of illegal border-crossing
Sources: FRAN data as of 12 February 2013
Figure 5. Detections of illegal border-crossing along the EU’s external borders plunged in 2012 mainly due to enhanced surveillance at the Greek-Turkish land border and a sharp drop in the Central Mediterranean
nical assets at the Greek-Turkish land border aimed at increasing surveillance and response capacity to tackle illegal border-crossing;
(b) creation of significant additional capacity for hosting irregular migrants in deten-tion centres in order to be able to facili-tate identification and return;
(c) use of new tactics for border surveillance and improved cooperation with the Turk-ish authorities at the border;
(d) reduction in the time period for which ir-regular migrants have to leave Greece if not held in detention centres from 30 to 7 days; and
(e) inland activities for the detection of irreg-ular migrants on Greek territory.
As a result, from 6 August 2012 onwards the number of apprehensions significantly dropped at the Greek-Turkish land border. The operations produced a slight shift to the Bulgarian land border and the sea bor-der with Turkey. Italy reported a few detec-tions of migrants attempting to cross directly from Turkey, and at EU level, Member States also reported a small increase in detections
of migrants with fraudulent documents on flights departing from Istanbul. However, these increases in detections on alternative route to the land border between Turkey and Greece, do not match previous levels, as seen in Figure 6.
The operations were initially planned for a three month period, but were then renewed in October 2012 for another three month pe-riod. In January 2013, the Greek authorities announced the 3rd phase of the operation Aspida, which will run until 3 April 2013 with 1 100 police officers deployed in Evros region. Partial shift to sea borders
Detections in the Aegean Sea, between Turkey and Greece, increased by 912%. This increasing trend started after September 2012, as migrants considered sea crossing as an alternative to the land route to Greece. It is indeed at the sea borders where the most significant shift in detections of ille-gal border-crossing was reported. The in-crease started immediately following the enhanced surveillance at the land border. 0 1 000 2 000 3 000 4 000 5 000 6 000 7 000 8 000
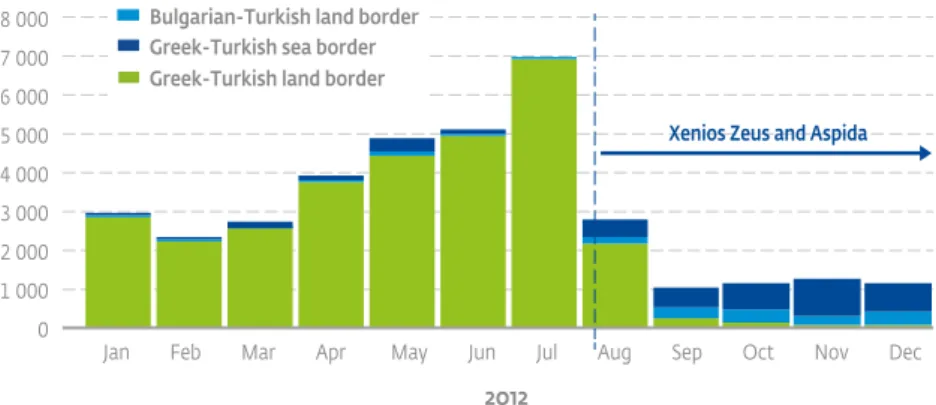
Jan Feb Mar Apr May Jun Jul Aug Sep Oct Nov Dec Xenios Zeus and Aspida
2012
Bulgarian-Turkish land border Greek-Turkish sea border Greek-Turkish land border
Figure 6. Enhanced border controls at the land border between Greece and Turkey
significantly reduced detections of illegal border-crossing up to December 2012, resulting in only small displacements to alternative routes
Worryingly, detections were still relatively large at the end of year, despite the winter conditions that makes sea crossing more treacherous. This may signal a resurgence of the pressure in the Aegean Sea after three years of relatively low detections. Indeed, in 2009, the Aegean Sea was the main area for detections of illegal border-crossing into the EU.
Migrants detected in the Aegean Sea were mainly apprehended inland after their arrival from the western coast of Turkey, while a small number of migrants were apprehended directly at sea trying to reach the Greek Ae-gean Islands. The most targeted islands were Lesbos, Samos, Agathonisi, Farmakonisi and Symi. Most migrants had departed from Izmir on the Western Turkish coast.
The Turkish authorities have also stepped up their surveillance efforts, with the Turkish Coast Guards intercepting migrants in rub-ber boats and vessels before they reach the Greek territorial waters.
In the Ionian Sea, there was no signifi-cant increase after August 2012. Most of the migrants detected in the Ionian Sea had departed from Greece, after having crossed the border illegally between Tur-key and Greece.
Partial shift to the land border between Bulgaria and Turkey
Since systematic data collection began in early 2008, detections of illegal border-cross-ing at the Bulgarian-Turkish land border were rather low. The situation changed in 2012, when a total of around four times as many migrants were apprehended. This increase is connected to the strengthening of bor-der control at the Greek-Turkish land borbor-der, where most migrants used to cross illegally into the EU, in August 2012.
The main nationalities apprehended in Bul-garia during 2012 were Syrians, Palestinians, Iraqis, Algerians and Malians. Up until Au-gust there were very few sub-Saharan mi-grants detected at the Bulgarian-Turkish land border; however, from the beginning of the Greek operation Aspida until end of Decem-ber 2012, their numDecem-ber rose to represent 16% of all detections. Most sub-Saharan migrants had arrived legally in Turkey by air (most of them either do not need visa or can easily obtain it on arrival in Turkey).
Following this increase, the Bulgarian au-thorities quickly reacted in October 2012 by setting-up a Specialised Police Operation at the Bulgarian-Turkish land border in the ar-eas of the Border Police Units of Svilengrad and Elhovo, deploying additional officers, pa-trol cars and service dogs along the Bulgar-ian-Turkish border. Measures have also been taken to enhance air surveillance.
These actions complement the efforts of the Bulgarian authorities to implement an In-tegrated Border Surveillance System at the border section between the BCP Kapitan An-dreevo and Lesovo. The system covers 58 km of the most affected section of the Bulgar-ian-Turkish land border. The Bulgarian au-thorities are planning to extend the system to cover the entire border section.
Staying in Turkey
Given the rather limited shift in detections of migrants crossing illegally from Turkey, it is also likely that a substantial proportion of migrants failing or not trying to enter the EU prefer to stay in Turkey, rather than return-ing to their more unstable and substantially poorer home countries. Although lacking res-idency status, and, therefore, vulnerable to exploitation, they may find jobs in specific niches in the Turkish informal sector, tour-ism, petty trade, construction and agriculture.
Nationalities on the Eastern Mediterranean route
There was some variation in the extent to which detections of different nationalities decreased in response to the operations. However, the deterring effect was the least pronounced in the case of Syrians as the de-tections of this nationality were the last to decrease and the scale of their decline was the smallest. In the second half of 2012, Syr-ians were by far the most detected nation-ality in this area.
Although not reflected in the analysis of the top nationalities, the number of Algerians detected crossing illegally the border on the Eastern Mediterranean route in 2012 (2 223 detections) was larger than the number of Algerians detected on the Western Mediter-ranean route (2 015 detections), which is their traditional route with direct departure from the Algerian coast. This shift is explained by cheap flight connections from Algeria to Tur-key and the easiness to obtain Turkish visa. Afghan migrants
Some reports state that in Iran there are cur-rently 2–4 million displaced Afghans who have been residing there for several years. How-ever, an agreement of the Iranian govern-ment to provide Afghans with docugovern-ments to legalise their stay and provide permission to work has recently expired, rendering many Afghan nationals as illegal stayers in Iran. Hence, many now-irregular migrants in this situation are coming to the EU.
Pakistani migrants
Most migrants coming to the EU from Pa-kistan via the Greek-Turkish border, are sin-gle, male adults between the ages of 21 and 29, non-skilled Urdu-speaking workers and students. When illegally crossing the exter-nal border they tend to travel undocumented.
The passports are often withheld by facilita-tors in Turkey with the assurance that they will be sent to other facilitators in Greece. The most frequent place of origin is the north-ern part of the Punjab province. According to the statements provided in interviews, the destination countries are Greece, Italy and Spain, but considering the number of returned Pakistani nationals, the UK could be the main final destination country. The main Member States reporting the effective return of Paki-stanis were the UK and Greece.
The main reason why Pakistanis choose to migrate to the EU is economic, because of a lack of employment opportunities and very low salaries in Pakistan.
Bangladeshi migrants
Most of the Bangladeshi migrants interviewed after having illegally crossed the Greek-Turk-ish land border claimed that they had de-parted from countries around the Persian
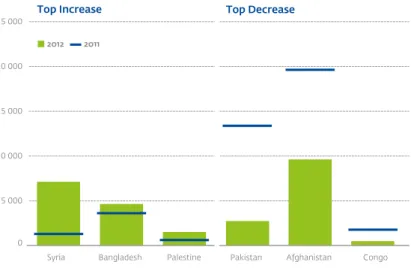
2012 2011
Top Increase Top Decrease
0 5 000 10 000 15 000 20 000 25 000
Syria Bangladesh Palestine Pakistan Afghanistan Congo
Figure 7. Following enhanced control at the Greek-Turkish land border, Syrians were the last to decrease. Compared to 2011,
detections of Syrians actually increased the most, while detections of Afghans and Pakistanis significantly dropped in 2012
Gulf, where they had been legally working in the construction business. Following the eco-nomic crisis in the area, salaries fell and fewer jobs were available; consequently, many mi-grants decided to try to reach the EU in search of better employment opportunities. It was established that facilitators working in the Gulf area deceptively assured the migrants that there were plenty of good jobs and high salaries in Greece.
The Bangladeshi migrants travelled by car to Oman, from where they crossed the Gulf of Oman to Iran in fast speedboats. From Bandar-E-Abbas they travelled on buses and in vans to Teheran, where they joined the flow of mostly Afghan and Pakistani migrants arriving from the east. From Te-heran, the migrants were transported to
Urmia and then crossed the Iranian-Turk-ish border in large groups of up to 1 000 migrants, and headed towards Van. In Van, migrants received false Turkish documents and used a regular bus connection to get to Istanbul. From there, facilitators trans-ported them to the River Evros, or alter-native routes.
Syrian migrants
While the increasing number of detections of illegal border-crossing is generally linked to the internal situation in Syria, the prevail-ing profile of Syrians detected at the Greek-Turkish border remains somewhat different to the refugee flow from Syria into Turkey. Also, roughly 15% of Syrians detected at the Greek-Turkish border during 2012 were in fact not native to Syria. These false claims of na-tionality often occur in conjunction with new or emerging crises and are linked to nation-alities with common linguistic and/or geo-graphical origin. In this case, migrants falsely claiming Syrian nationality were mostly Iraqis and, to a lesser extent, also Egyptians, Mo-roccans, Libyans and Tunisians.
Syrians detected crossing the border illegally in Greece were predominantly male (74%), while the UNHCR data for the refugee flow into the neighbouring countries suggest that 75% were women and children. While there were also family units detected, the major-ity of Syrians arriving in Greece were youths aged between 20 and 28.
The main areas of departure from Syria were the north-west around the city of Aleppo, the north-east around the city of Al Qamishli and the capital Damascus. Migrants tended to use cars and buses for legal entry to Turkey. With the help of Syrian facilitators some also enter Turkey illegally on foot, although this is an exception. Importantly, while on route to Greece, Syrians do not usually seek inter-national protection in Turkey.
Oman United Arab Emirates
Bandar-E-Abbas Teheran Van Istanbul Orestiada T U R K E Y I R A N
Sources: Poseidon Land weekly reports
Figure 8. Most migrants from Bangladesh detected during JO Poseidon Land travelled overland from the Gulf States
Some Syrians departing from Damascus tended to travel legally to Beirut, fly to Is-tanbul and from there continue their jour-ney to Greece with the help of the facilitators. While staying in Istanbul, Syrians made con-tact with facilitators.
A German court ruled early in 2012 that Syr-ian nationals applying for international pro-tection are to be granted automatic refugee status on the grounds that the very act of leaving Syria presumably illegally, and then asking for international protection may, upon return to Syria, result in torture and impris-onment. Sweden also declared that Syrian nationals claiming for asylum would also be automatically granted protection, while other Member States are reviewing their policies.
Secondary movements
Greece is a Schengen exclave and a tran-sit rather than destination country for the majority of migrants. Thus, the secondary movements originating in Greece are char-acterised by a similar composition of nation-alities of migrants attempting to re-enter the Schengen area heading for their final desti-nations as those who enter Greece. In 2012, these movements tended to be reflected in the detections of:
1) illegal border-crossing throughout the Western Balkan land borders;
2) migrants landing at the blue border of the southern Italian regions of Apulia and Calabria;
3) clandestines and document fraudsters on board ferries to Italy (Ancona, Venice); 4) document fraudsters travelling on flights
from Greek airports to many major EU airports.
Illegal border-crossing throughout the Western Balkan land borders: There were almost 35 000 detections of illegal border-crossing between BCPs reported at borders
between Western Balkan countries them-selves or at their borders with the neigh-bouring Member States. The number was one third higher compared to 2011. Among the top five border sections, Croatia-Slove-nia reported the highest increases (+95%) between 2011 and 2012. Afghans continued to dominate the nationalities ranking with a 23% share of the total. Their numbers rose by almost 10% to 8 065, however, the high-est relative increases between 2011 and 2012 were reported by Syrians (+1 689%), Somalis (+223%) and Algerians.
Worth mentioning is also the fact that many more migrants opted for clandestine entry (hiding in lorries or trains) during 2012 com-pared to 2011. In fact, Western Balkan coun-tries and the neighbouring Member States detected almost 1 676 or 87% more persons hiding in vehicles while trying to cross bor-ders illegally. The top border section was Ser-bia-former Yugoslav Republic of Macedonia, where authorities on both sides of the bor-der detected 25% more than during 2011. As in the case for green border crossings, Af-ghans were the top nationality with a 45% share of the total.
Migrants landing at the blue border of the southern Italian regions of Apulia and Calabria: In 2012, there was a steady flow of Afghans and, to a lesser extent, Pakistanis ar-riving in the southern Italian blue borders of Calabria and Apulia with some very large in-creases during the third quarter of 2012. The most commonly detected migrants were from Afghanistan, representing a steady share of about 30%. Detections of migrants from Pakistan, Bangladesh and Syria increased very sharply since the beginning of 2012.
Many migrants indicated that they had ini-tially entered the Schengen area by crossing the land border between Greece and Turkey. In 2011, it was estimated that more than 15% of migrants reported at the Greek–Turkish
land border were afterwards detected in Apulia and Calabria.
Increasing numbers of other migrants, usu-ally from Asia, claim to have been living in Greece for a number of years before decid-ing to leave for other Member States be-cause of the economic crisis. Some of the migrants stated that they had been work-ing in agriculture jobs for EUR 25–30 per day, but many did not receive any salary for a certain period which prompted their de-cision to leave.
Document fraudsters travelling on flights from Greek airports to many major EU air-ports: In 2012, there were more than 500 detections of migrants travelling on intra-Schengen flights with fraudulent documents. These intra-Schengen document fraudsters were mostly detected by Italy (entry and exit) and Greece (exit), where numbers were increasing throughout 2012 and, to a lesser extent, by Germany (entry), where numbers were decreasing.
Following recent increases, Syrians were the most detected nationality on intra-Schengen flights followed by Afghans and Somalis.
n Central Mediterranean route
In the Central Mediterranean area, the large and suddenly increased number of detec-tions in 2011, following the turmoil in Tunisia and Libya, had been significantly reduced by the end of 2011. However, throughout 2012, detections steadily increased and by the end of the year they totalled more than 10 000 detections. Most migrants were from sub-Saharan countries (particularly Eritrea and Somalia) and departed from Libya.
The institutional capacity to tackle irregular migration in North Africa remains limited. Libya is of the biggest concern in this respect given its fractured, with four regions declared military zones, non-consolidated and difficult-to-govern emerging institutional framework. The country is still plagued with frequent kill-ings and kidnappkill-ings.
In the Central Mediterranean area, mi-grants illegally crossing the borders to the EU used a wide variety of boats, ranging from small rubber dinghies up to medium-size wooden fishing boats. Fishing boats departing from Libya were more difficult to find after the wake of departures during
Jan Feb Mar Apr May June July Aug Sep Oct Nov Dec 0 200 400 600 800 1 000 1 200 1 400 1 600 1 800 2 000
Figure 9. In 2012, there was a steady increase in detections on the Central Mediterranean route, mostly sub-Saharans departing from Libya
the ‘Arab Spring’, and are often overloaded. Rubber boats, the cheapest alternative to the wooden fishing boats, are prone to capsizing in high-sea conditions and have often been equipped with poor engines, two factors contributing to increasingly put migrant lives at risk. From Tunisia, mi-grants sailing without facilitation often do so aboard small rubber boats, whereas fa-cilitation networks continue to advertise sea crossings on wooden fishing boats. Most migrants departed from Libya and about a quarter had left from Tunisia and a minor-ity from Egypt.
In addition, a few migrants detected near Sic-ily and the southern Italian coast mentioned that they had left from Turkey or were de-tected after transiting through the Greek Island of Crete, sometimes arriving in Crete from Athens.
From Tunisia
The number of Tunisians detected on the Central Mediterranean route significantly dropped after September 2012, when an agreement was reached between Italy and Tunisia to repatriate up to 100 Tunisians per week. This also coincided with rougher sea conditions and the capsizing of a boat soon after its departure during which as many as 50 casualties have been reported. All these factors contributed to deter many Tunisians from illegally crossing the Medi-terranean Sea.
While most departures from Tunisia in the first half of the year took place from southern Tunisia, there was of shift to more departures from the northern part of the country as of September, most probably due to the wors-ening weather conditions south and west of the Pelagic Islands.
The decreasing trend in departures from Tunisia is expected to be reinforced by en-hanced patrol capacities of the Tunisian au-thorities. In December, Tunisia received two patrol boats, from the Italian Ministry of In-terior to support the fight against clandes-tine migration from Tunisia to Italy. A third boat of the same type will be handed over in early 2013.
From Libya
Most sub-Saharans detected in the Cen-tral Mediterranean area in particular from Eritrea and Somalia, reported to have de-parted from Libya, in particular from the coastal areas near Tripoli, Zawiya and Benghazi.
Different routes are used to bring the mi-grants to the Libyan border. In some cases, migrants have been reported leaving as far away as Chad.
From Egypt
In 2012, the first detections for illegal bor-der-crossing in the Central Mediterranean area from Egypt occurred in April. Alexandria was mentioned as the main area for depar-tures. Most migrants were promptly read-mitted to Egypt.
Nationalities on the Central Mediterranean route
Somali migrants
Most detected Somalis were young males (18–24 years) with secondary education and low or no income. The main reason for the migration was socio-economic, but in some cases it was military conflict. Many Somali migrants mentioned escaping the threat of the terrorist group Al Shabab.
Most Somalis were detected by Italian au-thorities, but in the second quarter of 2012, the arrival of Somali migrants in Malta in-creased significantly to almost 600 during that quarter. They had been promised that they would be brought to Italy. In the past, Malta resettled some Somali migrants in the United States and in some Member States, which might be a pull factor.
Somali migrants are also among the most commonly detected nationalities using fraud-ulent documents on intra-Schengen flights. Eritrean migrants
Many Eritrean nationals, after leaving their home either to avoid military service or in the hope of finding better living conditions, gather in Kassala and then spend some time in the UN refugee camp in Shagarab. They then move further to Khartoum, where they stay a few months or years either in employment or try-ing to find some type of job.
Once they decide to travel further, typically Sudanese and Eritrean facilitators assist them to reach the border with Libya. In Tripoli the local facilitation networks take over the fa-cilitation arrangements.
Tunisian migrants
Most Tunisian migrants were young (18–29 years) unmarried males with a primary level of education and low incomes. Many Tuni-sians have relatives or friends in the EU ready to help them settle in, especially in Italy. Tuni-sian migrants typically arrived undocumented to avoid readmission because Italy and Tuni-sia cooperate with regard to the repatriation of documented Tunisians. After reaching Italy, they continue their journey to other Mem-ber States; the majority travel to France as they speak French.
Egyptian migrants
Mostly Egyptian migrants detected crossing the Mediterranean Sea to the EU are young males (16–19 years), looking for economic op-portunities in the EU or escaping the current tensions between Coptic and Muslim com-munities. Most of them rely on facilitation network operating in Alexandria. Once de-tected for illegal border-crossing, they are re-turned to Egypt under bilateral agreements. n Western Mediterranean route (sea, Ceuta and Melilla land)
In the Western Mediterranean area, between northern Africa and Spain, detection for ille-gal border-crossing totalled 6 397, represent-ing a 24% decrease compared to 2011, a level comparable to the detections reported be-tween 2008 and 2010. Most migrants were Algerians and sub-Saharans departing from Morocco and Algeria.
Top Increase Top Decrease
2012 2011 0 5 000 10 000 15 000 20 000 25 000 30 000
Somalia Eritrea Gambia Tunisia Nigeria Ghana Figure 10. The largest annual increases were reported for migrants from the Horn of Africa, in particular from Somalia and Eritrea