parameter values for visual object classification
Rami Albatal and Suzanne Little INSIGHT Centre for Data Analytics, Dublin City University, Dublin, Ireland
[email protected] http://www.insight-centre.org/
Abstract. This paper presents a preliminary exploration showing the surprising effect of extreme parameter values used by Support Vector Machine (SVM) classifiers for identifying objects in images. The Radial Basis Function (RBF) kernel used with SVM classifiers is considered to be a state-of-the-art approach in visual object classification. Standard tuning approaches apply a relative narrow window of values when deter-mining the main parameters for kernel size. We evaluated the effect of setting an extremely small kernel size and discovered that, contrary to expectations, in the context of visual object classification for some object and feature combinations these small kernels can demonstrate good clas-sification performance. The evaluation is based on experiments on the TRECVid 2013 Semantic INdexing (SIN) training dataset and provides initial indications that can be used to better understand the optimisation of RBF kernel parameters.
Keywords: Visual Object Classification, SVM, RBF, optimisation, ex-treme parameter values
1
Introduction
Optimising machine learning algorithm parameters is a crucial task for building reliable classifiers. In the context of automatic image indexing and visual object classification, the Support Vector Machine SVM [1] is the most popular machine learning algorithm and is frequently adopted as the state-of-the-art algorithm relied on in manny applications. The SVM is a supervised learning algorithm that analyses data to recognise patterns for classification and regression analysis. In the case of visual descriptor classification, the complex feature space is often non-linearly separable, a fact that leads to the usage of the kernel trick [2] in order to implicitly map the features into high-dimensional spaces where it is easier to find hyperplanes that separate the positive from the negative examples.
Visual object classification aims to identify objects of interest in image or video keyframes based on low-level features generally using trained classifiers such as SVMs. Exhaustive parameter tuning is often infeasible due to the very large, heterogeneous datasets, sparse, high-dimensional feature space and need
to manage computational complexity. However, as a technical report by Lin, Hau & Chang [3] illustrates, even small efforts toward parameter tuning can yield good performance gains.
While there are many configurable options throughout the visual object clas-sification pipeline, including data normalisation, distance metrics, kernel type etc., we focus in this paper on using the de facto settings for visual descriptor classification and choose to examine one parameter of the most popular SVM kernel used for visual feature classification (and for many other classification tasks) the Radial Basis Function (RBF) kernel. In [4] we can find the following definition of the RBF kernel that has two feature vectorsxandx0:
K(x, x0) =exp −kx−x 0k2 2 2σ2 ! (1) wherekx−x0k22is the squared Euclidean distance between the vectorsxandx0, andσis a parameter to control the size of the kernel. Theσparameter is often optimised through another representation calledgammarepresented as follows:
γ=− 1
2σ2 (2)
As we can see in the formula 2, σ2andγ are inversely proportional. The larger the value ofγthe smaller the value ofσand the smaller is the kernel size. From a very simplified point-of-view, a large γ value leads to narrow influence zone for each single training example in the new feature space. When a new example is evaluated, and if gamma is well tuned, this new example will fall into the influence zone of positive example(s) if it is a positive data sample, or it will fall into the influence zone of negative example(s) in the opposite case.
In this article, we explore the values of theγ parameter in the RBF kernel with a fixed cost value in the context of visual object classification. Most of the works in the domain explore some restricted range ofγvalues and avoid to go to extreme limits in order to avoid over-fitting, where large ratio of training examples will be considered as support vector. Our initial observations show that it is not always the case, and for some Object/Feature combinations, choosing largeγ values can lead into good classification performance. These observations will be the subject of a future in-depth analysis in order to determine when performance may benefit from extreme gamma values.
The rest of this article is organised as follows: First, in section 2 we will present the state-of-the-art works on optimising the SVM parameter for visual object classification, then in section 3 we will present our results obtained from experiments on TRECVid 2013 SIN training set [5], and finally we will discuss our results in section 4 where we will present future work based on our observa-tions.
2
Related works
Optimisation efforts are commonly concerned with the problem of choosing the best features (see a recent review [6]) however the problem of parameter
op-timisation, both in general and for SVMs with RBF kernels in particular, has been tackled in a variety of ways ranging from heuristic methods to machine learning approaches designed to reduce the problem space. Some have applied genetic algorithms [7] or other machine learning techniques (e.g., particle swarm optimisation [8]) to identify optimal settings. Others perform grid search using a tuning dataset to find the best settings without over-tuning or apply optimisation strategies. For instance, Duan, Keerthi & Poo [9] examined the computational cost of various optimisation approaches. Past efforts have focussed on domains such as bioinformatics, genomics and finance. The standard approach in visual object classification is generally to follow the configurations suggested in [10]. The main challenge is to balance the computational requirements with the risk of over-fitting to a particular dataset and the potential performance gains from careful parameter tuning.
Many of the state-of-the-art works use cross-validation functions and optimi-sation tools provided by SVM libraries like LibSVM [11]. These libraries often sequentially test a set of gamma and cost values chosen a priori and do not rely on the feature dataset. Most of the works focus on the feature space itself by normalising the descriptors using L1 or L2, widely used for histogram-like descriptors [12, 13], or Min max normalisation like the one used in LibSVM, or Zero-Mean and unit-variance, or the Power transformation proposed by [14]. After normalising the descriptors, SVM parameters will be optimised to build classifiers; and as far as we know not no state-of-the-art focused its work on studying the ranges of SVM parameters and more precisely on theγ values of the RBF kernel.
In [10] we can find a good indication about how to choose thegammavalue of RBF:
“We first subsample the training data (if the training data set is not large, use the whole training data), then compute the distance between the points and find the distances at 0.9 and 0.1 quantile of all the distances, the average distance of these two distances is set to be the initialσ0. This is to guarantee that the kernel parameter is neither too big or too small. Other values ofσto be selected in the experiments (via cross-validation) are [10−4σ
0, ..., σ0, ...,103σ0,104σ0]”.
This heuristic is adopted and adjusted by Safadi and Quenot [14] for the domain of visual descriptors learning and classification, they calculate the average Eu-clidean distance between a subset of the descriptors then fixgammaas follows:
γ= 2
i
meanDist2 (3)
with meanDist is the average distance between the descriptors in the dataset, and i is a positive integer parameter, fixed as 1 or 2 in the case of descriptors with large dimensionality, and 3 or 4 for descriptors with small dimensionality (up to few hundreds). The reasons why the gammavalidation does not cover moreivalues is the computational cost (the larger the ithe slower the learning
and the test), and to avoid the over-fitting caused by very largegammavalues. In this paper, we adopt thegammaoptimisation formula mentioned above in 3 and perform an empirical evaluation to test the maximum boundary forgamma
values in the case of low dimensionality descriptors (chosen for computational reasons).
3
Experiments
The experiments were applied on the the development set of the large scale TRECVid 2013 Semantic INdexing task collection (SIN). TRECVid is an eval-uation campaign organised on a yearly basis by the US National Institute of Standards and Technology (NIST)1, focusing on a set of different information retrieval (IR) research areas in content-based retrieval and exploitation of digital video. Started in 2010, the SIN task allow the research community to evaluate and compare methods for automatic assignment of semantic tags representing visual or multimodal concepts (previously “high-level features”) to video seg-ments. SIN is attracting more and more research interest and in 2013 there are more than 100 submissions from over 20 research projects and teams. The devel-opment collection (used in this exploration) contains 545,923 video shots, split into two subsets for cross validation: 2013x that contains 268,986 shots, and 2013y that contains 276,937 shots, and 60 concepts to be classified. Three small dimensionality descriptors were evaluated:
– gab40: normalized Gabor transform, 8 orientations x 5 scales→ 40 dimen-sions.
– h3d64: normalized RGB Histogram 4x4x4→64 dimensions. – hg104: early fusion of h3d64 and gab40→104 dimensions.
These descriptors have been produced and shared by various partners of the IRIM (Indexation et Recherche d’Information Multim´edia) project of GDR-ISIS research network from CNRS-France.
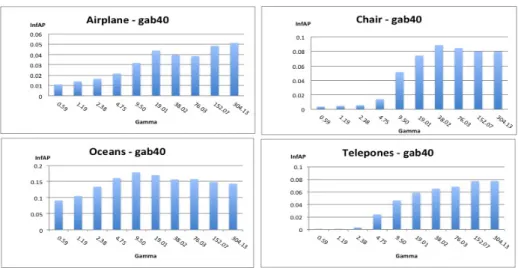
The Formula 3 was applied withi = [0, ...,10] which allowgamma to have very large values that are not usually evaluated in these kinds of tasks. The optimisation was performed by 2-fold cross validation (trai on 2013x then test on 2013y, train on 2013y then test on 2013x), and the goal is maximising the Mean extended inferred average precision [15] used as performance measure in TRECVid 2013 SIN task. Figures 1 and 2 show examples of the classification performances on four different objects using the 10 values ofgammacalculated using Formula 3 andi= [0, ...,10] for gab40 and hg104 descriptors respectively2. These figures are merely samples of results to illustrate that descriptors differs in term of dimensionality, quality of classification results and inγvalues tuning profiles — indications that favour per-class classification optimisation rather than multi-class optimisation.
1
http://trecvid.nist.gov/
2 Note that the scale of the y axis is not the same in all the charts, because it is adjusted to include the minimum and the maximum results
Fig. 1.Validation results for gab40 feature
Fig. 2.Validation results for gab40 feature
Table 1 presents the optimalγ value that gives the best results for each of the 60 visual concepts in TrecVid 2013. We did evaluate setting small values ofγ
(2−15,2−12,2−9) but results had lower infAP than those presented in the table, thus are not included here.
Optimalγ Values Optimalγ Values gab40 h3d64 Hg104 gab40 h3d64 Hg104 Airplane 304.5419.34 19.19 Anchorperson 19.01 2.42 1.20
Animal 76.03 19.37 19.18 Baby 76.03 2.42 1.20
Basketball 76.03 1.21 0.60 Beach 38.02 1.21 1.20
Bicycling 304.13 38.73 9.59 Boat Ship 152.27 309.844.80 Boy 304.13 38.73 76.74 Bridges 304.13 154.929.59 Bus 304.13 309.84 76.74 Car Racing 152.07 38.73 38.37
Chair 38.02 19.37 9.59 Cheering 9.50 9.68 2.40
Classroom 304.13 154.92 38.37 Computers 38.02 38.73 4.80
Dancing 304.134.84 4.80 Protest 4.75 4.84 4.80
Door Opening 9.50 4.84 2.40 Explosion Fire 304.1319.37 2.40 Female Face 152.079.68 9.59 Fields 76.03 0.61 0.60
Flags 2.38 2.42 1.20 Flowers 38.02 2.42 1.20
Forest 76.03 4.84 2.40 George Bush 38.02 38.73 4.80 Girl 76.03 19.37 9.59 Government Leader 19.01 9.68 4.80
Greeting 4.75 4.84 1.20 Hand 38.02 38.73 4.80
Highway 38.02 38.73 4.80 Hill 76.03 2.42 1.20
Instr Musician 38.02 19.37 4.80 Kitchen 304.13 38.73 9.59
Lakes 38.02 4.84 4.80 Meeting 9.52 19.34 0.60
Military Airplane76.03 309.84 76.74 Motorcycle 1.19 38.73 38.37 News Studio 19.01 2.42 2.40 Nighttime 152.07 309.849.59
Oceans 9.50 9.68 1.20 Office 38.02 9.68 2.40
Old People 38.02 9.68 4.80 People Marching 9.50 9.68 4.80 Press Conference 304.54 309.444.80 Quadruped 152.07 77.46 9.59 Reporters 38.02 0.61 1.20 Roadway Junction 76.03 19.37 9.59
Running 76.03 4.84 2.40 Singing 76.03 19.37 4.80
Sitting Down 38.02 9.68 4.80 Skating 19.01 4.84 2.40
Skier 76.03 38.73 19.18 Soldiers 38.07 154.72 76.74
Stadium 76.03 154.92 38.37 Studio AP 19.01 2.42 1.20 Swimming 9.50 0.61 0.30 Telephones 304.13 154.929.59 Throwing 152.074.84 1.20 Traffic 152.07 77.46 4.80 Table 1.Optimalγvalues for all TrecVid 2013 SIN training dataset, value are found by cross validation on 2013x and 2013y subsets, large values (>30) are in bold.
4
Discussion and Future work
From Figures 1,2 and Table 1 we give the following remarks:
– Optimalγ values can be very large in the context of visual descriptor clas-sification.
– The smaller the dimensionality of the visual descriptor, the more likely the optimum value is large (75% of γ values of gab40 are high, 37% in the case of h3d64, and 13% in the case of hg104). This observation should be consolidated by testing other low dimensionality descriptors as well as large descriptors such as those based on the Bag-of-Visual-Words model [16]. – There is insufficient indication about why and when we should set and
eval-uate large values ofγ, and how large they should be.
Contrary to generally accepted practise that a small kernel size is undesirable, the preliminary results obtained from the experiments presented in this paper show that large values of RBFγ parameter does not necessarily appear to lead to over-fitting. These results are clearly preliminary. However in order to better understand our results, we are planning to perform further analysis on:
– The descriptors in the dataset (distances between the descriptors in the original feature space as well as in the high RBF dimensional space). – The relations between the positive/negative examples in the dataset and the
γvalues.
– The relation between the dimensionality of the descriptors and theγvalues. In conclusion, the motivation behind this work was to improve the perfor-mance of our classifiers in the TRECVid2013 SIN task while minimising com-putational effort. The results from this will be available shortly and we hope to conduct further analysis of the impact of extreme parameter values based on this work. We hope to produce some guidelines on the dataset characteristics where such large values are worthy of investigation.
Acknowledgements
Part of the research leading to these results has received funding from the Eu-ropean Union Seventh Framework Programme (FP7/2007-2013) under grant agreement number 285621, project titled SAVASA.
References
1. Corinna Cortes and Vladimir Vapnik. Support-vector networks. InMachine Learn-ing, pages 273–297, 1995.
2. M. A. Aizerman, E. A. Braverman, and L. Rozonoer. Theoretical foundations of the potential function method in pattern recognition learning. InAutomation and
3. Chih Jen Lin, CW Hsu, and CC Chang. A practical guide to support vector classification, 2003.
4. J. P. Vert, K. Tsuda, and B. Scholkopf. A primer on kernel methods. Kernel
Methods in Computational Biology, pages 35–70.
5. Alan F. Smeaton, Paul Over, and Wessel Kraaij. Evaluation campaigns and trecvid.
InMIR ’06: Proceedings of the 8th ACM International Workshop on Multimedia
Information Retrieval, pages 321–330, New York, NY, USA, 2006. ACM Press.
6. Ver´onica Bol´on-Canedo, Noelia S´anchez-Maro˜no, and Amparo Alonso-Betanzos. A review of feature selection methods on synthetic data. Knowledge and information systems, 34(3):483–519, 2013.
7. Cheng-Lung Huang and Chieh-Jen Wang. A ga-based feature selection and param-eters optimizationfor support vector machines. Expert Systems with applications, 31(2):231–240, 2006.
8. Shih-Wei Lin, Kuo-Ching Ying, Shih-Chieh Chen, and Zne-Jung Lee. Particle swarm optimization for parameter determination and feature selection of support vector machines. Expert Systems with Applications, 35(4):1817–1824, 2008. 9. Kaibo Duan, S Sathiya Keerthi, and Aun Neow Poo. Evaluation of simple
per-formance measures for tuning svm hyperparameters. Neurocomputing, 51:41–59, 2003.
10. Ichiro Takeuchi, Quoc V. Le, Timothy D. Sears, Alexander J. Smola, and Chris Williams. Nonparametric quantile estimation. Journal of Machine Learning Re-search, 7:7–1231, 2006.
11. Chih-Chung Chang and Chih-Jen Lin. LIBSVM: A library for support vector machines.ACM Transactions on Intelligent Systems and Technology, 2:27:1–27:27, 2011. Software available athttp://www.csie.ntu.edu.tw/~cjlin/libsvm. 12. J. Sivic and A. Zisserman. Video Google: A text retrieval approach to object
matching in videos. InProceedings of the International Conference on Computer
Vision, volume 2, pages 1470–1477, October 2003.
13. K. E. A. van de Sande, T. Gevers, and C. G. M. Snoek. Evaluating color descriptors for object and scene recognition. IEEE Transactions on Pattern Analysis and Machine Intelligence, 32(9):1582–1596, 2010.
14. Bahjat Safadi and Georges Qu´enot. Descriptor optimization for multimedia index-ing and retrieval. InCBMI, pages 1–6, 2013.
15. Emine Yilmaz, Evangelos Kanoulas, and Javed A. Aslam. A simple and efficient sampling method for estimating ap and ndcg. In Proceedings of the 31st annual international ACM SIGIR conference on Research and development in information
retrieval, SIGIR ’08, pages 603–610, New York, NY, USA, 2008. ACM.
16. Gabriella Csurka, Christopher R. Dance, Lixin Fan, Jutta Willamowski, and Cdric Bray. Visual categorization with bags of keypoints. InIn Workshop on Statistical