A New Structural Analysis Model for E-commerce Ecosystem
Network
Zhihong Tian
1, Zhenji Zhan
1and Xiaolan Guan
21
Beijing Jiaotong University, China
2Beijing Institute of Graphic Communication, China
Abstract
The paper establishes a new theoretical and methodological analysis model based on ecosystem theory and network science for researching on e-commerce market structure. The model considers three steps to answer the questions for explaining the structure—element identification, relationship analysis and formation mechanism analysis. Then, several suggestive applications based on the analysis model are shown. The systematic analysis framework provided by the model will lead to further research that will reveal the hidden mechanism of Web economic and Internet social system.
Keywords: e-commerce, e-commerce ecosystem, structural analysis model, network science
1. Introduction
With the popularity of the Internet, more and more enterprises and individuals are involved in e-commerce. Up to present, applications of e-commerce have achieved lots of substantial progresses, and e-commerce is playing a very important role in national economy. Large numbers of buyers and sellers interact with each other through transactions on websites. These interactions promote the evolution and shape complex structures of e-commerce market. Going deeply insight into research of e-commerce market structure has a profound
and lasting significance—academic and practical significance.
The structure of a thing is how the parts of it relate to each other, and how it is “assembled”. Research on system structure must answer the following three questions:
Question 1: what parts the system contains? Question 2: how the parts relate to each other? Question 3: how they compose the system?
Up to now, researches about e-commerce market structure can be divided into several different aspects. First, some articles examine how various features of electronic markets impact on market structures. These features include information transparency (Grover, Ramanlal & Segars, 1999), product design strategies (Bharg & Choudhary, 2004) and how e-market principles can change the structure of government services (West, 1997). They focus on specific structures of e-commerce marketplace, not the macroscopic one. Secondly, some articles recognize and classify actors in the market by their roles, such as B2B, B2C, and B2G
and so on. The classification can provide a basic platform for researching structures further. Thirdly, a biological structure including leadership population, key population, support population and parasitic population is proposed which roots the concepts of biological ecosystem and business ecosystem. Similar to business ecosystem, e-commerce ecosystem can also be defined as a dynamic structure system composed of correlated organizations. The organizations in this dynamic structure system may be enterprises, colleges, institutions, social public institutions and other organizations related to the system, the destinies of which are closely interwoven. They interact through a series of activities, and their relationships may be either competition or cooperation. And energy and information flows are generated in their interaction, keeping them unbalanced all along. In addition, with the development of network
science, some articles examine the e-commerce market structure as a network. Cai et al.,
(2008) develop a social network model for a mobile e-commerce system, which could give ratings between buyers and sellers in terms of their social relationships, actual geographical
distances and transaction records. Piao, et al., (2010) establish a multi-agent model for
e-commerce transaction network, and analyze degree centrality and betweenness centrality. While literature study is being carried, the lack of a theoretical and methodological framework has been found. Our motivation originates from the lack. The aim of this paper is to establish a new theoretical and methodological model based on ecosystem theory and network science for analysis on e-commerce market structure. The model considers 3 steps to
answer the above 3 questions for explaining the structure—element identification,
relationship analysis and formation mechanism. There is a additional step before element
identification—system demarcation.
The rest of this paper is organized as follows. Section 2 contains the origin of e-commerce ecosystem network; In Section 3, we propose the model and explain the key steps; In Section 4, several applications based on the analysis model are shown. Conclusions are dedicated in Section 5.
2. Origin of E-commerce Ecosystem Network
2.1 Business ecosystem
Business ecosystem is a new concept that has its roots in biological ecosystem. It draws analogies from nature and studies how these phenomena may be observed in business context. Because of its novelty, the definition of business ecosystem must be formed by drawing ideas from many sources. Finally, modeling of an organization population based on the concept of business ecosystem is discussed. Hannon (1997) claims that economics and ecology have many obviously common features. They both study dynamic, organically-based systems, which have methods of production, exchange, capital stocks and storage. According to Lewin (2000), there are ecological communities in nature in which species exist as part of a rich network of connections. These communities form local ecosystems which have system level properties. The process of co-evolution is producing even more complex economic webs in the world of high technology, with software, hardware, and Internet companies interacting to produce a complex economic web (Lewin, 2000).
However, it should be pointed out that there are differences between natural and business ecosystems. First of all, in business ecosystems the actors are intelligent and are capable of
planning and picturing the future with some accuracy. Second, business ecosystems compete over possible members. This kind of behavior can not be observed in nature. Third, business ecosystems are aiming at delivering innovations, where natural ecosystems are aiming at pure survival (Iansiti & Levien, 2004).
2.2 E-commerce ecosystem
The e-commerce ecosystem is application the theory and research of natural ecosystem and business ecosystem in the field of electronic commerce. The e-commerce ecosystem is composed of a series of enterprises and organizations closely related that beyond the geographical boundaries, takes Internet for a competition and communication platform, completes complementary and resource sharing through virtual, alliances and other forms, exchanges funding, capital and information relying on their core competencies and strengths in order to achieve added value.
The e-commerce ecosystem includes the core e-commerce companies, suppliers, customers, financial institutions, certification bodies, payment institutions, logistics companies, insurance companies, telecommunications service providers, software providers, Internet technology providers, government departments, industry associations, Internet marketing services,
technology outsourcing business, e-commerce consulting service providers, etc.
2.3 Network description for e-commerce ecosystem
Complex network theory is a new theory that synthesizes the research results of self-organization theory, nonlinear theory and complexity theory in the past. In the complex network theory, it has been discovered that there is a significant relationship between the
behavior of agents and their underlying network structures. As the structure and morphology of complex systems, it focuses on the topological characteristics of the system structure. We can put any complex system as a complex network to study. Using complex network to study complex system can enhance the in-depth understanding of system structure. Hence, we propose a network model for e-commerce ecosystem
The network is constituted by nodes and links between nodes (edges). Nodes represent the
elements in a complex system, and the edges represent the interaction between system elements. E-commerce ecosystem is a complex network, and its complexity reflects in the following areas:
(1) The system has a huge number of nodes, and its network structure is complex and presents a variety of different characteristics. E-commerce ecosystem contains a number of species and large number of individuals. The relationships among them form a complex structure, such as value chain (food chain) and clustering (community), and even form winner-take-all giant nodes.
(2) There are the generation and disappearance of nodes or edges. The emergence and demise of elements that have the life-cycle characteristic is very common. The relationships among elements are also dynamic changed.
(3) The weights of links among nodes are differences, and have different directions. (4) Dynamical complexity: the state of the network subject (person or organization) changes over time.
(6) Multiple and complex fusion: multiple and complex interactions lead to more unpredictable results.
From a mathematical point of view, network can be described by set N={V, E} composed
with nodes set V={v1,v2,…,vn,…} and edges set E={e1,e2,…,en,…}. According to different
research scope, the node and edge represent different meaning. For example, B2B competition network contains only one type of node (business website) which is called 1-mode network, and B2C network normally contains two types of nodes (business website and customer) which is called 2-mode network. However, in e-commerce platform ecosystem
network, there could be more types of nodes—the core e-commerce companies, suppliers,
customers, financial institutions, certification bodies, payment institutions, logistics
companies, etc.
3. Structural Analysis Model
In order to answer the above three questions, the following outline of the structural analysis process is proposed (Figure 1). First of all, system demarcation must be done to determine the scope of the study. In this step, environment and the e-commerce system will be divided. Secondly, elements including actors and groups will be identified by empirical study. This step tries to answer the question—what parts the system contains? The third step is relationship analysis. In this step, kinds of relationships will be examined carefully. The last step—formation mechanism
—will be proposed and mathematic models will be established.
System Demarcation Element Identification Question 1 Relationship Analysis Formation mechanism Question 2 Question 3
Figure 1. The outline of the structural analysis process
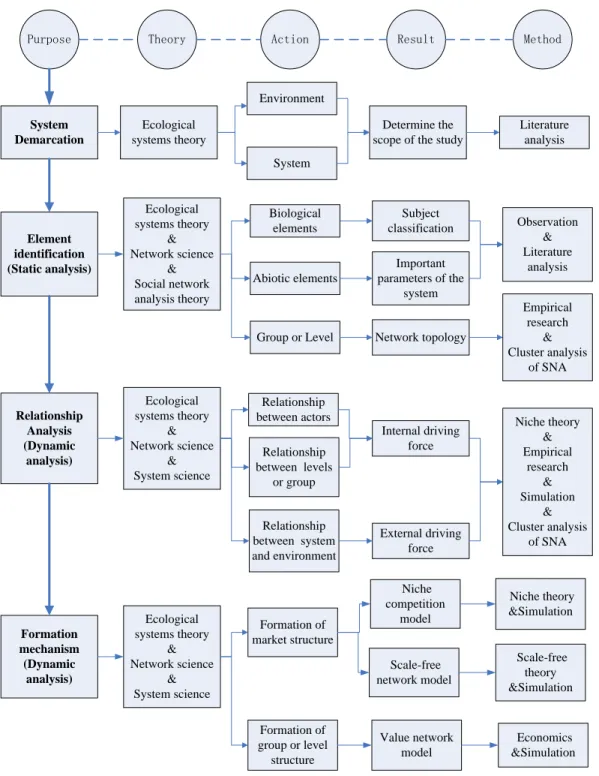
The outline is expanded to a matrix, as Figure 2. The column represents four steps of the analysis framework—system demarcation, element identification, relationship analysis and formation mechanism analysis. The row represents the purpose, theory, action, result and method of each step.
System Demarcation
Action
Purpose Theory Result Method
Ecological systems theory Environment System Literature analysis Determine the
scope of the study
Element identification (Static analysis) Ecological systems theory & Network science & Social network analysis theory Abiotic elements Biological elements Subject classification Important parameters of the system Relationship Analysis (Dynamic analysis) Observation & Literature analysis Ecological systems theory & Network science & System science Relationship between actors Relationship between levels or group Relationship between system and environment Network topology Group or Level Empirical research & Cluster analysis of SNA Internal driving force External driving force Niche theory & Empirical research & Simulation & Cluster analysis of SNA Formation mechanism (Dynamic analysis) Ecological systems theory & Network science & System science Formation of market structure Formation of group or level structure Niche competition model Niche theory &Simulation Value network model Economics &Simulation Scale-free network model Scale-free theory &Simulation
Figure 2. The structural analysis model for e-commerce ecosystem network 3.1 System demarcation
The first step is a preparatory work for the analysis process. In this step, we must determine the scope of e-commerce system according to the purpose of research. In a normal circumstance, the macroscopic e-commerce system contains almost all the economical and
social elements. However, in order to simplify the system, the core—Internet economic
The theory of business ecosystem goes beyond the scope of general industry, uses dynamic idea of development, and describes relationships between business and environment. In e-commerce field, obvious symbiotic relationships and clustering phenomenon have appeared, and the organizational elements, structure, and function of e-commerce ecosystem have shown significant ecological features. Therefore, it is probably easier to make an analogy between the concept of ecosystem and e-commerce system. According to the research results of business ecosystem, e-commerce ecosystem is logically divided into three levels—individuals, populations, and communities, as Figure 3.
Individual
Resouces
Population Community
Group Environment
Figure 3. System demarcation of e-commerce ecosystem 3.2 Element identification
All elements in ecosystem can be divided into biological ones and abiotic ones. The biological elements could be individuals, populations, communities or groups. The abiotic elements could be value, logistics, information, and finance which are flowing around and connect the biological elements together. Element identification should study features of elements and classify them. For example, homogeneous individuals compose the population, and different individuals compose community. The members of population can be divided into four kinds—leadership population, key population, support population and parasitic population, according to their different roles in the system, as Figure 4.
Leadership population Abiotic environment Leadership population Leadership population Parasitic population Key population Support population
3.3 Relationship analysis
Social network analysis (SNA) is a quantitative method used to study the relationships among actors and groups in e-commerce ecosystem network.
Degree centrality
The first and simplest one is degree centrality. Degree centrality is defined as the number of
links incident upon a node. Degree is often interpreted in terms of the immediate risk of node for catching whatever is flowing through the network. If the network is directed (meaning that ties have direction), we usually define two separate measures of degree centrality, namely in-degree and out-degree.
The absolute value of the degree centrality is defined as follows:
j ji j ij i i D n d n x x C ( ) ( )The value of xij is 0 or 1, which means whether there is relationship between the actor j and
i or not. The standardized value is defined as follows:
)
1
/(
)
(
)
(
n
d
n
g
C
D iThe definition of centrality can be extended to graphs. The graph G (group degree
centrality) is defined as follows:
g i i D D g i i D D n C n C n C n C DC
1 * 1 * )) ( ( max ) ( ) (This formula means a gap between the largest degree centrality and the degree centrality of any other actor in the network. The greater this difference is, the higher the group degree centrality of the entire network is. The extreme is the star network.
Small group
Small group (subgroup or cliques) is a sub-group in which the relationships of the members are particularly close. Small groups can match the factions, which is the overall structure indicators of network. There are two kinds of methods for the calculation of small groups. First, calculate the node degree, and view a group of connected nodes as a small group. Second, nodes that can be achieved in the distance will be viewed as a small group. Clustering coefficient
The global clustering coefficient is based on triplets of nodes. A triplet consists of three nodes that are connected by either two (open triplet) or three (closed triplet) undirected ties. A triangle consists of three closed triplets, one centered on each of the nodes. The global clustering coefficient is the number of closed triplets (or 3 x triangles) over the total number of triplets (both open and closed). The first attempt to measure it was made by Luce and Perry (1949). This measure gives an indication of the clustering in the whole network (global), and can be applied to both undirected and directed networks. Formally, it has been defined as:
N n
n represents the number of triangles, and N represents the number of connected triples of vertices. Clustering coefficient is a very important index for description of network structure. 3.4 Formation mechanism
The above relationship analysis is a transition from static analysis to the dynamic one, and the step provides lots of empirical conclusions and theoretical assumptions for the research on
formation mechanism. Formation mechanism could be studied from two aspects—niche
model and scale-free network model. Niche model
In ecology, a niche is a term describing the way of life of a species. Each species is thought to have a separate, unique niche. The ecological niche describes how an organism or
population responds to the distribution of resources and competitors (e.g., by growing when
resources are abundant, and when predators, parasites and pathogens are scarce) and how it in
turn alters those same factors (e.g., limiting access to resources by other organisms, acting as
a food source for predators and a consumer of prey). The majority of species exist in a standard ecological niche. A business enterprises niche model for explaining e-commerce market structure based on ecosystem theory is as Figure 5.
Dimension of market space E-commerce website Dimension of time Dimension of resource Dimension of viability
Figure 5. A business enterprises niche model Scale-free network model
A network with the scale-free property follows the power-law distribution p(k)~k-γ, which
means most nodes in the network will have a few links and a few nodes will have a large
number of links (Barabasi & Albert, 1999). Here, the degree k means the number of links of a
given node. The latter ones can be named hub nodes. This may result in a high dependency on
the hub nodes. The most important exponent γ of the power function represents the
characteristic and shape of the network topology. If the exponent γ is small, a few hubs
dominate the network. As many empirical studies and numerical simulations of the network
evolution have shown, the exponent γ of the node degree frequency distribution of these
networks ranges between 2 and 3 (Albert, Jeong & Barabasi, 1999).
The emergence of the power-law degree distribution has been traced back to two mechanisms. First, most networks grow through the addition of new nodes, that link to nodes already present in the system. Second, most real networks exhibit preferential attachment, i.e.. The two ingredients—growth and preferential attachment, inspire the introduction of the scale-free model that leads to a network with a power-law degree distribution. The algorithm of the scale-free model is the following (Luce & Perry , 1949) ( BA (Barabasi-Albert) model):
(1) Growth: Starting with a small number (m0) of nodes, at every time step we add a new
node with m(≤m0) edges that link the new node to m different nodes already present in the
(2) Preferential attachment: When choosing the nodes to which the new node connects,
we assume that the probabilityΠithat a new node will be connected to node i depends on the
degree kiof node i, such that:
Numerical simulations indicate that this network evolves into a scale-invariant state with the probability that a node has k edges following a power-law with an exponent γ= 3. The
scaling exponent is independent of m, the only parameter in the model. In our structural
analysis model, based on the modification of BA model, a series of new models could be proposed for understanding the formation process of the scale-free network in e-commerce market.
4. Applications of the Model
The structural analysis model has been applied in our researches on e-commerce, and some results have been achieved. In this section, some of applications of the model will be shown.
4.1 An empirical analysis case of static structure
In our structural analysis model, empirical analysis indicates that distributions of some indexes of e-commerce market follow a power-law. For example, one of our papers shows
that the exponent γ of B2C e-commerce trading volume distribution is 1.59 which is
significantly smaller than 2. It implies that the majority of market share is gathered to a few websites, and the concentration of the network is more obvious than ones generated from BA model.
The data of B2C market trading volume is quoted from the report “2011 Top30 of B2C Online retailers in China” (data source: IRESEARCH) (IRESEARCH, 2011). The data only includes transactions of tangible goods. The fitness curve of the cumulative distribution of the market trading volume is as Figure 6.
Figure 6. Fitness curve of the cumulative distribution of the market trading volume
n i i i k / k4.2 A case of degree centrality analysis
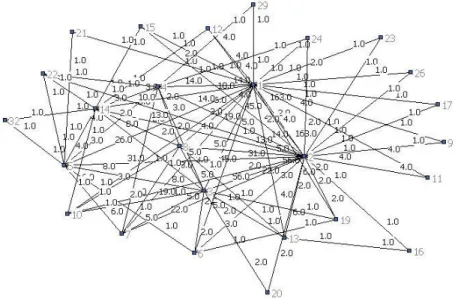
Degree centrality is defined as the number of links incident upon a node. Degree is often interpreted in terms of the immediate risk of node for catching whatever is flowing through the network. B2C e-commerce market is a 2-mode network which can be transformed into two 1-mode networks by UCINET—user-by-user 1-mode network and website-by-website 1-mode network. In this case, the result of degree centrality analysis implies that only 26 websites in the system have obvious competitive relationships with others. The competitive network of websites is as Figure 7. From the graph, we can visually observe the competitive structure of business websites and competitive relationships among them.
Figure 7. Competitive relationships among websites 4.3 A case of group finding
There are two kinds of methods for small group calculation. First one, calculate the node degree, and view a group of connected nodes as a small group. Second one, nodes that can be achieved in the distance will be viewed as a small group. In this case, we select the most
commonly used method—k-core. k-core is a maximal sub graph in which every node is
adjacent to k other nodes in the sub graph.
In order to reveal the network structure deeply, we execute k-core analysis. k-core is a
maximal sub graph in which every node is adjacent to k other nodes in the sub graph. As
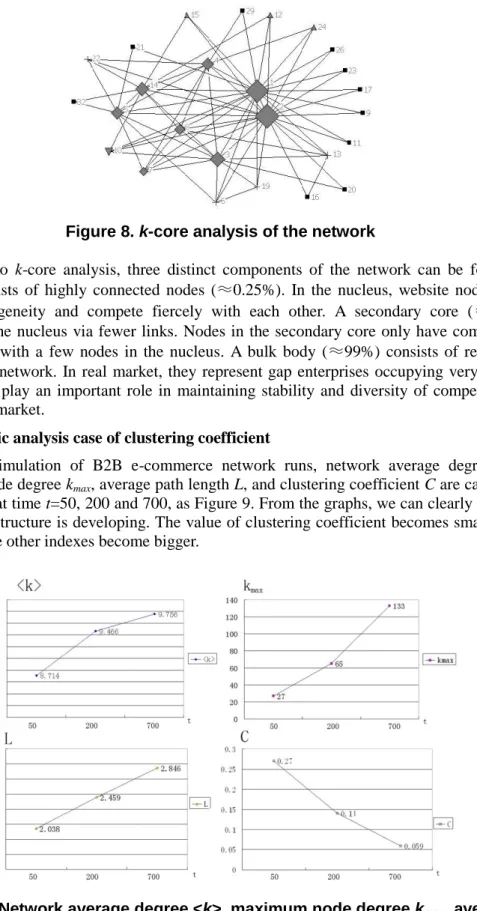
Figure 8 shows, there is a 6-core sub graph with 8 nodes which are represented by diamond. Nodes belonging to the 6-core sub graph have to be linked to at least 6 other nodes of the core. Sizes of nodes are set by their degrees. Node 10 which is represented by a down triangle has 5 links to the 6-core sub graph, so it is included in 5-core sub graph. Other nodes which are represented by plus, up triangle and square are same analogize.
Figure 8. k-core analysis of the network
According to k-core analysis, three distinct components of the network can be found. A
nucleus consists of highly connected nodes (≈0.25%). In the nucleus, website nodes have
strong homogeneity and compete fiercely with each other. A secondary core (≈0.8%)
connects to the nucleus via fewer links. Nodes in the secondary core only have competitive
relationships with a few nodes in the nucleus. A bulk body (≈99%) consists of remaining
nodes of the network. In real market, they represent gap enterprises occupying very narrow markets, and play an important role in maintaining stability and diversity of competition in e-commerce market.
4.4 A dynamic analysis case of clustering coefficient
When a simulation of B2B e-commerce network runs, network average degree <k>,
maximum node degree kmax, average path length L, and clustering coefficient C are calculated
by UCINET at time t=50, 200 and 700, as Figure 9. From the graphs, we can clearly see how
the network structure is developing. The value of clustering coefficient becomes smaller and smaller, while other indexes become bigger.
Figure 9. Network average degree <k>, maximum node degree kmax, average
4.5 A modified BA model for B2C e-commerce network
One of our papers proposes a B2C e-commerce network model with alterations of growth and preferential attachment mechanism. In B2C e-commerce market, at any time, some websites are born, while some ones are dying. The mortality rate in e-commerce market is significantly higher than that in traditional market because of special features of Web economic. In our model, at each time interval, one node is deleted in a given probability. The deleted node should be the weakest one in the network. The preferential attachment of BA model is based on the degree of nodes. The more links a node already has, the larger possibility of obtaining new links it has. All nodes are regarded as the same ones, and the differences among them are neglected. Therefore, the old nodes may have more links than latter ones. However, in the real competitive network, especially, in the e-commerce market, the nature and ability of nodes play important roles in attracting users. We improve the preferential attachment mechanism in our model. Nodes compete for links by different ability (fitness).
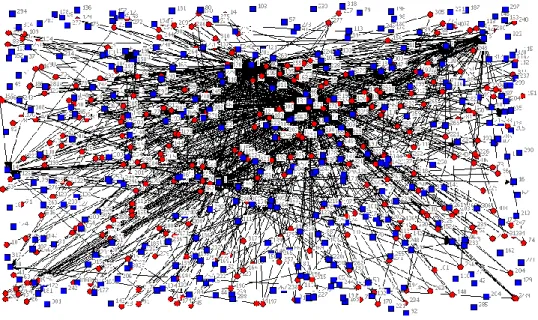
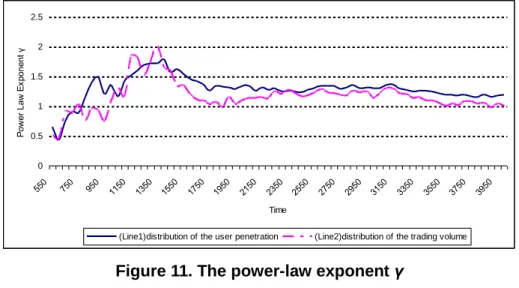
The simulation program calculates the power-law exponent γ of the network every other 50
time units from 550 time intervals until 4000 time intervals. The topology of the network at 4000th time step is as Figure 10. Round and square represent two types of nodes.
Figure 10. Topology of the network at 4000th time step
The simulation program runs with an initial network consisting of 2 website nodes (n0=2),
5 user nodes (m0=5), and other parameters are p=0.1, q=0.9, n1=1, n2=2, s=1. At the 4000th
step, there are 338 website nodes in the market. The power-law exponent γ of the network in
the process is as Figure 11. From the graph we can see how network structure changes while the network is growing. Lines fluctuate sharply and reach the peak at 1400th time unit (line1) and 1350th time unit (line2), then decrease and stabilize between 1 and 1.5.
0 0.5 1 1.5 2 2.5 550 750 950 1150 1350 1550 1750 1950 2150 2350 2550 2750 2950 3150 3350 3550 3750 3950 Time P ow er L aw E xp on en t γ
(Line1)distribution of the user penetration (Line2)distribution of the trading volume
Figure 11. The power-law exponent γ
In real e-commerce market, very few websites emerge in the market at the initial stage and get huge successes. At that time, the rising e-commerce market is small, immature and centralized. Then, a huge number of followers and imitators enter the market and want to occupy a piece of cake. It implies that nodes with a medium and small number of degrees gradually dominate the network. However, the situation can not last long because of the “winners-take-all” principle in Web economic. As the market scale is widening day by day, market resources are limited. For increasing competition and bursting of bubble, many websites collapsed. Market becomes centralized again. In summary, the model reveals a “bubble-stable” evolutionary process which is correspondent with the real e-commerce market evolutionary process observed.
5. Conclusion
The research field of e-commerce ecosystem network structure is a multi-disciplinary challenge intersected by ecology, marketing, economy, social science and network science. We believe that a systematic and prefect analysis framework will lead to further research that will reveal the hidden mechanism of economic and social system and will also enrich the system science.
In this paper, we establish a new theoretical and methodological model based on ecosystem theory and network science for analysis on e-commerce market structure. The model
considers 3 steps for explaining the structure—element identification, relationship analysis
and formation mechanism. Then, several suggestive applications based on the analysis model are shown, including an empirical analysis case of static structure, a case of degree centrality analysis, a case of group finding, a dynamic analysis case of clustering coefficient and a modified BA model for B2C e-commerce network. The model is an open framework which should keep being constantly improved in future.
Acknowledgements
This work was supported by Beijing Jiaotong University PhD Innovation Research Fund (NO. 2012YJS048).
References
[1] R. Albert, H. Jeong and A. L. Barabasi, “Diameter of the World Wide Web”, Nature, vol. 401, (1999), pp. 130-131.
[2] A. L. Barabasi and R. Albert, “Emergence of scaling in random networks”, Science, vol. 206, (1999), pp. 506-509.
[3] H. K. Bhargava and V. Choudhary, “Economics of an information intermediary with aggregation benefits”, Information Systems Research, vol. 15, no 1, (2004),pp. 22-36.
[4] Y. L. Cai, W. D Wang, X. Y. Gong, Y. H. Li, C. F. Chen and J. Ma, “Mobile e-commerce model based on social network analysis”, Journal of China University of Posts Telecommum, vol. 15, (2008), pp. 79-83.
[5] E. E. Grandon, S. A. Nasco and P. P. Mykytyn Jr., “Comparing theories to explain e-commerce adoption”, Journal of Business Research, vol. 64, no. 3, (2011), pp. 292-298.
[6] V. Grover, P. Ramanlal and A .H. Segars, “Information exchange in electronic markets: implications for market structures”, International Journal of Electronic Commerce, vol. 3, no. 4, (1999), pp. 89.
[7] B. Hannon, “The use of analogy in biology and economics – From biology to economics, and back”, Structural Change and Economic Development, vol. 8, no. 4, (1997), pp. 471-488.
[8] M. Iansiti and R. Levien, “The Keystone Advantage: What the New Dynamics of Business Ecosystems Mean for Strategy, Innovation, and Sustainability”, Harward Business School Press, (2004).
[8] IRESEARCH, “2011 Top30 of B2C Online Retailers in China”, Avaliable at
http://www.iresearch.com.cn/Report/view.aspx?Newsid=170217, (2011).
[9] X. Q. Jing and J. H. Xie, “Group buying: a new mechanism for selling through social interactions”, Management Science arch, vol. 57, no. 8, (2011), pp. 1354-1372.
[10] Z. Katona, P. P. Zubcsek and M. Sarvary, “Network effects and personal influences: The diffusion of an online social network”, JMR, vol. 48, no. 3, (2011), pp. 425-443.
[11] R. Lewin, “Complexity: Life at the Edge of Chaos”, The University of Chicago Press, (2000).
[12] R. D. Luce and A. D. Perry, “A method of matrix analysis of group structure”, Psychometrika, vol. 14, no. 1, (1949), pp. 95-116.
[13] M. E. J. Newman, “The structure and function of complex networks, SIAM Review, vol. 45, no. 2, (2003), pp. 167-256.
[14] C. H. Piao, X. F. Han and H. Wu, “Research on e-commerce transaction networks using multi-agent modeling and open application programming interface”, Enterprise Information System vol. 4, no. 3, (2010), pp. 329-353.
[15] A. Q. Shen and N. Sundaresan, “Bay: an e-commerce marketplace as a complex network”, Proceedings of the fourth ACM international conference on Web search and data mining, (2010), pp. 655-664.
[16] L. A. West Jr., “Electronic markets and electronic governments”, International Journal of Electronic Commerce, vol. 2, no. 2, pp. 5.
[17] B. Xiao and I. Benbesat, “Product-related deception in e-commerce: a theoretical perspective”, Market Science, vol. 35, no. 1, (2011), pp. 169-196.