Variation of activity concentration of radon decay
products in the Curonian Spit
Dainius Jasaitis*, Asta Daunaravičienė, Aloyzas Girgždys Department of Physics,
Vilnius Gediminas Technical University, Saulėtekio 11,
LT-10223 Vilnius, Lithuania
* Corresponding author. E-mail: dainius.jasaitis@vgtu.lt
Variation of radon decay products activity concentration on the ground level of the atmosphere has been researched in the Curonian Spit. The influence of meteoro-logical parameters on variation in these pollutants has been estimated. During the measurement period, activities concentration of radon short-lived decay products varied from 2 to 16 Bq/m3 and values of activity concentration measured during day and night varied from 5 to 7 times. The investigation data showed that mete-orological parameters as temperature, relative humidity, wind speed and direc-tion had great influence on radon decay products activity concentradirec-tion. Negative corelation (–0.77) between radon decay products activity concentration and the temperature and positive correlation (0.8) with the relative humidity was deter-mined. It has been observed that variations of activity concentration of radon de-cay products were influenced by the periodically varying wind direction – breeze, a phenomenon which rarely occurs in the region of the Baltic Sea.
Key words: radon decay products, activity concentration, meteorological para-meters, the Curonian Spit
INTRODUCTION
Radon (222Rn) is radioactive scentless and color-less inert gas. It is formed in the result of decay of 226Ra, which is a member of decaying chain of 238U isotope.
Radon and its decay products compose most of ionizing radiation (Girgždys, Ulevičius, 1985; Gesell, 1983). 55% of background radiation is composed of radon (222Rn) and its decay products. The average annual exposure of Lithuanian inha-bitants caused by natural sources is about 2.2 mSv, about 1 mSv is conditioned by radon and its decay products ionizing radiation (UNSCEAR, 2000). Radon is one of the main sources of radiation in the environment. Many other natural and artifi cial sources of radiation are many times lesser (Ne-dveckaitė, 2004).
The half-life of radon is 3.8 days, therefore its decay range is sufficient for gas to get to the atmos-phere from the upper layers of soil. Generally,
in-ternal exposure is influenced by short-term pro-ducts of radon decay – 218Po (half-life 3 min), 214Pb (27 min), 214Bi (20 min), 214Po (164 μs) and others. While evaluating the impact of radon short-term decay products on human health, it is important to know what amount of the decay products atoms is attached to the aerosol particles. The inhalation of radon decay products depends not only on their concentration in the air but also on the amount of the decay products attached to the aerosol par-ticles (Clavensjo et al., 1999).
Most of radon radiation and its decay products are easily absorbed by human skin surface, therefo-re human internal exposutherefo-re becomes most impor-tant, i. e. the internal exposure due to inhaled radon decay products in the organism (Hess et al., 1983; Mohammed, 1999). Being inhaled with the air filled with radon short-lived decay products, they settle and decay on breathing organs. Then the emitted alpha particles penetrate and damage the tissue. Due to that cancer of lungs or breathing organs can develop (Lubin, 2003; Ishikawa et al., 2003).
Dainius Jasaitis, Asta Daunaravičienė, Aloyzas Girgždys
406
Likewise to many other countries, in Lithuania the largest source of radon is soil (Clavensjo et al., 1999; Mastauskas, Morkūnas, 1996). There are two stages in studying radon diffusion: its emanation through pores of a solid material and its carrying by air outwards (Ackers, 1984).
When radon gets into air, gas diffuses in the atmosphere. Activity concentration of the radon decay products in the upper layer of the atmos-phere mostly depends on the radon emanation rate from the soil and the intensity of the air mixing (Girgždys, Ulevičius, 1985).
The radon concentration undergoes a typical diur nal variation over the land in case of anticyclone with a maximum during the night and a minimum in the afternoon ascribed to the formation of ther-mal inversions during the night. The trend in radon concentration distinguishes clearly between days on which there is a nocturnal accumulation of radon and days on which there is an air mixing; during these days the level of radon remains nearly con-stant night and day and the pollutants disperse high during the day and at night (Desideri et al., 2007).
Radon concentration is dominant on the ground level at night due to the decrease of vertical air mix-ing. However, it is effective only over the land, since radon gas emanates from soil where it is formed in the result of the decaying of 226Ra. Radon emanation and concentration over the water surface is very low. Therefore higher radon concentrations over the sea are found only in case of advection from the land. Typically, the concentration in soils is 105 Bq · m3
(Ghita, Vasilescu, 2011), whereas in the oceans it is only about 2 Bq · m3 (Burnet et al., 1998). Radon emanation is therefore much greater, usually by a factor 100, over the land than over the sea. The ver-tical mixing of air generally results in an additional loss of radon at sea level. However, if the upper air has come from over the land, and the lower air is purely maritime, vertical mixing may cause an in-crease in radon concentration (Whittlestone, 1985). The aim of the experiment was to establish acti- acti-vity concentration of radon progeny in the atmos-in the atmos-phere in the Curonian Spit.
MATERIALS AND METHODS
The experiment was carried out at Juodkrantė (55°32’N and 21°06’E) surroundings (the Curonian Spit) on 11–17 July, 2010. The investigations were performed in Juodkrantė location which is ~100 m from the Baltic Sea and ~1.5 km from the Curo-nian Lagoon (Fig. 1). The location is surrounded by sand dunes from the side of the Baltic Sea and by pinewoods from the side of the Curonian Spit.
Radon activity concentration and meteorological parameters in the ambient air were measured conti-nuously by averaging the data of 5 minutes (Fig. 2). Measurements were carried out applying equi-pment and method for constant measurements of radon decay products activities concentration in the air (Jasaitis, Girgždys, 2007). The measuring equipment consists of filtration device with a ra-diometer and air volume meter with a pump.
The metal frame of filtration device (340 × 230 × 220 mm) has an inlet and outlet. The diameter of the air inlet is 20 mm. The air flow rate is 40 L/min, and it is controlled by air flow meter. The air in the device frame changes within 25 seconds. The 800 W powered air pump sucks the air through filter band “Fiberglaz” with diameter of 50 mm. The air is sucked through the part of filter band which is between a suction channel and a radiometer. The band is stopped during the measurement period. When the mea-surement process is over, the band is overwound so that the “clean” (i. e. without radon progenies) part of the filter appears above the radiometer and the air suction channel of the pump. The radiation of the particles settled on the filter is mea sured with the radiometer GM-45.
The radiometer GM-45 is a light and extremely sensitive detector of the ionizing radiation. It con-tains a Geiger-Müller counter which is sensitive to alpha, beta and gamma radiation (alpha above 3 MeV, beta above 50 keV, gamma above 7 keV). The diameter of isinglass is 42 mm. The RAD (Radiation Acquisition and Display) programme is installed in the device. The usage of RAD pro-gramme enabled the data to be stored and trans-ferred into MS Excel programme for processing.
The radiometer is fixed so that the filter band through which the air is sucked moves beside the radiometer measurement window.
Electronic stopwatches TS-ED1 are set, and the time of suction and filter band turning are pro-grammed. After setting the hours when the mea-surements are automatically carried out, the devi-ce can operate permanently.
The bias of radon short-lived decay products measuring method was evaluated. It depends on the efficiency changes of the filter band, the speed of air flow through it, exposition time and the con-centration of progeny in the air. The established bias was not higher than 6%.
During the study the meteorological parameters (temperature, relative humidity, wind speed and di-temperature, relative humidity, wind speed and di-rection) were measured by PC Radio Weather Sta-tion. The temperature in the rangefrom –30.0 °C to +70 °C is measured with accuracy of ±1 °C, wind speed in the interval 0–60 m/s is measured with accuracy ±0.3 m/s and wind direction resolution is 5 degrees. The sensors of temperature, relative humidity, wind speed and direction were located about 100 m from the Baltic Sea. Temperature and relative humidity, wind speed and direction were measured in the height of 3.5 m from the ground. Outdoor relative humidity range was from 20% to 100%, resolution – 1%. Atmospheric pressure: the range for absolute pressure from 800 hPa to 1 100 hPa, resolution 1 hPa, accuracy ±1 hPa.
Activity concentration of radon decay products and all information from the Weather Station are automatically sent and recorded to the computer.
Fig. 2. Measurement scheme: 1 – computer, 2 – filtration device, 3 – filter band,
4 – radiometer, 5 – air volume meter, 6 – air pump, 7 – stopwatches, 8 – weather station
Dainius Jasaitis, Asta Daunaravičienė, Aloyzas Girgždys
408
RESULTS AND DISCUSSION
During the first and latest days of the experiment the territory of Lithuania was influenced by anti-cyclone. The temperature varied from 20 to 38 °C, and relative humidity – from 25 to 100%.
During the experiment low-speed winds domi-nated, and the wind speed higher than 5 m/s was recorded only for 2% of the entire observation time (Fig. 3). During the experiment a long pe- During the experiment a long pe-During the experiment a long pe-riod of calm (11%) was recorded, and 15% of the
observation time when the wind speed was lower than 1 m/s was also fixed. Usually, the wind direc-tion from the sea is most common, while the wind from the continent is significantly less frequent, i. e. approximately several times (Girgždienė, Girgždys, 2001). However, the non-typical situa- However, the non-typical situa-However, the non-typical situa-tion in respect of wind dominated during our ex-periment. During the research, the wind from the Curonian Spit, i. e. south-east and east (39% and 18% of the observation time, respectively) were measured, while winds from the Baltic Sea (west-north) were observed relatively seldom (30% of the time).
During the measurement period, activity con-centration of radon short-lived decay products varied from 2 to 16 Bq/m3. The measured ave rage activity concentration of radon decay products was 7 Bq/m3 (Fig. 4).
Figure shows that the increase of temperature causes the decrease in the amount of radon short-lived decay products. The increase of the activity concentration of the radon decay products early in the morning is described by the corelation of the emanation increase during the night with the de-creasing temperature. Negative corelation between radon short-lived decay products activity concent- concent-ration and the temperature was determined (–0.77). Air radioactivity starts to increase approxi-mately from 10–11 p. m. The maximum value is reached from 5 a. m. to 6 a. m. just before the sun-rise, meanwhile the minimum values are observed at about noon. This might be explained by the fact that variation in activity concentration of radon decay products is influenced by the intensity of air turbulence. In the daytime, the sun heats up the earth surface and the positive temperature gradi-ent occurs above the earth surface. In the evening, when the heat of the sun is not so effective, the positive temperature gradient is constantly shift-ing towards the negative one. A slow variation in temperature is frequent for the night period. The temperature gradient significantly decreases and is time-variable close to the surface of the ground, i. e. 0.1–0.2 metres above it. At this moment, the increase in activity concentration of radon decay products continues and reaches the maximum va-lue. After the sunrise, the air temperature is con-stantly increasing, and the temperature gradients decrease in all layers. Moreover, temperature in- Moreover, temperature in-emperature in-version is typical for this period.
Fig. 3. Percentage concentration of wind direction (a) and wind speed, m/s (b) from different sectors in Juodkrantė during the investigation period
When the weather is calm and fine, the condi-tions favourable for accumulation of the pollut-ants on the ground level of the atmosphere occur and in such cases their concentrations may signi-ficantly increase. Such conditions can occur when the weather is determined by the anticyclone (a region of high atmospheric pressure): the weather
is calm, windless and rainless. During the period of our experiment such weather dominated. Only on 15–16 July the cyclone approached the terri-tory of Lithuania (Fig. 5, marked in red).
The activity concentration of radon decay products decreased during the rainy period. This is because the radon decay products usually
Fig. 4. Time course of radon activity concentration and temperature
Dainius Jasaitis, Asta Daunaravičienė, Aloyzas Girgždys
410
associate with the aerosol particles which are al-ways present in the air and the fall washes them out from it.
An analysis of interrelations among activity concentration of radon short-lived decay pro-ducts and wind speed had been carried out. Activity concentration of radon decay products decreased with the increase of wind speed: then radon gas is more efficiently dispersed in the at-mosphere. However, it had been established that in this case the concentration of radon decay products was more influenced by wind direction (low-speed winds dominated during the experi-ment).
The impact of the wind direction on variation in activity concentration of radon decay products has been estimated (Fig. 6).
The maximum value of activity concentration of radon short-lived products had been observed when the wind blew from the continent, and the minimum value has been observed when the wind blew from the sea. This shows soil being the largest source of radon, as is the case in Lithuania and other countries. Therefore, when wind blows from the sea radon gas diffuses in the atmo sphere.
Following the analysis of variations in wind di-rection and speed, humidity and temperature, it had been established that during several days of the experiment, i. e. from 11 to 14 of July, the me-teorological phenomenon called breeze occurred
on the seacoast of Neringa. During this period, the variations in activity concentration of radon decay products coincided with daily periodic change of wind direction (Fig. 7).
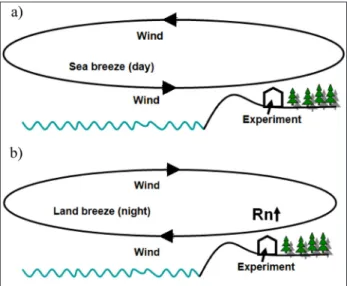
Breezes are variable winds present along coast-lines of seas, oceans, large rivers and lakes and changing their direction twice a day (Fig. 8). Dur- Dur- Dur-ing daylight hours, the land gets heated up faster than water and a lower pressure zone forms above the land. Therefore, a daytime breeze blows from the water to the heated coast. At night, the reverse process occurs: the land gets cooled faster than the water, a high pressure zone forms above the land, thus the wind blows from the land to the water.
Local winds, i. e. breezes, are not a frequent phenomenon in the region of the Baltic Sea. The processes of global air mass transports mostly override their action. Breezes may form on the Baltic seashore under the condition of anticyclone when the wind is weak. In such a way, a particu- In such a way, a particu-In such a way, a particu-lar air circulation occurs: the wind blows from the coast or to the coast on the ground level, while its direction in the higher layers of the atmosphere is reverse. Breezes may occur along the coastline of several up to several dozens kilometres depend-ing on the temperatures differences between the heated and cooled surface of the sea and the land. Thus, variation in radon concentrations on 11–14 of July may be explained by the effect of breeze on their production.
Meteorological situation also influences the activity concentration of radon and its short-lived products, therefore a direct relation exists between activity outdoor and indoor. There were permanent measurements done outdoor and indoor of the buildings (Porstendorfer et al., 1994). It was deter-mined that given a low air turbulency, the maxi-mum of the radon activity concentration outdoor was observed, which had an impact on forming of the radon activity concentration maximum indoor.
By some other authors (Girgždys et al., 1988; Desideri et al., 2007) activity concentration of the radon and the concentration of the ozone were
measured simultaneously. It was determined that with cloudless air the correlation coeficient of these measures often exceeded 0.86 and that this is related to the fact that vertical flows of the radon and ozone near the ground are inverse.
CONCLUSIONS
1. It has been found that meteorological parame-ters as temperature, relative humidity, atmosphe-ric pressure had most important influence on the activity concentration of radon decay products. 2. The measurements of the activity concentra-tion of radon decay products gave the possibility to identify the presence of a breeze phenomenon on the Curonian Spit in summer during extreme weather events.
3. The evident influence of the wind direction on the time course of activity concentration of radon decay products was estimated under the coastal conditions.
Received 8 October 2012 Accepted 10 December 2012
REFERENCES
1. Ackers J. G. 1984. Direct measurement of radon exhalation from surfaces. Radiation Protection Dosimetry. Vol. 7(1–4): 199–201.
2. Burnett B., Nelson T., Corbett R., Robinson L., Weaver J., McKisson J. E., Lane-Smith D. 1998. Fig. 8. Breeze circulation scheme: a) daytime, b) night
Dainius Jasaitis, Asta Daunaravičienė, Aloyzas Girgždys
412
Improvements in the Measurement of Rn-222 in Natural Waters. The 44th Annual Conference on Bioassay, Analytical, and Environmental Radiochemistry, Albuquerque, New Mexico, November 15–20.
3. Clavensjo B., Akerblom G., Morkūnas G. Radonas patalpose. Jo kiekio mažinimo būdai. Vilnius: Litima; 1999.
4. Desideri D., Roselli C., Meli A., Feduzi L. 2007. Comparison between diurnal trends of ozo-ne amd radon gas concentrations measured at ground in the semi-rural site of Central Italy. Journal of Radioanalytical and Nuclear Chemistry. Vol. 273(2): 345–351.
5. Gesell T. F. 1983. Background atmospheric 222Rn
concentrations outdoors and indoors: a review. Health Physics. Vol. 45(2): 289–302.
6. Ghita I. A., Vasilescu A. 2011. Radon assess-ment with solid-state nuclear track detectors in Bucgarest and its sussoundind region. Romanian Reports in Physics. Vol. 63(4): 940–947.
7. Girgzdiene R., Girgzdys A. 2001. The influence of wind parameters on the ozone concentration va-riation on the Baltic Sea coast. Environmental and Chemical Physics. Vol. 23(3–4): 112–117.
8. Girgždys A., Girgždienė R., Balsys A. 1988. Ozon i radon v priziemnom sloe atmosfiery. Fizika atmosfiery. N 12: 68–75.
9. Girgždys A., Ulevičius V. 1985. The concentration of radon and its short-term decay products in the air. Atmospheric Enviroment. Vol. 985: 28–33. 10. Hess C. T., Weiffenback C. V., Norton S. A. 1983.
Environmental radon and cancer correlations in Maine. Health Physics. Vol. 45(2): 339–348. 11. Ishikawa T., Yamada Y., Fukutsu K., Tokonami S.
2003. Deposition and clearance for radon pro-geny in the human respiratory tract. Radiation Protection Dosimetry. Vol. 105(1–4): 143–148. 12. Jasaitis D., Girgždys A. 2007. Hourly measurement
method for radon progeny volumetric activity in air. Journal of Environmental Engineering and Landscape Management. Vol. 15(3): 158–165. 13. Lubin J. H. 2003. Studies of radon and lung cancer
in North America and China. Radiation Protection Dosimetry. Vol. 104(4): 315–319.
14. Mastauskas A., Morkūnas G. 1996. Problem of indoor radon in Lithuania. Health Physics. Vol. 70(6): 581.
15. Mohammed A. 1999. Activity size distributions of short-lived radon progeny in indoor air. Radiation Protection Dosimetry. Vol. 86(2): 139–145. 16. Nedveckaitė T. Radiacinė sauga Lietuvoje. Vilnius:
Kriventa; 2004.
17. Porstendorfer J., Butterweck G., Reineking A. 1994. Daily variation of indoor radon concen-tration indoors and outdoors and the influence of meteorological parameters. Health Physics. Vol. 67(3): 283–287.
18. UNSCEAR. Report to the General Assembly. Annex B: Exposures from natural radiation sour-ces. United Nations, New York; 2000.
19. Whittlestone S. 1985. Radon measurements as an aid and interpretation of atmospheric monitoring. Journal of Atmospheric Chemistry. Vol. 3(1): 187– 201.
Dainius Jasaitis, Asta Daunaravičienė, Aloyzas Girgždys
RADONO SKILIMO PRODUKTŲ TŪRINIO AK-TYVUMO KAITA KURŠIŲ NERIJOJE
Tirta radono skilimo produktų tūrinio aktyvumo kaita atmosferos priežemio sluoksnyje Kuršių nerijoje. Vertin-tas meteorologinių parametrų poveikis šių teršalų kaitai. Matavimo laikotarpiu radono trumpaamžių ski limo produktų tūrinis aktyvumas kito nuo 2 iki 16 Bq/m3,
o išmatuotos tūrinių aktyvumų vertės dienos ir nakties metu skyrėsi nuo 3 iki 10 kartų. Nustatyta, kad meteo-rologiniai parametrai – temperatūra, santykinis oro drėgnis bei vėjo kryptis ir greitis – daugiausia nulemia radono skilimo produktų kaitą atmosferos priežemio sluoksnyje. Gauta neigiama koreliacija (–0,77) tarp radono skilimo produktų ir temperatūros bei teigia-ma koreliacija (0,8) tarp radono skilimo produktų ir santyki nio oro drėgnio. Pastebėta, kad radono skilimo produktų tūrinio aktyvumo pokyčius nulėmė periodiška vėjo krypties kaita – brizas, retas reiškinys Baltijos jūros regione.
Raktažodžiai: radono skilimo produktai, tūrinis ak-tyvumas, meteorologiniai parametrai, Kuršių nerija