AB
User Manual
www.autem.de
PLC-ANALYZER pro 5
The logic analyzer for
programmable logic controls
00
MW
E
1
25,753 30,055
User Manual
PLC-ANALYZER
pro
5
Copyright 1995 - 2011 AUTEM GmbH. All rights reserved. No part of this user manual, including excerpts, may be reproduced, photocopied or electronically stored without the expressive written permission of AUTEM. The software described in this manual is subject of a software license agreement and may only be used according to the terms of this agreement.
AUTEM GmbH Dithmarscher Straße 29 D-26723 Emden Germany Telephone +49 (0)4921 9610-0 Telefax +49 (0)4921 9610-96 Email [email protected] Web www.autem.de
AUTEM does not give any warranty for this manual as well as no express or tacit warranties on commercial quality and suitability for a particular use. AUTEM does not take over adhesion for errors contained in it or for damages that may occur as a result of using or applying this material.
The soft and hardware designations mentioned in this book are in most cases also registered trade marks and are subject to the legal regulations as such.
For references, suggestions and improvement suggestions we are always grateful. Please send these to AUTEM.
1st Edition 2011
Table of contents iii
Table of Contents
1 INTRODUCTION 1-1
1.1 Overview 1-1
1.2 Fields of application PLC-ANALYZER pro 1-2
1.3 Technical features 1-3
1.4 Typical operation 1-4
1.5 Help 1-4
1.6 Technical Support 1-4
2 INSTALLATION 2-1
2.1 Hardware and software requirements 2-1
2.2 Installation 2-1
2.3 Installation of additional licenses, upgrades 2-2
2.4 Uninstallation 2-3
2.5 Starting the program 2-4
3 CONFIGURATION 3-1 3.1 PLC driver 3-1 3.2 Options 3-2 3.2.1 Signals 3-3 3.2.2 Directories 3-4 3.2.3 Language 3-5 3.2.4 Toolbars 3-5 3.3 Tools 3-7 4 DATA ACQUISITION 4-1 4.1 Address selection 4-1
4.1.1 Use of PLC symbol files 4-3
4.1.2 Pseudo signals 4-3
4.1.3 Address sets 4-4
4.1.4 Assign given addresses to other drivers 4-4
4.2 Online signal selection 4-4
4.2.1 Define online window 4-5
4.2.2 Choose addresses for online display 4-5
4.3 Trigger 4-6
4.3.1 AND / OR combination of trigger signals 4-7
4.3.2 Trigger on bit signals 4-7
4.3.3 Trigger on analog signals 4-8
4.3.4 Trigger action 4-11
4.3.4.1 Activate and deactivate address sets and trigger (cascading) 4-11
4.3.4.2 Send an E-Mail 4-12
4.3.4.3 Send an SMS 4-12
4.3.4.4 Acoustic signaling 4-12
4.4 Scaling of register values 4-13
4.5 Modes of data acquisition 4-14
4.5.1 Cycle-precise acquisition 4-15
4.6 Starting data acquisition 4-15
5 SIGNAL DISPLAY AND ANALYSIS 5-1
5.1 Opening a signal file 5-1
5.2 Signal selection 5-2
5.3 Signal Scaling of register values 5-3
5.4 Signal cursor 5-3
Table of contents iv
5.5.1 Absolute and relative time display 5-4
5.5.2 Setting the time base 5-4
5.5.3 Time measurement 5-4
5.5.3.1 Time difference measurement 5-5
5.5.3.2 Bit measurement 5-5
5.6 Search functions 5-6
5.6.1 Find trigger 5-6
5.6.2 Find time 5-6
5.6.3 Find bit pattern 5-7
5.6.4 Find analog value 5-7
5.6.5 Find edge 5-8
5.6.6 Find note 5-8
5.7 Adapting signal display 5-9
5.7.1 Moving of signals 5-9
5.7.2 Change signal color 5-9
5.7.3 Insert notes 5-9
5.7.4 Changing symbol addresses and symbol comments 5-9
5.7.5 Mark area 5-10
5.8 Signal file comparison 5-10
5.9 Signal statistics 5-11
5.10 Project info 5-13
5.11 Saving a signal file 5-13
5.11.1Saving an extract 5-13
5.12 Printing a signal file 5-13
5.13 Exporting of signal files 5-15
5.13.1Export as a graphic (bitmap) 5-15
5.13.2Export as a HTML-Site 5-15
5.13.3Exporting signal files as a text 5-16
5.13.4Graphical evaluation of signal data in Microsoft® Excel® 5-16
5.14 Import of signal files 5-18
6 PLC-PROCESS DATA RECORDING AND REMOTE SERVICE 6-1
6.1 BLACKBOX 2 for PLC-ANALYZER 6-1
6.2 BLACKBOX - fields of application 6-2
6.3 Remote service with the BLACKBOX 6-2
7 DRIVER ADDENDUM SIEMENS SIMATIC S7 7-1
7.1 Installation 7-1
7.1.1 Installing additional hardware 7-1
7.1.2 Installing additional software 7-1
7.2 Configuring the PLC driver 7-2
7.3 Data acquisition 7-3
7.3.1 Supported PLC models and CPUs 7-3
7.3.2 Recordable PLC addresses 7-3
7.3.3 Number of recordable addresses 7-4
7.3.4 Time behavior and particularities 7-4
7.4 Cycle-precise acquisition 7-5
7.4.1 Installation of additional software 7-5
7.4.2 Installation of additional Hardware 7-5
7.4.3 Configuration of PLC-driver for cycle-precise acquisition 7-5
7.4.4 Input of addresses 7-7
7.4.5 Start acquisition 7-7
7.4.6 Particularities in signal display and analysis 7-9
8 DRIVER ADDENDUM SIEMENS SIMATIC S5 8-1
8.1 Installation 8-1
Table of contents v
8.1.2 Installing additional software 8-1
8.2 Configuring the PLC driver 8-2
8.3 Data acquisition 8-3
8.3.1 Supported PLC models and CPUs 8-3
8.3.2 Recordable PLC addresses 8-4
8.3.3 Number of recordable addresses 8-5
8.3.4 Time behavior and particularities 8-5
8.4 Cycle-precise acquisition 8-6
8.4.1 Address entry 8-6
8.4.2 Trigger condition entry 8-6
8.4.3 Start acquisition 8-6
8.4.4 Particularities of signal display and analysis 8-9
9 APPENDIX A - FREQUENTLY ASKED QUESTIONS (FAQ) 9-1 10 DRIVER APPENDIX SIMOTION, PILZ, FESTO, BOSCH, CoDeSys, PHOENIX,
JETTER, B&R, MITSUBISHI, ALLEN-BRADLEY, GE Fanuc, HITACHI, OMRON, SCHNEIDER, BECKHOFF, AUTEM AD_USB-Box® ...
Table of contents vi
Table of Figures
Fig. 1-1 PLC-ANALYZER pro 5 1-1
Fig. 2-1 License-Key management 2-2
Fig. 2-2 The initial screen 2-4
Fig. 3-1 Options-menu 3-1
Fig. 3-2 Configuration of the PLC driver 3-1
Fig. 3-3 Selecting the PLC driver 3-2
Fig. 3-4 Setting signal options 3-3
Fig. 3-5 Selecting the standard directories 3-4
Fig. 3-6 Language selection 3-5
Fig. 3-7 Configuring toolbars 3-6
Fig. 3-8 Tools menu 3-7
Fig. 4-1 Definition of a new project 4-1
Fig. 4-2 Entering signals to acquire 4-2
Fig. 4-3 Generate pseudo signals 4-4
Fig. 4-4 Selecting signals for online display 4-5
Fig. 4-5 Entering trigger conditions 4-6
Fig. 4-6 Entering the trigger value of a bit signal 4-8
Fig. 4-7 Entering trigger value of an analog signal 4-8
Fig. 4-8 Principles of analogue triggering ( < , > , = , <> ) 4-10
Fig. 4-9 Setting trigger properties 4-11
Fig. 4-10 Register scaling for online display 4-13
Fig. 4-11 Setting the acquisition mode 4-14
Fig. 4-12 Signal acquisition with graphics and text online window 4-16
Fig. 5-1 Opening a signal file 5-1
Fig. 5-2 Signal file display 5-2
Fig. 5-3 Time information 5-4
Fig. 5-4 Activated time difference measurement 5-5
Fig. 5-5 Find trigger 5-6
Fig. 5-6 Find time 5-6
Fig. 5-7 Find bit pattern 5-7
Fig. 5-8 Searching for an analog value 5-7
Fig. 5-9 Find edge 5-8
Fig. 5-10 Find note 5-8
Fig. 5-11 Signalinfo 5-9
Fig. 5-12 Signal file comparison 5-10
Fig. 5-13 Signal statistics 5-11
Fig. 5-14 Signal statistics - register values 5-12
Fig. 5-15 Printer selection window 5-13
Fig. 5-16 Printout of a signal file (not to scale) 5-14
Fig. 5-17 Export in ASCII format 5-15
Fig. 5-18 Example of an exported signal file (extract) 5-16
Fig. 5-19 Logarithmic representation of PLC analog signals with Excel® 5-17
Fig. 5-20 3D representation of PLC analog values with Excel® 5-17
Fig. 5-21 Discrete signals with Excel® 5-17
Fig. 5-22 Importing Data 5-18
Fig. 6-1 BLACKBOX 2 6-1
Fig. 7-1 Settings PLC driver (SIMATIC S7) 7-2
Fig. 7-2 Driver settings for cycle-precise driver (SIMATIC S7) 7-6
Fig. 7-3 Message before modifications in the PLC for pre-setting "With PLC safety stop" 7-8 Fig. 7-4 Message before modifications in the PLC for pre-setting "No PLC safety stop" 7-8 Fig. 7-5 Message before modifications in the PLC for pre-setting "With PLC safety stop" 7-9 Fig. 7-6 Message before modifications in the PLC for pre-setting "No PLC safety stop" 7-9
Fig. 8-1 Driver settings (SIMATIC S5) 8-2
Table of contents vii
Fig. 8-3 Message before modifications in the PLC for pre-setting "No PLC safety stop" 8-7
Fig. 8-4 Cycle-precise acquisition status 8-8
Fig. 8-5 Message before modifications in the PLC for pre-setting "With PLC safety stop" 8-9 Fig. 8-6 Message before modifications in the PLC for pre-setting "No PLC safety stop" 8-9
List of Tables
Table 3-1 Toolbar icons 3-7
Table 4-1 Address syntax SIMATIC S7 4-3
Table 4-2 Saving behaviour at trigger recording 4-7
Table 4-3 Trigger operator 4-9
Table 4-4 Modes of data acquisition 4-15
Table 5-1 Use of the keyboard 5-3
Table 5-2 Statistical evaluation of a bit address 5-12
Table 5-3 Statistical evaluation of a register address 5-12
Table 7-1 Address syntax SIMATIC S7 7-3
Table 7-2 Time stamp settings 7-6
Table 8-1 Overview of the supported SIMATIC S5 models 8-3
Table 8-2 Address syntax SIMATIC S5 8-4
Introduction 1-1
1
Introduction
Welcome to the new PLC-ANALYZER pro 5, the software logical analyzer, that gives you val-uable help in solving automation problems.
The program is very easy and intuitive to use. Nevertheless please read through the manual in order to familiarize yourself with the numerous applications of PLC-ANALYZER pro.
This manual informs you about installation, operation, and application areas of this program.
Fig. 1-1 PLC-ANALYZER pro 5
1.1
Overview
PLC-ANALYZER pro is a software tool for logic analysis and registration of measured values on equipment operated with a PLC (Programmable Logic Controller). PLC signals of all kinds can easily be collected, displayed and evaluated. Among others, these signals include inputs and outputs, flags, timers, counters and data words.
Equipped with the capability of a traditional logic analyzer, PLC-ANALYZER pro normally requires no software or hardware modification of the PLC for the capturing signal data. This is
Introduction 1-2
the result of using the existing PLC protocol for data acquisition, whereby PLC-ANALYZER pro simply uses the typical hookup of programming units via serial connection or automation network. A to the PLC connected programming device (PC) can be used directly for data acqui-sition without further modification.
With PLC-ANALYZER pro the user is also able to record all internal PLC signals, e. g. flags or timers, which are normally not accessible from outside the PLC.
Additionally by using the special measurement interface AD_USB-Box®, external voltage and current signals, which are not available in the PLC, can also be recorded.
In this manual the MPI/PPI/PROFIBUS driver for Siemens SIMATIC S7 was selected in order to demonstrate the program operation. The essential facts apply also to all other available PLC drivers, e.g. the ETHERNET driver for Siemens SIMATIC S7 or the AS511 driver for Siemens SIMATIC S5. You will find specific comments on the characteristics of other PLC drivers in the corresponding driver addendum. It is important that you read through the appropriate driver addendum before using a PLC driver. Please pay attention to the highlighted warnings on possi-ble dangers associated with the use of PLC-ANALYZER pro.
!
WARNING Errors that may occur in the automated device endangering humans or causing large-scale material damages must be prevented by additional external precautions These precautions (e.g. independent limit monitors, mechanical interlocks) must guarantee safe operation, even in a case of dangerous errors.1.2
Fields of application PLC-ANALYZER pro
Fault analysis in PLC systems
Finding and localizing sporadic errors
Analysis and optimization / cycle time reduction
Short-term and long-term registration of measured values
Documentation and support for your quality assurance system, e.g. QA, TPM/ OEE1
Installation, maintenance, development, training
1
Introduction 1-3
1.3
Technical features
Data acquisition via the PLC programming unit interface or automation network /fieldbus
Acquisition of input, output, flags, timers, counters, peripheral, data words, data block, etc.2
Signal display in bit, byte, word or double word formats
Creating of pseudo signals
Adding of additional addresses or trigger conditions while recording
Simultaneous acquisition on several PLC systems (e.g. SIMATIC S7 + S5 or SIMATIC S7 + Allen-Bradley ...)
Software solution, no additional hardware necessary
No modifications in the PLC program necessary3
Cycle-precise acquisition for SIMATIC controls
Recording of the signal waveform on hard disk
Trigger-controlled creation of signal files or continuous recording
Time controlled signal recording
Online signal display (similar to an oscilloscope)
Comfortable definition of trigger per drag & drop
Substantial trigger features with an and-/or linkage and cascading
Pre-trigger and post-trigger time can be set by user
Start- and stop-trigger
Trigger on binary and register value
Automatic alarm in case of trigger event (E-Mail or send SMS, acoustic announcement)
Comparing signal files
Search for trigger, edge, bit pattern, time and advices over several signal files
Relative and absolute data time
Flexible register scaling and conversion to physical units
Use of symbolic address names and comments from the PLC programming software
Project files for pre-configuring and automating data acquisition runs
Printout and storage of project settings for documentation of measurements
Printout of signal files
Export of signal files as image format, text (CSV / Excel) or HTML-file
Import of measured values in text format (CSV)
Multilingual (German, English, French)
S7-PLCSIM supporting
AD_USB-Box® (optional): Recording of external voltage and current by means of external
box, which will be connected to the USB-Port
BLACKBOX (optional): Ultra compact Mini-PC for installation in switching cabinet,
long-term recording of measured values over several years.
Available PLC-Driver: Siemens SIMATIC S7 / C7 / M7, SAIA xx7, VIPA, SIMATIC S5,
Siemens LOGO!, SINUMERIK, SIMOTION, BOSCH, CoDeSys, PILZ, Phoenix, Jetter, Allen-Bradley, GE Fanuc, HITACHI, OMRON, Mitsubishi, Schneider, AUTEM AD_USB-Box®, Beckhoff TwinCat a.o.
2
Varying terminology and restrictions possible according to PLC model 3
Introduction 1-4
1.4
Typical operation
A typical control expiration of the PLC-ANALYZER pro looks as follows:
Connect PC with the PLC programming unit interface
Select signals to record
Select signals to be displayed on the screen
Set trigger combinations to freeze the data being recorded
Start data recording
End data recording
Evaluate and analyze recorded signals in a graphical display
Use recorded signals to calculate the time intervals
1.5
Help
You have access to a convenient online help for PLC-ANALYZER pro. To activate help just select the menu item Help topics in the help menu. A help window appears with important in-formation and comments on program operation.
If you need detailed help on a specific window, simply press the F1 key when the window is active. Direct help on individual dialog elements can be obtained by positioning the mouse over the element and clicking the right mouse key.
1.6
Technical Support
If you have problems while using PLC-ANALYZER, first try the online help or have a look at the specific pages of this manual. There is a FAQ list at our Web site http://www.autem.de
containing answers to frequently asked questions.
Please contact our technical department for support, if you cannot solve the problem.
Technical support AUTEM:
Tel. (+49) (0)4921-9610-0 Fax (+49) (0)4921-9610-96 Email [email protected]
Introduction 1-5
In case you need assistance from our technical department the following information needs to be at hand:
Exact error description
Version- and serial number of PLC-ANALYZER pro
Model and exact type description of the PC or programming unit, release number
Amount of memory (RAM) and free space on the hard disk
Exact version of operating system (e.g. Windows XP - ServicePack2)
PLC model and CPU type (e.g. SIMATIC S7-300 / CPU 314) and release number
NOTEDon’t forget to register the software with the enclosed recording form. As a regis-tered user you are eligible to receive new information and updates about your product.
Installation 2-1
2
Installation
2.1
Hardware and software requirements
To operate PLC-ANALYZER pro the following system configuration is necessary:
PC with 1 GHz
Microsoft® Windows 98SE/2000/XP/Vista/7
256 MB RAM
ca. 100 MB of available hard-disk space
Depending on the PLC driver, additional requirements may have to be met by the computer such as the installation of a network card and supplementary device drivers. In this case please read through the chapter Installation in the corresponding driver addendum.
2.2
Installation
Install the PLC-ANALYZER pro on your PC:
Insert the CD of PLC-ANALYZER pro in your CD-drive
Click on the Windows Start button on the task bar
Select the menu item Run
Search for SETUP.EXE on CD and start the installation program with OK
After the installation program starts, several dialog windows appear in which you are asked to make settings. Simply follow the instructions of the installation program.
After successful installation, the licenses has to be activated. Insert the USB License-Key Dongle into a free USB port of your PC and click the button “Activate licenses now”. The
License Management will start immediately.
NOTEIt is possible to activate the licenses after the installation. Therefore start the License Management of PLC-ANALYZER pro 5.
Installation 2-2
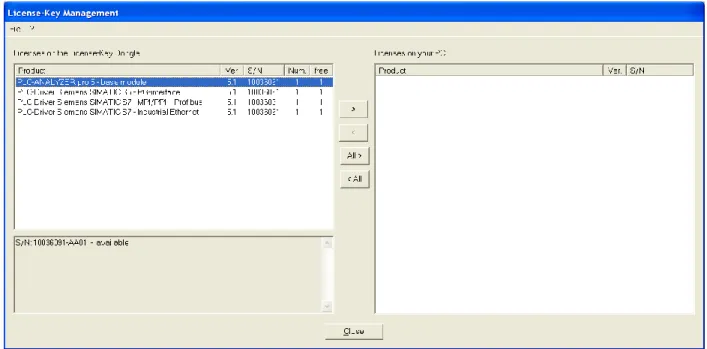
Fig. 2-1 License-Key management
Select those licenses from the list Licenses on this License-Key Dongle you want to install on your PC. Press and hold the button <Ctrl>, if you want to select several licenses. Then press the button > to transfer the selected licenses to your PC.
The button All> transfers all licenses to your PC once.
!
Warning Formatting or re-installation of your hard disk causes a loss of activated license(s). Insure that all activated licenses are re-transferred to License-Key Dongle before deleting your hard disk.2.3
Installation of additional licenses, upgrades
After purchasing additional licenses or upgrades, you will get a license file (e. g. „123456.lic“). This license file contains all necessary data required to update the licenses on your USB License-Key Dongle.
Start the license management and choose Load Dongle-License file. Select the license file in the file selection window and press Open. After positive confirmation of the information window your licenses on the USB License-Key Dongle will be updated.
Installation 2-3
2.4
Uninstallation
If you do not need a license on your PC anymore, re-transfer it to the USB License-Key Dongle. Insert the USB License-Key Dongle into a free USB port of your PC and start the License Man-agement of PLC-ANALYZER pro 5.
Select those licenses from the list Licenses on your PC you want to uninstall. Press and hold the button <Ctrl>, if you want to select several licenses. Press button < to uninstall the licenses from your PC.
The button All< uninstalls all licenses at once.
In both cases the licenses will be transferred back to the USB License-Key Dongle.
NOTEThe licenses can only be transferred back to that License-Key Dongle, from which they were installed originally. The License-Key Dongle and the license(s) to be transferred back must have the same serial number.
Installation 2-4
2.5
Starting the program
NOTEPlease make sure that time and date in your PC are set correctly. Correct the val-ues if necessary.
Start PLC-ANALYZER pro simply by a double-click on the PLC-ANALYZER pro 5 icon in the program group PLC-ANALYZER pro.
Fig. 2-2 The initial screen
After successful activation of the licenses, the above screen should appear (figure 2-2). If not, you will see a message window with the request to install the correct licenses.
After you have successfully installed PLC-ANALYZER pro, you have to make several appro-priate basic settings in the program. You will find a detailed description on the settings in the next chapter.
Configuration 3-1
3
Configuration
Before you can start to acquire and analyze data, you must configure PLC-ANALYZER pro. The general settings are performed in the menu item Extras. Choose an adequate PLC driver and configure the program under Options according to your guideline. During installation the program was already pre-configured according to your specifications.
The options set are saved when exiting PLC-ANALYZER pro. The saved options are automati-cally set when starting the program again.
NOTEAll options are also saved in the project files.
3.1
PLC driver
Fig. 3-2 Configuration of the PLC driver
In the window Extras - PLC driver all PLC drivers that have already been loaded are listed. You can select further PLC drivers with Add and define the necessary attributes for communication.
Configuration 3-2
In Fig. 3-3 the selection window for loading a PLC driver is shown with all available drivers listed. In case the de-sired driver is not on the list, the driver license has to be installed via the Li-cense-key management (see also chap-ter 2-2 Installation).
Select a driver and click on the Add
button, in order to load it.
After loading the desired drivers set all important parameters of the selected PLC driver with Properties you will find a description of these parameters in the corresponding driver addendum under Configuring the PLC driver. Already loaded PLC drivers can be removed from the list of the loaded drivers with Delete.
NotePLC-ANALYZER pro can load the same or different PLC-drivers more than once. E. g. to acquire signal data from two different SIMATIC S7 controls via Ethernet, simply load PLC-driver for S7 - TCP/IP twice and parameterize both accordingly (TCP/IP address etc.).
To acquire signal data from a SIMATIC S7 and a SIMATIC S5 simultaneously, just load the PLC-driver SIMATIC S7 and the PLC-driver SIMATIC S5.
3.2
Options
Under Options PLC-ANALYZER pro can be configured according to your conception. Your configuration settings are stored and will be used when the program is restarted.
Configuration 3-3
3.2.1 Signals
Under Signals you set the signal display and the scope of signal-information.
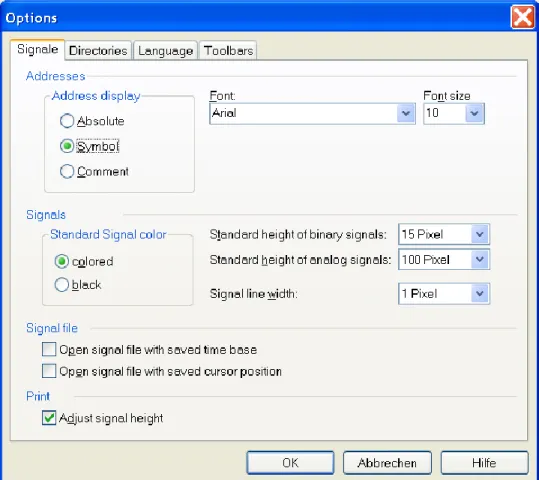
Fig. 3-4 Setting signal options
Select under Address display the display for the address indication. Here you have the choice to select besides the absolute display also symbolic or comment. In order to do so it is necessary, that a symbol file has been loaded (see also Driver-Addendum). The desired font and font size can also be set.
Under Standard Signal Colour the signal display can be set. By choosing the option colored
each address type (input, output, flag, etc.) will be displayed in a different colour. By choosing the option black all signals to be displayed are shown in black. The signal colour can be changed at any time.
The Standard height of binary signals, the Standard height of analogue signals as well as the
Signal line width can also be set.
With Signal file you can choose if the last stored cursor position and time base shall be set au-tomatically.
By selecting the control field Adjust signal height, the height of the PLC signals will be chosen automatically so that all signals can be printed on one page.
Configuration 3-4
3.2.2 Directories
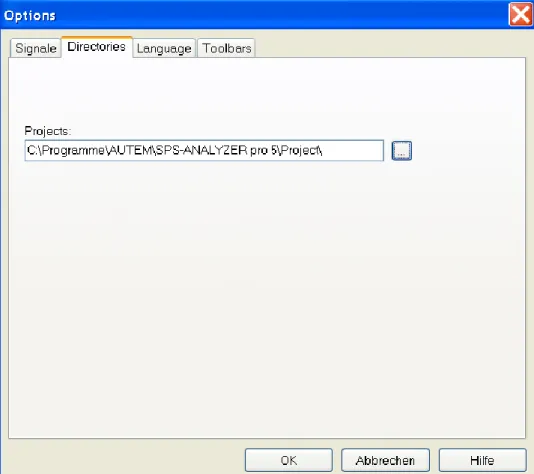
Now the standard directory path for project files and signal files have to be set. The PLC-ANALYZER pro works with this directory in case you don’t explicitly indicate something else.
Fig. 3-5 Selecting the standard directories
You can change the directory paths by clicking on the buttons right of the text fields.
Configuration 3-5
3.2.3 Language
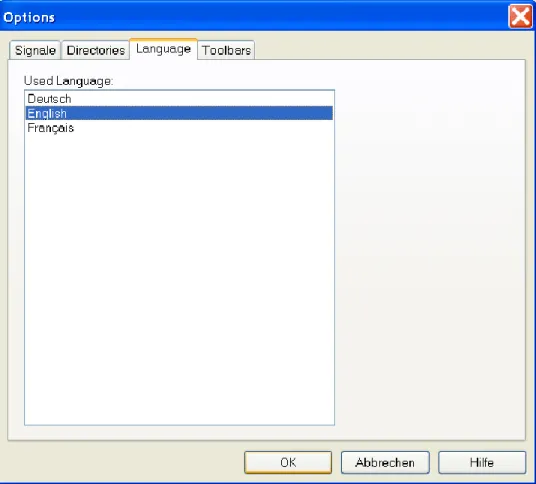
This window is used to set the menu language of PLC-ANALYZER pro. Choose a language, and then click the OK button to switch to the desired language while using PLC-ANALYZER pro.
Fig. 3-6 Language selection 3.2.4 Toolbars
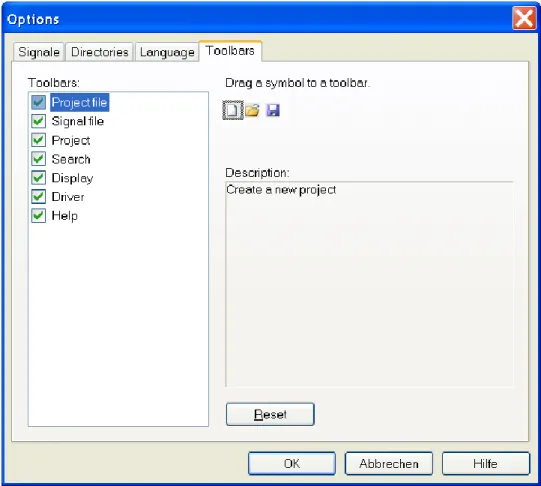
PLC-ANALYZER pro offers several toolbars enabling the user to directly select important functions through the corresponding icons4. You can configure the toolbars according to your needs on the Toolbars tab page.
4
Configuration 3-6
Fig. 3-7 Configuring toolbars
The available toolbars are listed under Toolbars. Activate the control box next to the specific corresponding name in order to visualize the toolbar.
Individual icons can be moved from the selected toolbar to another toolbar simply by dragging the desired symbol with the mouse onto the corresponding toolbar in the PLC-ANAYLZER pro main window.
Use Reset to re-establish the original state of the selected toolbar.
The following table describes the toolbar icons: Button Meaning
Creates a new project. Any open project will be closed Loads a project. Any open project will be closed Stores the current project
Loads a signal file
Stores the active signal file under its current name
Exports the current signal file as a graphic, a text or a HTML-page Compares two signal files with each other
Activates a time difference measurement Activates bit measurement
Configuration 3-7
Button Meaning
Stores a selected range of the active signal file Prints the signal file of the active online window Starts the signal recording in the current project Stops the signal recording in the current project Opens the Project settings window
Opens the Bit pattern search window Opens the Signal-edge search window Opens the Analog value search window Opens the Trigger search window Opens the Time search window
Displays all open online windows as overlapping
All opened online windows are arrange next to each other Switches the grid on/off in the active online window Switching between relative and absolute time display Graphical display of the signals
Signal display in text mode
Loads a PLC driver and the corresponding settings
Opens the help window of PLC-ANALYZER pro and indicates a list of the help themes
Starts context-sensitive help. Click this button and select a menu item or a toolbar button in order to display a corresponding help text.
Table 3-1 Toolbar icons
3.3
Tools
Fig. 3-8 Tools menu
The Tools menu can be used to start external programs via PLC-ANALYZER pro. The
pro-grams are free selectable and can by modified at any time by using Customize. Clicking on an existing menu item causes the corresponding program to be started from PLC-ANALYZER pro.
Data acquisition 4-1
4
Data acquisition
This chapter describes how to acquire data from a PLC. With PLC-ANALYZER pro every data acquisition is navigated by a so-called project. In a project all settings will be stored.
Start a project with Assistant 'New project' in the File menu. The project assistant leads you step-by-step through the new project. In the first dialog window of the assistant you give the project an appropriate name and if necessary some descriptive comments. With Continue you can move to the next item. Enter the data appropriate to your new project on each page.
The menu item New project... in the File menu offers another possibility of defining a project. In the Create new project window you give the project an appropriate name with descriptive comments. Go to project settings with clicking on Continue.
Fig. 4-1 Definition of a new project
4.1
Address selection
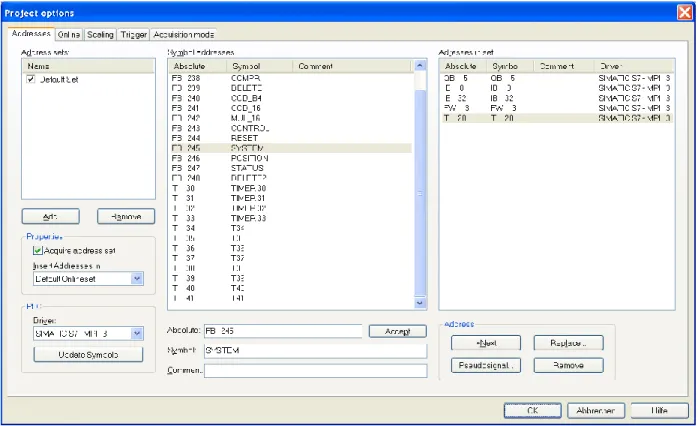
In the Addresses window you specify which signals you want to record. First, select the PLC driver under Driver for the desired addresses. Then enter the desired addresses sequentially into the text field Absolute according to the syntax of the PLC driver. Clicking on the Accept button or pressing <ENTER> causes the entered address to be included in the Addresses in set list. If several addresses shall be recorded in sequence, e.g. EB0, EB1, EB2, click on the
Next address button. Already inserted addresses can be changed with Replace. With Remove
Data acquisition 4-2
Fig. 4-2 Entering signals to acquire
NOTEThe simultaneous acquisition of signals from different PLC controllers with sever-al drivers is possible. Simply load sever-all necessary drivers and make sure that the cor-rect driver for each address has been selected.
The following table shows for instance the address syntax for the Siemens SIMATIC S7 family.
Syntax Address type Example
Qx.z Output byte x, bit z Q32.4
QBx Output byte x QB9
QWx Output word x QW14
QDx Output double word x QD98
Ix.z Input byte x, bit z I17.0
IBx Input byte x IB127
IWx Input word x IW12
IDx Input double word x ID124
Fx.z Flag byte x, bit z F3.7
FBx Flag byte x FB250
Data acquisition 4-3 Syntax Address type Example
FDx Flag double word x FD134
FGx Flag x (floating-point representation) FG104
Tx Timer x T2
Cx Counter x C5
DByDBXx.z Data byte x, bit z from data block y DB23DBX2.5 DByDBBx Data byte x from data block y DB2DBB5 DByDBWx Data word x from data block y DB12DBW5 DByDBDx Data double word x from data block y DB27DBD0
PIBx Periphery input byte x PIB 123
PIWx Periphery input word x PIW 124
PIDx Periphery input double word x PED 126 Table 4-1 Address syntax SIMATIC S7
Please have a look at the appropriate driver addendum for the address syntax of other PLC sys-tems.
4.1.1 Use of PLC symbol files
With PLC-ANALYZER pro you can use the PLC symbol files produced by the programming software. For this purpose load from PLC driver setting the desired symbol file. You will find the exact procedure in the corresponding driver addendum under Configuration of PLC-Driver.
If a symbol file is loaded all symbolic identifiers and comments of the symbol file will be in-dexed in the Symbol address list. Now you can also insert symbolic addresses in the text field
Symbol or address comments in the text field Comment. Alternatively you choose a symbol
ad-dress while making a double click on it or drag the symbol adad-dress with the mouse from the list
Symbol addresses to the list Addresses in set.
NOTESome programmable controllers (e.g. SIMATIC S7) only allow byte-wise data acquisition. In such a case PLC-ANALYZER pro converts a given bit-address automatically into a byte-address. All bits are available for display.
4.1.2 Pseudo signals
With PLC-ANALYZER you have the possibility to generate pseudo signals from chosen ad-dresses. Pseudo signals are artificial signals, which calculate themselves by means of any math-ematical formula by existing signals.
According to the formula P = U x I (performance = voltage x current) for example, the perfor-mance of a machine can permanently be calculated and indicated in pseudo signals, if voltage and current are present as measuring signals.
Choose Pseudo signal and click on Add in order to generate a pseudo signal. Now create a for-mula for this signal through selection of the appropriate buttons. Now this pseudo signal will continuously be calculated and indicated during the registration.
Data acquisition 4-4
Fig. 4-3 Generate pseudo signals 4.1.3 Address sets
With the PLC-ANALYZER pro you are able to define several sets of addresses, so-called ad-dress sets. You can assign specific signals to each adad-dress set. By selecting the New, a new ad-dress set can be generated.
Give the address set a name and choose the online window, in which the address is supposed to be displayed. With the control field Generate address set you decide, if the signals of the ad-dress set shall be generated.
With Remove the selected address set can be deleted. 4.1.4 Assign given addresses to other drivers
If you want to assign given addresses to another driver, mark these addresses in the list Set of
addresses and choose the new PLC-driver under Driver. If the desired driver is not in the list,
you must load the driver first (s. 3.1 PLC-driver).
4.2
Online signal selection
A particular feature of PLC-ANALYZER pro is the online display of recorded values in a con-tinuous line recorder and/or an oscilloscope. In the Online window the current signals to be dis-played can be chosen.
Data acquisition 4-5
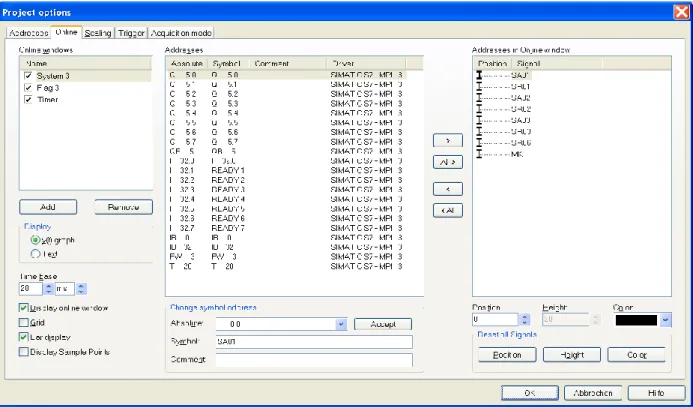
Fig. 4-4 Selecting signals for online display 4.2.1 Define online window
You can define several online windows and even indicate them simultaneously in need. Click-ing on the New button causes a new online window. Give the online window a name and under
Display, select the type of display in the online window.
The Time base displays the time per screen pixel. This value also can be changed at any time
during acquisition.
Choose under Display online window, if the online window shall be displayed during the acqui-sition.
When the control field Grid is activated, a raster grid appears in the display area of the online window. Indicate whether discrete signals (binary signals) are to be displayed as Bar display or as lines.
Under Display sample points you can activate the display of sample points, which are then dis-played as small points on the signal curve. The sample interval can be set in the window
Prop-erties of the PLC driver. More information on this item can be found in the driver addendum for
the corresponding PLC driver.
The selected window can be deleted with Remove.
4.2.2 Choose addresses for online display
All signals, which are registered with the actual project, are indexed under Addresses. Drag all addresses, which are displayed in the online window with the mouse into the list Addresses in
online window. Alternatively the buttons All > and > can also be used. Position the addresses in
the list Addresses in online window with the mouse in the order in which they shall appear in the online window. Adjust, if necessary apart from the Position also the Height and the Color of the signals.
Data acquisition 4-6
Under Reset all signals, Position, Height and Color are reset to default values (see chapter 3.2.1. Options - Signals).
If previously selected addresses are no longer displayed in the online window, please drag them with the mouse out of the list Addresses in online window or use the button < all and <.
Under Change address symbol you can change the symbolic designator and the comment of an absolute address. Select the desired Absolute address and register the Symbol as well as the
Comment of the address. With Accept the changes will be stored.
4.3
Trigger
The PLC-ANALYZER pro offers the possibility to trigger on certain events, e.g. sporadic aris-ing errors. With this feature you can create signal files containaris-ing a specific event with the sig-nal history leading up to and following the event.
You can trigger on binary and analog signals. For binary signals you can trigger on either logi-cal "0" or "1". For analog signals you can trigger on the relations greater than (>), less than (<), equal (=), and not equal (< >).
Trigger conditions can be combined with the logical operators AND and OR, enabling you to specify complex trigger conditions.
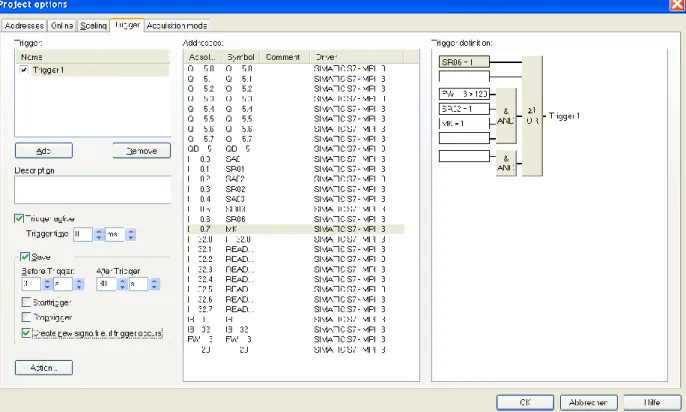
Fig. 4-5 Entering trigger conditions
A new trigger is generated by activating the button Add. Give the trigger a name and assign it a
Description. You can define several triggers.
By using the control field Trigger active you can activate or deactivate the selected trigger. With a deactivated trigger no trigger will be activated, even if the trigger conditions are performed.
Data acquisition 4-7
The Trigger time of a trigger indicates how many times the trigger conditions must be
per-formed in order to activate a trigger.
The activation of the control field Save leads, by the controlled trigger record (see chapter 4.5
Modes of data acquisition) to the fact that PLC signals are saved in a signal file only if all the
trigger conditions are performed. You can also define, how many times before and after the trigger occurrence information will be saved. The save reaction depends on the activating of the control field start trigger and stop trigger.
Activated control fields Save reaction
Start trigger The saving starts when the trigger condition is performed. It ends when a stop trigger occurs or if the storage is ended manually.
Stop trigger If a start trigger was activated before, the stop trigger will end the storage of signals. Otherwise the stop trigger has no influ-ence on the data storage.
Start trigger and Stop trigger At first appearance of a trigger condition the storage will be started and at a second time it will be ended.
Neither start trigger nor stop trigger
Data around trigger event will be saved. Adjust, how long before the trigger and how long after the trigger signals have to be saved.
Table 4-2 Saving behaviour at trigger recording
By activating the control field Create new signal file, if trigger occurs a new signal file will be created on each trigger. Otherwise all files will be saved in one signal file.
NOTEIn the record menu Manual (see chapter 4.5 Modes of data acquisition) the trigger options, which are set under Save are annulled.
Under Action a dialogue window, in which settings for events at trigger release can be made, appears (see chapter 4.3.4 Trigger actions).
In the window Addresses all addresses are listed, which are available for formatting of trigger conditions.
4.3.1 AND / OR combination of trigger signals
In order to specify complex trigger conditions PLC-ANALYZER pro allows you to combine individual conditions with logical AND and OR operations. The AND blocks are combined with logical OR. The individual conditions within each block are combined with logical AND.
4.3.2 Trigger on bit signals
Drag with the mouse a bit signal address on the desired position in the Trigger list. As soon as you let go of the address the window Trigger value will open. Now choose 1 = TRUE or 0 =
Data acquisition 4-8
FALSE. Confirm your selection with OK. Now the address appears with its trigger value in the trigger list.
By a double click on the address the trigger value can also be changed later. With <Del> the selected address will be removed from the trigger list.
Fig. 4-6 Entering the trigger value of a bit signal 4.3.3 Trigger on analog signals
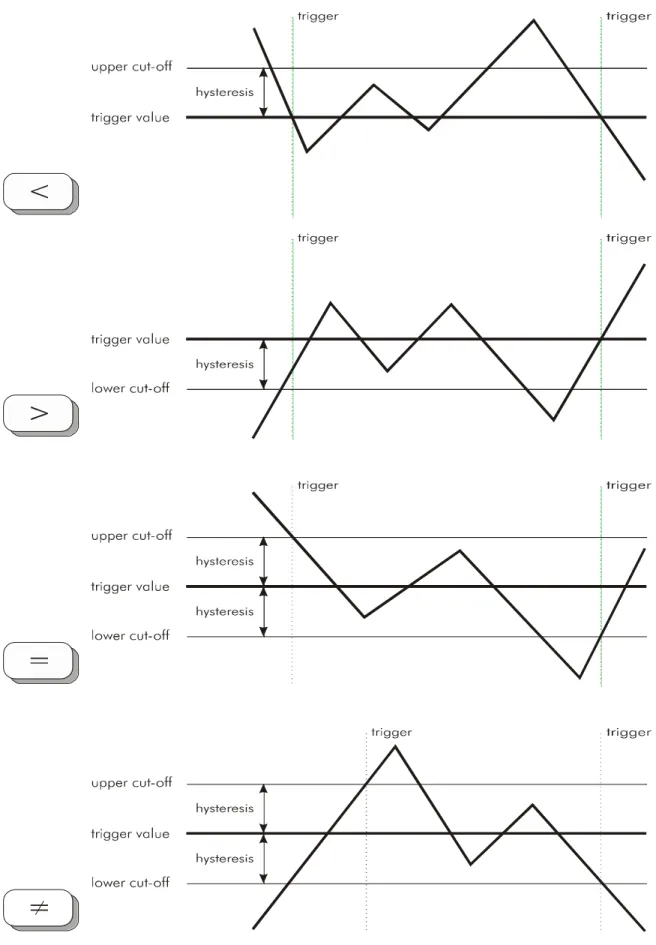
Drag with the mouse an analog value address to the desired position in the Trigger list. As soon as you let go of the address the window Trigger value will open. Select one of the four compari-son operators under Operator, than enter the corresponding number value under Trigger value.
The Hysteresis can be set in order to prevent trigger-bouncing resulting from small signal
fluc-tuations. The program determines the Upper cut-off and Lower cut-off automatically according to the entered hysteresis value. When triggering on equal „=“or unequal „< >“ the entered hyste-resis is used as the fuzzy value.
Data acquisition 4-9 The following table explains the function of the various trigger operators:
Trigger operator Description
< Triggering occurs, if the trigger value is exceeded. Triggering can occur again, only if the signal falls below the lower cut-off value.
> Triggering occurs, if the signal falls below the trigger value. Triggering can occur again, only if the signal exceeds the upper cut-off value.
= Triggering occurs, if the measured value lies in the range between the lower and upper cut-off values. Triggering can occur again, only if the signal goes outside the range.
< > Triggering occurs, if the measured value leaves the range between the lower and upper cut-off values. Triggering can occur again, only if the signal enters the range.
Data acquisition 4-10
Data acquisition 4-11 Confirm your selection with OK. Now the address appears with your trigger value in the trigger list.
With a double click on the address you can also change the trigger condition later. With <Del> the selected address will be removed from the trigger list.
4.3.4 Trigger action
With Action in the window Trigger you can open the action window of the selected trigger. Here all actions can be set, which should be carried out during the trigger action.
Fig. 4-9 Setting trigger properties
4.3.4.1 Activate and deactivate address sets and trigger (cascading)
A fired trigger can activate or deactivate trigger addresses as well as triggers. The list Address
set activate/deactivate displays the address sets that were defined before in the Address selection
window. Selecting the control field in front of an address set causes the corresponding set to be selected. If a trigger fires during signal acquisition, the selected address sets in the lists are acti-vated (or deactiacti-vated). After the trigger has fired the addresses of the actiacti-vated address sets are thus seized, whereas the collection the deactivated sets stops. Under Trigger activate and
Data acquisition 4-12
4.3.4.2 Send an E-Mail
Activate the control field Sending E-Mail in order to send an E-Mail during a trigger event. Un-der Configure you set the options to send an E-Mail from your computer. The E-Mail will be send either over the fitted Standard Mail program (e. g. Outlook) or over a SMTP server. Enter one or more E-Mail addresses. Under Subject the PLC-ANALYZER pro enters a subject line automatically, which can be changed if necessary. Now enter under Text an E-Mail text. Through activating Attach signal file to E-Mail the signal file, which has been produced by the trigger event will automatically added be to the E-Mail.
With Test you can test in advance, if all settings are correct and if the E-Mail has been sent duly.
4.3.4.3 Send an SMS
Activate the control field Send SMS in order to send an SMS during a trigger event.
Under Configure you set the options for sending an SMS. First choose how a connection to the SMS exchange has to be established. Depending on the equipment of your computer the PLC- ANALYZER pro can produce a connection over DUN (Dial-Up Networking) adapter (analog modem or ISDN-CAPI). Choose an SMS Center. Enter, if necessary, your MSN number and activate the control field Modem at an extension line, as long as your DUN adapter is connected to an extension. Confirm the input with OK.
NOTEOther settings for DUN adapter have to be made, if necessary, in the control sys-tem of Windows.
Now enter the telephone number of the receiver as well as the text of the SMS.
With Test you can test in advance, if all settings are correct and if the SMS has been sent duly.
4.3.4.4 Acoustic signaling
Activate the control field Acoustic signaling in order to announce a trigger event acoustically via a sound file (file) or alternative via audio response. First choose a path to the WAV-file or enter the text the computer should pronounce.
With Test you can test in advance if all settings are correct and if the acoustic signaling has been sent duly.
NoteThe installation of Microsoft Text-to-Speech-Engine is required for a text an-nouncement as well as a soundcard with online speakers. Free download of Mi-crosoft Text-to-Speech-Engine under: http://www.miMi-crosoft.com
Data acquisition 4-13
4.4
Scaling of register values
With the help of online scaling you can influence the display of analog values in respect to their number value and the graphical representation. For example, you can convert signal values to physical units (m, kg, hPa ...) and display them correspondingly on the screen. You can specify unit, factor, and offset of an analog value. The analog signal is converted according to the fol-lowing formula:
Display value = Factor Measured value + Offset
Fig. 4-10 Register scaling for online display
Select the signal to be scaled and change, if necessary, the default values in the corresponding text boxes.
First change the Format of the selected address. Depending on the selected address different number representations can be chosen. Enter the number of Decimal places. With choice of
Display as floating point the numerical value of the address will be indicated as a floating point
number.
If you are interested in seeing the bit pattern for a particular measured value, switch under Sig-nal display to Bitpattern.
In order to reduce the amount of recorded data for lightly fluctuating analog values, choose Low
order bits ignore. Variation of measured values in these bits will not be considered.
The vertical scale of an analogue signal can be adapted automatically with Auto scaling. The signal is scaled in such a way that the maximum value lies at the upper end of the scale and the minimum value at the lower end. Automatic scaling is preset as default.
Data acquisition 4-14
If you desire fixed scaling of the displayed values, you can choose the Automatic scaling. Now you can manually enter the scaling limits for the display under Min and Max. Entry takes place according to the format set under format.
Fixed scaling is useful, for example, if you would like to “zoom” small changes of a measured value in a particular value range. Please note, that changing the sign interpretation may cause the minimum and maximum values to be reversed.
4.5
Modes of data acquisition
Three different types of acquisition are available. You can specify the type of data acquisition under Acquisition mode.
Data acquisition 4-15 The signal data acquired by the PLC are saved in a signal file according to the acquisition mode. The following table shows the differences:
Table 4-4 Modes of data acquisition 4.5.1 Cycle-precise acquisition
In addition to the acquisition modes already explained, some PLC drivers (e.g. SIMATIC S7 and S5) allow cycle-precise data acquisition. Selected signals within the PLC are pre-acquired cycle-precise. More detailed information can be found in the corresponding driver addendum.
4.6
Starting data acquisition
Make sure that the data acquisition attributes have been set correctly. Exit the Project options
window only by clicking on the OK button. The online windows you have defined appear on the screen. Save your project with Save project in the File menu, so it can be used again later. If you want to modify your project again, select the menu item Project options... in the Project menu or confirm .
Start acquisition with Start acquisition in the Project menu or by the symbol in the icon toolbar. PLC-ANALYZER pro tests the communication with the automation device first, in order to test the connection and to determine any particularities of the connected PLC driver or its CPU.
Acquisition mode Description
Manual The selected PLC signals are recorded from manual start to end with-out breaks. Under Signalfile size you can limit the size of the signal file. If the limit is reached, the current signal file is saved and a new signal file will automatically be created.
With the control field Ringbuffer you can activate the ring memory function. The signals are saved in signal files, under Signal file size
with adjustable, fixed size. When the ring memory is full the oldest signal file will be deleted.
Trigger The standby of recording will be started and ended manually. Accord-ing to the trigger conditions set, (see also chapter 4.3 Trigger) the measuring data will be saved around one trigger or between a start trigger and a stop trigger in a signal file, if a trigger occurs.
Time controlled When acquisition starts, you are requested to specify the Start time
and Stop time for the recording. The selected PLC signals are recorded
between these points in time. Recording stops when the stop time is reached.
Data acquisition 4-16
NOTEIf the communication test fails, you are notified with the message "Error during connection attempt". In this case, check the settings of the PLC driver under Extras
- PLC driver and hardware connection to the PLC (see driver addendum).
After successful connection PLC-ANALYZER pro records the selected PLC signal data and creates - depending on the acquisition mode - one or more signal files.
If you have selected online signals, these are displayed on the screen either in an oscilloscope-like manner or in text form. Otherwise the signal display area of the screen remains empty. For online display the left column shows the address identifier in absolute or symbolical form as well as the y-axis of the signals. In the right column the currently measured values are dis-played. Occurring triggers are displayed immediately as vertical dashed lines on the screen. The time base can be changed during acquisition.
Signals and their scaling can be changed when data acquisition is running. To do this, select the menu item Project- Project settings . Data acquisition is not interrupted, however. The set-tings are stored in the signal file.
Data acquisition 4-17
NOTEAn analog signal is displayed in grey, if the signal falls outside the range of the scaling limits. With automatic scaling the scale is corrected after every pass of the signal over the screen.
Communications trouble also causes the signal color to change to grey. In this case the current values are not displayed.
The name of a signal file is dependent on the time of the first recorded PLC signal entry. The name is made up of day, month, year, hour, minute, and second, plus extension ".SPS ", e.g.
2005-04-21 12.45.00.SPS (created on 21 April 2005 at 12.45).
Acquisition is terminated by selecting the menu item Project - Stop acquisition or by the symbol in the icon toolbar.
After ending acquisition the last signal file created will automatically be opened. The time base is automatically chosen, so that the entire recorded signal is visible in the online window.
Signal display and analysis 5-1
5
Signal display and analysis
The evaluation of recorded signal data is described in this chapter. Various tools are available from PLC-ANALYZER pro for detailed analysis, e.g. time measurement, various search func-tions and signal statistics.
5.1
Opening a signal file
After data acquisition PLC-ANALYZER pro automatically loads the last signal file created. You can also open a signal file in the File menu either with the History list (contains the four most recently loaded signal files) or with Open signal file...
Fig. 5-1 Opening a signal file
The signal files are listed chronologically in the file selection window. Comments with notes on the contents of a signal file are displayed under Comment.
Signal display and analysis 5-2
Fig. 5-2 Signal file display
The name of the opened signal file is displayed in the title bar of the signal window. You can have several signal files open simultaneously, so that a direct comparison is possible.
A signal window is opened with the signal selection and scaling contained in the signal file. In a signal window the left side displays the address identifiers of the displayed signals in absolute or symbolic form. The right side shows the signal values at the current cursor position.
The time base for the display is always chosen, so that the contents of the entire file fit in the signal window. For a detailed analysis it is useful to set an appropriate time base (s. chapter
5.5.2 Setting the time base).
5.2
Signal selection
When a signal file is opened the PLC signals are displayed according to the online selection in the signal file. If you wish to change the signal selection then click on the menu item Selection
in menu Signal file. Alternatively, you can click the right mouse button in the display area of the signal window and choose the Selection menu item in the context menu Signal file.
Now make the adequate settings (see chapter 5.2 Signal selection) and press the button OK. Now the signal process is displayed in the signal window.
Signal display and analysis 5-3
5.3
Signal Scaling of register values
While opening a signal file the PLC signals will be displayed as set by the stored online selec-tion. If you like to change the signal selection choose under Signal file the menu item Signal
selection. You also can use the right mouse button in the current signal display and select Signal
selection.
Now make the adequate settings (see chapter 4.4. Scaling of register values) andpress the but-ton OK. The signal course will now be displayed in the signal window.
5.4
Signal cursor
The vertical green line (blinking) is the signal cursor. All values displayed in the display fields, such as current level and time, are always in respect to the current cursor position. You simply move the cursor to the signal position you wish to investigate and than read the corresponding measurement values.
The signal cursor can easily be moved either with the mouse or the keyboard. You can move the cursor to a desired position e.g. by moving the mouse. If you move the cursor through the left or right border of the signal display window, the signal file view will scroll slowly forward or backward. The same effect can be achieved by clicking in the address display or on the current values.
Key Function
cursor steps forward
cursor steps backward
Ctrl+ scroll forward by 10 pixels (cursor does not move) Ctrl+ scroll backward by 10 pixels (cursor does not move)
Page page up
Page page down
Home cursor to beginning of screen on left End cursor to end of screen on right Ctrl+Home cursor to beginning of signal file Ctrl+End cursor to end of signal file Table 5-1 Use of the keyboard
Signal display and analysis 5-4
5.5
Time information
On the bottom of the graphics signal window important information and options in respect to time display are shown.
Fig. 5-3 Time information
5.5.1 Absolute and relative time display
In the Cursor time text field the current time at the signal cursor position is displayed continu-ously. Two different displays can be selected:
1. Relative: Time display relative to the beginning of the signal file.
2. Absolute: System time (computer time) from the moment of incoming data.
You can change the time display under menu item Relative time display in menu View or via the symbol in the toolbar. The general format for time display is: hh:mm:ss,xxx (hh = hour, mm = minute, ss = second, xxx = millisecond).
5.5.2 Setting the time base
The time base shows the time per screen pixel. The setting has to be made under Time base. Activate the left spin field with the mouse in order to modify the time base. Alternatively, you can enter the new time base directly into the text field. Confirm your entry with <ENTER>. The time-base unit is automatically adapted to the number value entered. When the number val-ue moves outside certain limits, the unit is automatically changed to the next lower or higher unit. If the signal file is long enough, you can also manually change the unit by using the right spin field.
In cycle precise signal files the time base „ZP“ (cycle per pixel) resp. „mZP“ (milicycle per pix-el) is used too. Refer to 7.4.6 Particularities in signal display and analysis for detailed infor-mation.
5.5.3 Time measurement
For making a time measurement of signals via PLC-ANALYZER pro it is possible to accom-plish a time difference measurement and a bit measurement.
Signal display and analysis 5-5
Fig. 5-4 Activated time difference measurement
5.5.3.1 Time difference measurement
The time difference measurement allows you to measure the time difference between two arbi-trary positions. First, position the signal cursor on a reference point. Now activate the time dif-ference measurement and choose under Signalfile the menu item Time measurement / time-difference or click on the symbol in the toolbar. The reference point is marked by a fixed reference cursor. Click with the mouse on the second measuring point. The time difference will now be shown.
If you like to change the measuring points later, drag with the left mouse button to the new measuring point. If you like to change the measuring points with the keyboard, navigate the cur-sor to a measuring point and press the button <Ctr>. Hold the button <Ctr> and change the posi-tion of the measuring point with the arrow keys ( and ).
Mark a time difference measurement with the mouse to remove it and press <Del>.
5.5.3.2 Bit measurement
With the bit measurement bit signals can be measured easily. The time between two edges of a bit signal will be measured. Activate the bit measurement and choose under Signalfile the menu item Time measurement / time-difference or click on the symbol in the toolbar.
Click with the signal cursor on a bit signal. The corresponding bit signal will be measured au-tomatically. Finish the measurement via the menu item Time measurement / time-difference or click on the symbol in the toolbar
Signal display and analysis 5-6
5.6
Search functions
PLC-ANALYZER pro supports the search for certain bit patterns, signal slopes, triggers, specif-ic points in time or notes within a signal file.
Activate the search function with the menu Find by clicking the right mouse button in the dis-play area of the signal window (keyboard: Ctrl + ) or by choosing the adequate symbol in the toolbar.
5.6.1 Find trigger
The triggers set within a signal file are displayed as vertical dashed lines. Select the menu item
Find– Find trigger , in order to activate the Find trigger window.
Fig. 5-5 Find trigger
Enter the name of the trigger in the Trigger text field. With the option "All triggers", all arising triggers will be searched for. Specify the search direction with forward and backward.
If you like to scan all signal files in the directory of the current signal file, choose the menu item
Search in all signal files in this directory.
Click on Find to start the trigger search. The program now searches for the next trigger in the given search direction and positions the signal cursor on it.
5.6.2 Find time
Select the menu item Find - Find time to find a specific point in time in a signal file.
Fig. 5-6 Find time
Enter the desired time. It is also possible to use the spin controls to find a specific point in time. The time search will be done according to the setting in the signal window (absolute or relative time). The time search will be started with Find. The program searches for the corresponding time stamp and positions the signal cursor on it.
Signal display and analysis 5-7
5.6.3 Find bit pattern
In order to search for a particular binary signal pattern, se-lect the menu item Find- Find bit pattern .
All bit addresses displayed in the active signal window are listed under Addresses. Now enter the desired search pattern in the text fields right of the addresses. Permitted signal conditions are "1", "0", and "X" (1 = TRUE, 0 = FALSE, X = don’t care). Alternatively, you can change the search val-ues by using of the spin controls on the appropriate spin field.
If you like to scan all signal files in the directory of the cur-rent signal file, choose the menu item Search in all signal files in this directory.
Specify the search direction with forward and backward. Click on Find to start the trigger search.
The program now searches for the next bit pattern in the given search direction and positions the signal cursor on it.
5.6.4 Find analog value
To find a specific analog value in a signal file, use the analog-value search. Select the menu item Search - analog value .
First, select under Address the signal to be examined, and then enter the Operand and the Value
you wish to find.
If you like to scan all signal files in the directory of the current signal file, choose the menu item
Search in all signal files in this directory.
Specify the search direction with forward or backward. Start the search with Search.
The program now searches for the next analog value in the given search direction and positions the cursor on it.
Fig. 5-7 Find bit pattern
Signal display and analysis 5-8
5.6.5 Find edge
In order to search for a particular signal edge, select the menu item Find- Find edge .
All bit addresses displayed in the active signal window are listed under Addresses. Now enter the desired edge form in the text fields to the right of the addresses. Permitted entries are "+", "", "B", and "X" (+ = posi-tive edge, = negative edge, B = any edge, X = don’t care). Alternatively, you can change the search values by using of the spin controls on the appropriate spin field.
If you like to scan all signal files in the directory of the current signal file, choose the menu item Search in all signal files in this directory.
Specify the search direction with forward and back-ward. Click on Find to start the search.
The program now searches for the next edge pattern in the given search direction and positions the signal cur-sor on it.
5.6.6 Find note
To find already inserted notes you have to choose the menu item Find - Note (see also chapter 5.7.3 Insert Note).
Fig. 5-10 Find note
First choose the note you are looking for. If you select „All Notices“, all notices will be searched for. Set the search direction via forward und backward.
Set Find to start the search. The program will search for the next note in the search direction and
positions the signal cursor on it. Fig. 5-9 Find edge
Signal display and analysis 5-9
5.7
Adapting signal display
PLC-ANALYZER pro allows you to make an individual configuration of the signal display. The signal colour, shift signals and title signals can be changed.
5.7.1 Moving of signals
Choose from the left column of the online window the identifier of the PLC-address with the mouse, then drag the signal with the left mouse button to the desired position.
It is also possible to change the height of analogue signals. Drag the upper or lower gage of the signal scale with the left mouse button upward or downwards.
The signals can also be moved directly in the online window (see chapter 5.2 Signal selection). 5.7.2 Change signal color
Choose from left column of the online window the identifier of the PLC-address, which colour you want to change. Press the right mouse button and select the menu item Change signal color. Choose the desired colour.
It is also possible to change the colour of the signals directly in the online window (see chapter
5.2 Signal selection).
5.7.3 Insert notes
Choose the menu item Notice / New in the signal file menu and click on a point in window where the signals are shown and where you want the note to be shown. A text field will appear. Fill in your desired text. By pressing <ENTER> you can jump to the next line. With the mouse you can click in this text field or press <ESC> to accept the note.
Already existing notes can also be moved. Drag the note with the left mouse button to the de-sired position. The position of the arrowhead can also be moved in the manner.
The text of a note can be changed by a double click on the note.
If you like to remove an existing note, move the mouse on the not, press the right mouse button and choose menu item Delete.
5.7.4 Changing symbol addresses and symbol comments
Position the mouse cursor on the PLC address whose symbol or comments you wish to modify. Right-click the mouse and select the menu item Signal info.
Fig. 5-11 Signalinfo