Adaptive driver modelling in ADAS to improve user acceptance:
a study using naturalistic data
James M. Fleming1, Craig K. Allison, Xingda Yan, Neville A. Stanton, Roberto Lot
School of Engineering, University of Southampton, UK
Abstract
Accurate understanding of driver behaviour is crucial for future Advanced Driver Assistance Systems (ADAS) and au-tonomous driving. For user acceptance it is important that ADAS respect individual driving styles and adapt accordingly. Using data collected during a naturalistic driving study carried out at the University of Southampton, we assess existing models of driver acceleration and speed choice during car following and when cornering. We observe that existing models of driver behaviour that specify a preferred inter-vehicle spacing in car-following situations appear to be too prescriptive, with a wide range of acceptable spacings visible in the naturalistic data. Bounds on lateral acceleration during cornering from the literature are visible in the data, but appear to be influenced by the minimum cornering radii specified in design codes for UK roadway geometry. This analysis of existing driver models is used to suggest a small set of parameters that are sufficient to characterise driver behaviour in car-following and curve driving, which may be estimated in real-time by an ADAS to adapt to changing driver behaviour. Finally, we discuss applications to adaptive ADAS with the objectives of improving road safety and promoting eco-driving, and suggest directions for future research.
Keywords: ADAS, Speed choice, Safe cornering, Car following, Driver modelling, Naturalistic driving,
1. Introduction
Advanced Driver Assistance Systems (ADAS), such as lane departure warning, curve warning and collision warn-ing systems, are effective in reducwarn-ing the incidence and severity of road accidents. Estimates of the reduction in the number of rear end collisions given by collision warn-ing systems have been as high as 80% among distracted drivers, and the same system provides a safety benefit to attentive drivers by reducing the time required to re-lease the accelerator before a potential crash (Lee et al., 2002). A lane departure warning was shown by Kozak et al. (2006) to decrease reaction time to a lane excur-sion by a factor of two among sleep-deprived drivers, with greater reductions when feedback was given in the form of vibration. ADAS have also been designed that promote fuel efficient driving (Staubach et al., 2014), motivated by studies showing that feedback is necessary to retain learned eco-driving behaviours (Froehlich et al., 2009).
In practice, the efficacy of ADAS is limited by user ac-ceptance; even the most accurate warning system is useless if the driver disables it. Operator disablement of warn-ing systems has been observed in situations as diverse as aeroplane cockpits (Patterson, 1982) and nuclear power plant control rooms (Seminara et al., 1977). After design choices such as the distinctiveness and loudness of alarms,
1Corresponding Author: J. M. Fleming, Mechanical Engineering, FEE, University of Southampton, UK.J.M.Fleming@soton.ac.uk
Sorkin (1988) implicates high false alarm rates as the most important factor limiting operator acceptance. For colli-sion warning systems specifically, the probability of a crash given an alarm event is usually low due the low prior prob-ability of collisions (Parasuraman et al., 1997), so that false alarms are quite common. User acceptance of curve warn-ing systems for cars is also known to be problematic, as shown in operational tests (LeBlanc, 2006).
To reduce the number of false alarms generated by driver assistance systems while retaining a high sensitiv-ity to potential accidents, good understanding of driver behaviour is vital. For example, an understanding of typ-ical car-following behaviour is needed for effective colli-sion warnings, so that false alarms are not generated dur-ing normal conditions. But following behaviour varies greatly between drivers, with Winsum and Heino (1996) showing time headways during car following ranging from 0.67s to 1.52s, and minimum time-to-collision values dur-ing brakdur-ing varydur-ing from 2.5s to 5.1s. Likewise, to design curve warning systems that detect inattention and cau-tion drivers to slow down, it is necessary to predict the speed at which an attentive driver would take a curve. In cornering, Reymond et al. (2001) demonstrates that typi-cal lateral accelerations differ considerably from driver to driver with an observed range of 6.4m/s2to 11.4m/s2. In addition to this variation between drivers, the behaviour of a single driver may also change depending on road con-ditions and driver fatigue (Brown, 1994).
driv-ing behaviour is to design adaptive ADAS that modify their behaviour to fit the characteristics of a driver. This is made possible by the increasing number of sensors on modern vehicles. One such system has already been sug-gested by Wang et al. (2013), which recursively updates es-timates of preferred time headway and driver sensitivity to deviations in headway and inverse time-to-collision. A key problem here is to identify parameters that are consistent at different times and hence may reliably be used to char-acterise the driver. Updating such a model in real-time requires that we describe the driver by a small number of measurable and physically meaningful parameters.
In the present paper, we review the existing literature on modelling of car-following and curve driving and crit-ically evaluate these models using the results of a small-scale naturalistic driving study. The implications of this analysis for adaptive ADAS are discussed, considering what parameters of these models may be estimated by on-board sensors and the benefit in terms of user acceptance of colli-sion and curve warning systems. Finally, naturalistic data analysis is used to recommend a set of parameters that may be used to characterise driver behaviour for adaptive ADAS. These can be used by the designers of driver as-sistance systems in order to improve user acceptance and therefore lead to better safety outcomes.
2. ADAS for safety and eco-driving
A total of 1,710 people lost their lives between July 2016 and June 2017 as a result of road accidents in the United Kingdom, and a further 174,790 people were in-jured as a result of accidents (Department of Transport, UK Government, 2017). Since 2011, the number of people killed or injured on UK roads has fluctuated with no clear trend, and more work is needed to tackle road traffic ac-cidents and minimise their transformative and potentially terminal impact. One approach to minimising this impact is via the use of ADAS (Marchau et al., 2005).
Estimates of the potential safety implications of ADAS are promising. Collision warning systems were shown in simulator studies to reduce the number of rear-end col-lisions by 80% (Lee et al., 2002), while on-road studies during the EuroFOT project have confirmed the positive effects of collision warning and adaptive cruise control sys-tems on safety and fuel economy (Benmimoun et al., 2013). Similarly, a reduction of 59% in the number of fatal acci-dents (Carsten et al., 2000) is claimed to be viable with the extensive use of Intelligent Speed Adaptation systems. To achieve the goal of a positive impact on safety, such sys-tems require high acceptance by their end users (Lindgren and Chen, 2006). This is especially true for warning sys-tems where false alarm rates have been implicated in lim-iting operator acceptance (Sorkin, 1988). Within ADAS specifically, the need to explore the potential acceptance of system before implementation is necessary in order to achieve a positive safety impact (Biassoni et al., 2016).
The concept of an ADAS can be extended to not only support safety, but also encourage greater fuel efficiency and more environmentally friendly driving. In addition to the impact of vehicular drive trains (Chan, 2007) and mechanical systems (Vining, 2009) on fuel usage, the way a vehicle is driven can significantly influence fuel use and emissions. Research has estimated that 5−10% of fuel can be saved if drivers pursued a more fuel efficient, econom-ical and environmentally friendly driving style referred to as eco-driving (Barkenbus, 2010), which is characterised by behaviours such as modest acceleration, early gear changes, minimising unnecessary braking, and driving below the speed limit. Recent analysis of naturalistic driving carried out as part of the UDRIVE project has indicated that braking, gear shifting and velocity choice on motorways each have effects on fuel consumption of 10% or more for conventional vehicles (Heijne et al., 2017).
Despite the advantages offered by a reduction in fuel usage and emissions, previous research has found that in-dividuals typically struggle to maintain eco-driving be-haviours long term, and rather are reliant on feedback to regulate their behaviour (Lauper et al., 2015). It has also been suggested that more individuals would adopt eco-driving if they understood the impact of their current actions (Abrahamse et al., 2005). Specifically examining transportation, (Froehlich et al., 2009) and (Meschtscher-jakov et al., 2009) argue that providing feedback is a cost-effective way to encourage and reinforce eco-driving prac-tices. Based on this, it is clear that ADAS has the poten-tial to facilitate both safer and more fuel-efficient driving. Such a system has already been evaluated in a driving sim-ulator in Staubach et al. (2014), where a 15% fuel saving was demonstrated by encouraging drivers to coast down before intersections.
3. Models of driver behaviour 3.1. Car-following behaviour
Modelling drivers’ behaviour when following other ve-hicles has been the subject of active research since at least the mid-1940s (Herrey and Herrey, 1945). Much early re-search was motivated by applications to traffic manage-ment, and was successful in explaining emergent properties of traffic flow from the assumption that each driver behaves according to some simple rule. For example, Pipes (1953) considers the hypothesis that a driver adjusts their speed to maintain a ‘legal distance’ to a leader vehicle given by
s=s0+T0v (1) where v is the vehicle speed. When applied to a line of vehicles this implies that each driver accelerates according to the relative velocity of the preceding vehicle, which is shown to cause velocity changes in the line of traffic that propagate as a wave. These waves are often observed in real-world traffic flow, for instance at intersections when a traffic signal turns green.
Experimental evidence for a similar model of acceler-ation was given by Chandler et al. (1958), who proposed that the driver accelerates in proportion to the relative ve-locity of the vehicle ahead but with some finite reaction time, such that vehicle acceleration is given by the expres-sion
a(t+Tr) =λ[vl(t)−v(t)] (2) wherevandadenote velocity and acceleration,vldenotes the velocity of the preceding vehicle,λis a parameter rep-resenting the sensitivity of the driver to velocity differ-ences, andTr is the reaction time. An interesting feature of this model is that it can show instability for sufficiently large values of λ or Tr. This instability may be the ba-sis of further emergent properties of traffic flow such as jams or collisions (Chandler et al., 1958). A great number of subsequent works have suggested refinements and addi-tions to these car-following models, as summarised in the review paper by Brackstone and McDonald (1999). Simi-larly to (Chandler et al., 1958), these models consist of an equation for vehicle acceleration expressing some depen-dence on velocity, lead vehicle velocity, and possibly the inter-vehicle spacing.
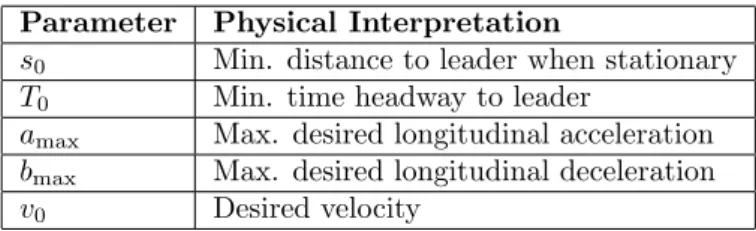
For the present paper our interest in these models is not that they may be used to simulate traffic flow (Yang and Koutsopoulos, 1996), but rather that they characterise driver behaviour by a small number of parameters that are measurable in real-time as part of an adaptive ADAS. In particular, this limits the usefulness of models that contain parameters that must be fit to data by using optimisation techniques (Kesting and Treiber, 2008) rather than having a simple physical meaning. The Intelligent Driver Model (IDM), proposed by Treiber et al. (2000), is useful in this regard as all parameters correspond to quantities that are readily estimated from velocity and range data. These model parameters are given in Table 1 along with their physical interpretations. Notably, this model assumes a spacing identical to that given by (1) when moving at a steady speed behind another vehicle.
Parameter Physical Interpretation
s0 Min. distance to leader when stationary
T0 Min. time headway to leader
amax Max. desired longitudinal acceleration bmax Max. desired longitudinal deceleration
v0 Desired velocity
Table 1: Parameters of the IDM
Inter-vehicle spacings and car-following behaviour may also be studied in isolation, without considering the re-sulting traffic behaviour. Experiments performed on a test track by Winsum and Heino (1996) suggest that each driver has a preferred time headway that they maintain in car following situations. Similarly in (Brackstone et al., 2002) it is shown that in motorway driving, human drivers allow a following distance that increases linearly with speed,
corresponding to an approximately constant time separa-tion. Further work by the same authors (Brackstone et al., 2009) considers other factors that may affect following dis-tances and concludes that they are unaffected by the level of traffic flow or the road geometry, but they are affected by the type of vehicle that is being followed, and may vary with time for a given driver.
From studies carried out in an early driving simulator, Todosiev (1963) noted that the acceleration and relative velocity of a driver following another vehicle shows a ‘limit cycle’ with maximum and minimum acceptable following distances. These cycles, visible as spirals when plotting vehicle spacing against relative velocity, are also observed in real-world driving (Brackstone et al., 2002). A percep-tual basis for this phenomenon has been suggested, with the limit cycle behaviour due to physiological thresholds on detection of relative velocity (Todosiev, 1963). Later stud-ies have developed this into a complete framework for de-scribing car-following (Leutzbach and Wiedemann, 1986). Perhaps the most widely-cited work on driver perception in car following is (Lee, 1976), which advocates the use of ‘time-to-collision’ as a predictive variable for the onset and control of braking, based on a simplified analysis of the human visual system.
Some criticism has been levelled at the existing car-following models by Boer (1999), who argued that drivers perform many tasks simultaneously and as a result are typically satisfied with a range of conditions rather than having specific preferred vehicle spacings or speeds. This idea of ‘satisficing’ rather than ‘optimising’ originates in (Simon, 1955), which suggests that humans do not attempt to make optimal decisions, and instead classify outcomes as satisfactory or unsatisfactory and act accordingly.
3.2. Cornering behaviour
In the literature, steering has typically been consid-ered as a control task independent of speed control, where the driver makes steering adjustments continuously in re-sponse to deviations in road position (McRuer et al., 1977). Similarly to driver response during car-following, experi-ments using driving simulators have shown limit cycles in the steering control of drivers when on a straight road that is consistent with the driver applying feedback subject to perceptual limits (Baxter and Harrison, 1979). This feed-back is not the only aspect of steering control, as Godthelp (1985) demonstrated a precognitive aspect to steering by occluding the view of drivers during lane-change manoeu-vres. These models have been refined through the appli-cation of control theory (Hess and Modjtahedzadeh, 1990) and modern developments have included consideration of the driver’s neuromuscular dynamics (Pick and Cole, 2003), but they do not consider the effect of steering on the driver’s speed choice, which is important to reduce false alarms in curve warning systems and to encourage coast-ing before curves in eco-drivcoast-ing assistance systems.
To model cornering speeds, Godthelp (1986) consid-ered the role of the human visual system in cornering and
showed that a quantity called ‘time-to-lane crossing’ is kept above a threshold by drivers negotiating a curve. This model predicts that drivers will choose lower speeds on tighter curves and narrower roads. This was further elab-orated in (Reymond et al., 2001), which demonstrated that a minimum time-to-lane crossing is equivalent to an upper limit to the lateral acceleration of the vehicle while corner-ing. In experiments carried out on a test track, Reymond et al. (2001) further showed that drivers’ lateral accelera-tion, denoted γ, has an upper limit that decreases when travelling at higher speeds according to the expression
γ≤Γmax−∆Cmaxv2 (3)
where Γmaxis a driver parameter representing the limit on
lateral acceleration tolerated by the driver at low speeds, while ∆Cmax determines the decrease of this limit with
speed. As the lateral acceleration experienced while driv-ing around a corner of curvatureκisγ=κv2, the
parame-ter ∆Cmaxcan be interpreted as a margin of error allowed by the driver when visually estimating the curvature of an upcoming corner. By substituting γ =κv2 into (3), this
bound on lateral acceleration implies an upper bound on speed for a given corner given by:
v≤
r
Γmax κ+ ∆Cmax
(4) It is interesting to note that this decrease of maximum lateral acceleration with speed cannot be explained from technical considerations of vehicle grip and handling, as the lateral acceleration at which the vehicle loses grip and skids is not dependent on speed (Gillespie, 1997).
Other models have been suggested in the literature that consider the curvature-speed relation directly. For exam-ple, Levison et al. (2007) provides an empirically-derived relationship predicting a limit on driver speed in terms of road curvature as v ≤ ακ−1/4, where α is a driver
pa-rameter. This is equivalent to a speed-dependent lateral acceleration bound of
γ≤ α 3
v2 (5)
which allows for direct comparison with the model of (Rey-mond et al., 2001). Drawing from observed relationships between velocity and path curvature in human arm move-ments (Viviani and Schneider, 1991), and subsequent links to optimal control theory in the motor control literature (Viviani and Flash, 1995), Bosetti et al. (2015) suggests a ‘two-thirds law’ relationship between the maximum speed in curves and road curvature given by v ≤βκ−1/3 which
is equivalent to a lateral acceleration bound
γ≤ β 3
v (6)
withβthe parameter characterising the driver. It has also been suggested that road width may affect driver speed
choice in curves (DeFazio et al., 1992), although no account of curvature was taken in that study.
It is notable that much of the existing research into driver behaviour models, especially for following distances and cornering speeds, has been carried out on test tracks and in simulators. There is a gap in the literature in that comparatively little work has been done to validate these models in naturalistic conditions. The present study hopes to address this by starting to fill this gap.
4. Methods 4.1. Hardware
Naturalistic driving data was collected as part of a small-scale study, carried out at the university of Southamp-ton in the UK, in which data was collected using a non-intrusive, portable, Automobile Data Acquisition Mod-ule (ADAM) (Yan et al., 2017) that attaches to the bot-tom corner of a car windscreen on the passenger side us-ing a suction cup. The device then gathers naturalis-tic driving data, specifically time series data of position and velocity (via GPS), acceleration and angular rota-tion (via integrated accelerometers) as well as inter-vehicle spacing using a pair of stereo cameras. ADAM was de-signed to collect data as part of the G-ACTIVE research project currently being carried out at the University of Southampton and Imperial College London (http://www. g-active.uk), and has the advantage that it may easily be installed and removed by the participants in the study, without any modification to the vehicle. Because this pro-cess can be carried out daily by the participants them-selves, it reduces the potential for demand characteristics whereby participants modify their behaviour in order to perform in a way pleasing to the researcher.
Figure 1: Example of video data from ADAM
The stereo video captured from ADAM may be post-processed in order to provide the range to vehicles in front of the unit. A typical frame from the captured video, along with a headway value calculated from the stereo video cameras, can be seen in Figure 1.
4.2. Naturalistic Data Collection
Data was collected from a total of 6 participants, de-noted F1–F6, who regularly drove through urban areas with heavy traffic. These participants took the device for several days each and recorded their driving by installing ADAM in their own vehicles. They were not instructed to follow any particular route, instead following their usual journeys to gather data. After discarding data recorded at night time due to difficulties in using ADAM to estimate range in darkness, 7 hours of time-series data remained to assess car following behaviour.
To assess cornering behaviour, naturalistic data was collected from a further 3 participants, denoted C1–C3. Participant C1 had a daily commute through a rural area and contributed a total of 10 hours of data over 17 indi-vidual drives, most of which was in rural conditions where speed was not limited by traffic. Participants C2 and C3 contributed approximately an hour of data each us-ing ADAM, again in rural conditions. Time-series data of GPS position from these participants was processed to provide an estimate of road curvature, and the resulting speed and acceleration data was filtered to remove noise. All participants (F1–6, C1–3) were frequent drivers aged between 25-40 with at least 3 years of experience, driving vehicles with engine sizes between 1.2–2.0 litres.
5. Results 5.1. Car-following
Initial analysis of the data revealed the limit cycles reported by Todosiev (1963) when the data is plotted in the ‘phase space’ of vehicle spacing versus relative velocity, which is defined such that positive values correspond to the participant’s car travelling faster than the leading vehicle. A typical such spiral is shown in Figure 2 for a slow-moving car-following situation (mean velocity 1.5 m/s), with 60 seconds of data shown. The longitudinal accelerations of the drivers studied ranged between−4.5m/s2 and 4m/s2,
with no emergency braking events observed.
Figure 2: A typical car-following spiral
We investigated the relationship between velocity and vehicle spacing by filtering and down-sampling the col-lected time-series data to a sample rate of 1s and retain-ing only those time instants where the absolute value of acceleration of both the participant’s vehicle and the pre-ceding vehicle was less than 0.5m/s2(that is, both vehicles were travelling at approximately constant speed). The re-tained values of observed spacing are shown in Figure 3 for participant F1. There was a large variability in observed vehicle spacings for all participants, although a general trend of increasing spacing with increasing speed was ob-served. Figure 3 also shows the line of best fit obtained by linear regression, corresponding to the relationship (1), which gaves0 = 9.4m and T0 = 0.90s in this case. The wide variability in observed spacings and hence poor pre-dictive value of this relationship is evident from the figure, withR2= 0.51.
For all participants, we also observed that the lower bound of the observed spacings increased with velocity and was well-approximated by a linear relationship as in (1). An estimate of this lower bound on observed spacing is shown in Figure 3 for participant F1, and the estimated values ofsminandTminfor the other participants are given in Table 2. The lack of points between 15–25m/s in the figure is due to steady following at these velocities rarely being observed in the naturalistic data. This is likely be-cause the participants mostly drove on roads with speed limits of 30, 40 and 70 miles/hour.
Figure 3: Observed vehicle spacings for F1
To investigate the Time-To-Collision (TTC) in car-following, we considered the relationship between spac-ing and relative velocity. The naturalistic time-series was again filtered and down-sampled to a rate of 1s, and all time instants when the participant car had a velocity of zero were removed. The result of this procedure is shown in Figure 4 for participant F1. From the figure, it is im-mediately apparent that there is a lower and upper bound to the observed relative velocities that appears to be well-approximated by a linear relationship. Noting that the inverse of TTC corresponds to the slope of a line on this graph, the upper bound is consistent with the driver
main-taining a TTC of greater than 2.4s.
Figure 4: Observed relative velocities for F1
Minimum observed TTC values for the other study par-ticipants are shown in Table 2. We note also that the lower bound to observed TTC as shown in Figure 4 for partic-ipant F1, and the approximately linear lower bound on observed spacing shown in Figure 3, is observed in the data collected from the other study participants.
Figure 5: Observed inverse TTC for F1
Finally, we investigated the possible dependence of TTC on speed by computing the inverse TTC, as shown in Fig-ure 5. This figFig-ure shows the inverse TTC and speed ob-served for F1 at different time instants. Generally, the maximum value of inverse TTC appears to decrease with speed (corresponding to a minimum TTC that increases with speed). There also appears to be a lower bound on the inverse TTC, increasing with speed. From inspection of the figure, it appears that there is some symmetry be-tween the upper and lower bounds, and this is was also observed for the other participants.
5.2. Cornering
The time-series data from participants C1–C3 were analysed in order to obtain relationships involving driver speed choice when cornering. All of the local maxima of
Participant TTCmin [s] smin [m] Tmin [s]
F1 2.40 1.34 0.38 F2 3.38 1.92 0.48 F3 3.13 1.45 0.45 F4 1.90 0.49 0.30 F5 3.21 1.44 0.64 F6 2.52 1.80 0.34 Mean 2.76 1.41 0.43 S. d. ±0.57 ±0.50 ±0.12
Table 2: Observed minimum car-following parameters
curvature in the time series data were found, and for each curvature value the corresponding observed velocity was extracted. This procedure give a total of 7384 cornering events for C1, 657 for C2 and 730 for C3. These ‘corners’ included junctions and instances in which the speed of the vehicle was limited by traffic flow, the effect of which is to reduce the vehicle velocity to less than that attributable to cornering alone. The lateral acceleration was then es-timated from the formula γ = κv2, which is the lateral
acceleration when following a curved path, and the peak value of lateral acceleration in each corner extracted from the time-series. This provides a large set of observed lat-eral accelerations against velocity as shown in Figure 6.
Figure 6: Observed lateral accelerations in cornering data Following the procedure in Reymond et al. (2001), a ‘high-velocity’ upper bound curve following the relation-ship (3), and a ‘low-velocity’ curve from γ = κv2, were fitted to this data with some of the observed points classi-fied as outliers and ignored. The low-velocity part of the bound is obtained assuming a minimum turning radius for the vehicle of 10m. Depending on the number of points designated as outliers, two possible curves are obtained with values of Γmax= 5.1 and ∆Cmax= 4.5 or Γmax= 3.3
and ∆Cmax = 2.6. It is evident that more corners have been observed with velocities of between 15–20 m/s and also 25–30 m/s than at other velocities. This uneven dis-tribution of velocities is likely due to speed limits on the rural route that was most often driven by the participant. In particular, speed limits of 40 and 70 miles per hour were the most common, and we have indicated these
val-ues with vertical lines in Figure 6. The high-speed part of this plot is shown in greater detail in Figure 7. Qualita-tively, it appears from the latter figure that the red curve with values of Γmax = 5.1 and ∆Cmax = 4.5 fits the data
better at high speed, but this may be due to the relatively small number of corners observed above the speed limit of 70 mph (corresponding to 31.3 m/s).
Figure 7: Detail of high-speed data
These lateral acceleration limits imply an upper bound to velocity that depends on curvature as shown in Fig-ure 8, which shows the velocities observed at the point of maximum curvature in each corner. It is notable that the outliers appear much closer to the rest of the data when plotting the velocity limit instead of the lateral ac-celeration. Also shown is a vertical line denoting the maxi-mum recommended curvature for a 60 mph road according to the UK design guidelines for road geometry (Highways Agency, UK Government, 2002). We conjecture that this causes the rapid apparent drop off in observed velocities visible in the figure near a curvature of 1.4 rad/km, as cur-vatures of greater than this are only likely on roads with a speed limit of 50 mph or less due to the design codes (Highways Agency, UK Government, 2002). This may also explain the low values of peak lateral acceleration observed in Figure 6 between the speeds of 20–25 m/s.
Figure 8: Observed velocities for cornering data
Other models of driver speed choice in curves were also evaluated against the gathered data. In particular, we
as-sessed the ‘two-thirds law’ of Bosetti et al. (2015) and the power law relationship of Levison et al. (2007), both of which were suggested as models to predict driver speed in curves. Fits of these two relationships as upper bounds to the observed data are shown in Figure 9. Levison’s re-lationship (Levison et al., 2007) appears to overestimate lateral acceleration for the corners with speeds of around 15 m/s observed in the study. Conversely, the two-thirds law (Bosetti et al., 2015) appears to overestimate the al-lowable lateral acceleration at high speeds, such as for the numerous 30 m/s corners seen in the data. Both of these models appear to allow very large lateral accelerations at speeds of around 10m/s, such that they appear unlikely to provide a reasonable description of driver cornering speeds for large curvatures.
Figure 9: Alternative lateral acceleration models
The boundary fitting procedure was repeated for par-ticipants C2 and C3 to find the corresponding lateral ac-celeration bounds according to (3), and the resulting pa-rameters are shown in Table 3. It is notable that the values of the parameter Γmaxappear to be lower across our three
participants C1–C3 than those given by Reymond et al. (2001), where the quoted mean was 7.64. A one-sample t-test for the null hypothesisµ= 7.64 yieldst(2) =−4.93,
p < 0.05, suggesting significance, and the corresponding 95% confidence interval for the mean is [3.07,7.27].
Participant Γmax [m/s2] ∆Cmax [rad/km]
C1 5.13 4.53
C2 5.34 4.95
C3 6.03 3.99
Mean 5.98 4.49
S. d. ±0.58 ±0.49
Table 3: Observed cornering parameters
6. Discussion
6.1. Comparison of models with naturalistic data
Preferred vehicle spacings were observed to vary widely, even when considering the same driver at different times.
Parameter Typical Value Physical Interpretation
iTTCmin −0.2s−1 Minimum inverse time-to-collision to leading vehicle
iTTCmax 0.2s−1 Maximum inverse time-to-collision to leading vehicle
smin 2m Minimum distance to leading vehicle when stationary
Tmin 0.7s Minimum time headway to leading vehicle
amax 4m/s2 Maximum desired longitudinal acceleration
bmax 5m/s2 Maximum desired longitudinal deceleration
Γmax 6m/s2 Maximum tolerable lateral acceleration
∆Cmax 4rad/km−1 Driver curvature safety margin
Table 4: Recommended parameters for an ADAS driver model
This conflicts with the results of some previous studies such as (Winsum and Heino, 1996) which showed that drivers were consistent in their choice of headway, but this disparity may appear because that study was not done un-der naturalistic conditions. In particular, participants in (Winsum and Heino, 1996) were instructed to drive “as if they had to reach their destination as soon as possible, without overtaking other vehicles”, which likely encour-aged them to drive closer to the preceding vehicle. On the other hand, Brackstone et al. (2009) showed that for pas-sive subjects who were unaware they were being studied, drivers were inconsistent in their choice of following dis-tance. Brackstone et al. (2009) also observed a day-to-day variation in headway between the active participants in the study, supporting our conclusion that preferred following distances may vary widely for a particular driver.
A consequence is that many of the car-following mod-els originating in the traffic literature, although success-ful at describing the bulk aspects of traffic flow, may be too prescriptive to accurately represent the behaviour of an individual driver. Many of these models, such as the Intelligent Driver Model (Treiber et al., 2000), include a preferred spacing for a given speed that will be approached in steady-state car following. Yet in our data we observed that individual drivers may remain at a steady speed at a wide variety of distances (Figure 3). We also observed the limit cycles described by Todosiev (1963) in the car following data (Figure 2), further suggesting a lack of a constant steady-state headway value. This has immediate implications for the design of adaptive collision warning systems, as it implies that it will be difficult to obtain a consistent estimate of time headway as attempted by Wang et al. (2013). We conjecture that driver behaviour is more accurately modelled if a minimum acceptable spac-ing is specified, which depends upon speed as in (1).
In contrast, when considering relative velocities there appears to be clearly defined minimum acceptable time-to-collision values (Figure 4), indicating that the onset of braking should be predictable according to the perceptual model of Lee (1976). Calculation of the inverse TTC re-veals a dependence of the inverse TTC on speed, with an upper bound that decreases with speed, in agreement with the model in (Kiefer et al., 2005). We also observed a increasing lower bound on inverse TTC with speed that
corresponds to the driver accelerating to catch up to the vehicle in front of them.
Of the cornering models considered, the lateral acceler-ation margin model of Reymond et al. (2001) appears to fit the collected naturalistic data better than Levison’s model (Levison et al., 2007) and the two thirds law (Bosetti et al., 2015). Reymond’s model also has the advantage of a well-explained perceptual basis in that drivers allow a margin for error in their estimate of curvature when cornering. However, the are several quite subjective aspects to the model fitting, such as the elimination of outliers and hence the choice of points on the boundary when performing a regression analysis. For adaptive curve warning systems, we may infer that driver preferences are measurable if it is possible to reliably identify these outliers. A further com-plication is that design guidelines for road geometry affect the shape of the boundary and any adaptive ADAS should not fit to the resulting artificially low values of cornering speed that result from this (for instance, the region around 2–3 rad/km in Figure 8). These driver lateral acceleration preferences are also relevant for occupant comfort in au-tonomous driving, where user acceptance is likely to be low if the driver perceives the car to be going too fast or too slow in corners.
6.2. Parameters characterising driver behaviour
Generally, the most successful models in our analysis are those that prescribe bounds on quantities, such as the lateral acceleration bound of (Reymond et al., 2001) or the time-to-collision bound of (Lee, 1976), rather than those giving expected values, such as the preferred headway of Winsum and Heino (1996). This fits with the idea of a driver ‘satisficing’, that is ensuring satisfaction of con-straints rather than optimising a performance criterion (Boer, 1999). Knowledge of these constraints is essential to understand typical driver behaviour, and hence for user acceptance of ADAS. A suggested set of parameters to be used to characterise a driver for adaptive ADAS is given in Table 4, and we now briefly justify these choices con-sidering curve warning and collision warning systems.
The inverse time-to-collision (TTC) may be a more use-ful measure than time-to-collision, as in the data there ap-pears to be an upper and lower bound to this quantity that
may reduce in magnitude as vehicle velocity increases. In-verse TTC has already been suggested for use in forward collision warning systems, for example by Kiefer et al. (2005), and was also suggested as an input to an adap-tive collision warning system (Wang et al., 2013). The observation that TTC appears to have a dependence on speed is consistent with the results in (Kiefer et al., 2005). It is possible that the minimum observed spacing is consistent for each driver, as illustrated in Figure 3. How-ever, the concept of a preferred spacing is in general not borne out by the naturalistic data, with linear regressions typically giving poor correlations of R2 ≈ 0.5. This has interesting implications for forward collision warning sys-tems specifically, as the desired inter-vehicle spacing is not predictable from the current velocity and if using low val-ues of headway to trigger warnings, care should be taken in the design not to sound false alarms. Notably the adap-tive ADAS of (Wang et al., 2013) uses this concept of a preferred spacing, despite the large variability we observed in this quantity during naturalistic driving. A much more consistent measure in our data is the minimum TTC (or equivalently, inverse TTC), which appears to have a well-defined acceptable range, and this quantity should be pre-ferred when designing collision warning systems.
Naturalistic data on cornering speeds matches the model given in (Reymond et al., 2001) once allowance has been made for the limits of the road geometry, and this gives either an upper bound to the lateral acceleration or equiv-alently an upper bound to speed as a function of curvature that should be considered in the design of curve-warning systems. For our participants the observed values of the maximum lateral acceleration parameter Γmax are
signif-icantly (p < 0.05) lower than those given in (Reymond et al., 2001), giving some evidence that the values in that paper may be too high for the naturalistic driving stud-ied. It is possible that this represents a difference between naturalistic driving and driving on a test track as in (Rey-mond et al., 2001), although our sample size is also very small and it could represent differences in the participants used in the study. Given that the parameters defining this bound show considerable variation between drivers, a curve-warning system should adapt to observed values of lateral acceleration to minimise false alarms and improve operator acceptance. This seems especially important as operational tests of current curve warning systems have shown limited user acceptance (LeBlanc, 2006).
6.3. Limitations
The main limitation of the present work is the small number of participants used to gather the naturalistic data. As a result of this, the numerical values of the driving pa-rameters considered in Tables 4 and 3 should not be con-sidered representative of drivers as a whole. Rather, the main value lies in the investigation of the intra-driver vari-ation of quantities such as following distance and cornering velocity, and identification of the models in the existing literature that give a good description of the behaviour
of individual participants. We also note that all vehicle following data was collected in the daytime, and that dif-ferent models may apply during hours of darkness.
The GPS unit of ADAM has a manufacturer-stated positional error of±0.9m and a velocity error of±0.1m/s. A ‘worst-case’ error analysis of the error when estimating road curvature based on these values gives±0.177rad/km for a corner of curvature 10rad/km, although in practice the error is likely to be smaller as the curvature is esti-mated from several consecutive position, speed and head-ing measurements. Similarly, the lateral acceleration es-timation error is ±0.070 m/s2 when travelling at 15m/s around a corner of curvature 10 rad/km. The distance estimation algorithm of ADAM used to calculate inter-vehicle spacing has a range error of less than 0.1m and a relative velocity error of less than 0.1m/s for distances of up to 40m, which were determined by the authors by comparison with data from a doppler radar installed on an instrumented vehicle.
7. Conclusions
Motivated by the high efficacy (Lee et al., 2002; Kozak et al., 2006) but low reported user acceptance (LeBlanc, 2006; Parasuraman et al., 1997) of some driver assistance systems, we have advocated the design of ADAS that adapt to the characteristics of a driver. In doing so, the num-ber of false alarms can be decreased for warning systems, which are a major cause of user disablement (Sorkin, 1988). But to achieve this, accurate understanding of driver be-haviour in naturalistic conditions is crucial.
Using naturalistic data collected as part of a study at the University of Southampton, we evaluated the useful-ness of existing models in describing observed relation-ships in the data during car-following and cornering, with a focus on following distance, time-to-collision, cornering speed and lateral acceleration. In particular:
• There is a poor observed correlation between speed and inter-vehicle spacing. Speed appears to be a poor predictor for a driver’s following distance, with drivers showing a large variation in their following distances at a given speed in the naturalistic data. This calls into question the use of models of this type in the design of collision-warning systems.
• Inverse time-to-collision (TTC) has a well-defined lower and upper bound for each driver that reduces in magnitude at higher speeds. This may be used to predict the onset of braking and acceleration in following situations, a finding that reinforces its use to identify critical situations for collision-warning.
• Speed while cornering is well-described by the lat-eral acceleration margin model of Reymond et al. (2001), which gives a better description of tolerable lateral accelerations than competing models and is
a good candidate for use in curve warning and eco-driving assistance systems, although values of the model parameters appear lower in our data than in the original study.
Finally, we note that our analysis of the naturalistic data supports the notion that a driver satisfices rather than optimises when driving (Boer, 1999). For adaptive ADAS, we have therefore advocated a modelling approach using parameters that describe limits to quantities such as time headway, time-to-collision and lateral acceleration. This will allow future driver assistance systems to adapt to driver preferences, improving user acceptance and hence improving safety outcomes.
Acknowledgements
We gratefully acknowledge the support of the Engineer-ing and Physical Sciences Research Council under grant number EP/N022262/1.
References
Abrahamse, W., Steg, L., Vlek, C., Rothengatter, T., 2005. A review of intervention studies aimed at household energy conservation. Journal of environmental psychology 25 (3), 273–291.
Barkenbus, J. N., 2010. Eco-driving: An overlooked climate change initiative. Energy Policy 38 (2), 762–769.
Baxter, J., Harrison, J. Y., 1979. A nonlinear model describing driver behavior on straight roads. Human Factors 21 (1), 87–97. Benmimoun, M., P¨utz, A., Zlocki, A., Eckstein, L., 2013. eurofot:
Field operational test and impact assessment of advanced driver assistance systems: Final results. In: Proceedings of the FISITA 2012 World Automotive Congress. Springer, pp. 537–547. Biassoni, F., Ruscio, D., Ciceri, R., 2016. Limitations and
automa-tion. the role of information about device-specific features in ADAS acceptability. Safety Science 85, 179–186.
Boer, E. R., 1999. Car following from the drivers perspective. Trans-portation Research Part F: Traffic Psychology and Behaviour 2 (4), 201–206.
Bosetti, P., Da Lio, M., Saroldi, A., 2015. On curve negotiation: From driver support to automation. IEEE Transactions on Intel-ligent Transportation Systems 16 (4), 2082–2093.
Brackstone, M., McDonald, M., 1999. Car-following: a historical review. Transportation Research Part F: Traffic Psychology and Behaviour 2 (4), 181–196.
Brackstone, M., Sultan, B., McDonald, M., 2002. Motorway driver behaviour: studies on car following. Transportation Research Part F: Traffic Psychology and Behaviour 5 (1), 31–46.
Brackstone, M., Waterson, B., McDonald, M., 2009. Determinants of following headway in congested traffic. Transportation Research Part F: Traffic Psychology and Behaviour 12 (2), 131–142. Brown, I. D., 1994. Driver fatigue. Human factors 36 (2), 298–314. Carsten, O., Fowkes, M., Tate, F., 2000. Implementing intelligent
speed adaptation in the UK: Recommendations of the EVSC project. In: Proceedings of the 7th World Congress on Intelligent Transport Systems, ITS Congress Association, Brussels.
Chan, C. C., 2007. The state of the art of electric, hybrid, and fuel cell vehicles. Proceedings of the IEEE 95 (4), 704–718.
Chandler, R. E., Herman, R., Montroll, E. W., 1958. Traffic dynam-ics: studies in car following. Operations research 6 (2), 165–184. DeFazio, K., Wittman, D., Drury, C., 1992. Effective vehicle width
in self-paced tracking. Applied ergonomics 23 (6), 382–386. Department of Transport, UK Government, 2017. Reported road
casualties in Great Britain: quarterly provisional estimates year ending June 2017. https://www.gov.uk/government/
uploads/system/uploads/attachment_data/file/654962/ quarterly-estimates-april-to-june-2017.pdf, accessed: 11/12/2017.
Froehlich, J., Dillahunt, T., Klasnja, P., Mankoff, J., Consolvo, S., Harrison, B., Landay, J. A., 2009. Ubigreen: investigating a mo-bile tool for tracking and supporting green transportation habits. In: Proceedings of the SIGCHI Conference on Human Factors in Computing Systems. ACM, pp. 1043–1052.
Gillespie, T. D., 1997. Vehicle dynamics. Warren dale.
Godthelp, H., 1986. Vehicle control during curve driving. Human Factors 28 (2), 211–221.
Godthelp, J., 1985. Precognitive control: open-and closed-loop steer-ing in a lane-change manoeuvre. Ergonomics 28 (10), 1419–1438. Heijne, V., Ligterink, N., Stelwagen, U., 2017. Potential of eco-driving. UDRIVE Deliverable D45.1. EU FP7 Project UDRIVE Consortium.https://doi.org/10.26323/UDRIVE_D45.1. Herrey, E. M., Herrey, H., 1945. Principles of physics applied to
traf-fic movements and road conditions. American journal of physics 13 (1), 1–14.
Hess, R., Modjtahedzadeh, A., 1990. A control theoretic model of driver steering behavior. IEEE Control Systems Magazine 10 (5), 3–8.
Highways Agency, UK Government, 2002. Design man-ual for roads and bridges: Volume 6 road geometry.
http://www.standardsforhighways.co.uk/ha/standards/dmrb/ vol6/section2/td4295.pdf, accessed: 11/12/2017.
Kesting, A., Treiber, M., 2008. Calibrating car-following models by using trajectory data: Methodological study. Transportation Re-search Record 2088 (1), 148–156.
Kiefer, R. J., LeBlanc, D. J., Flannagan, C. A., 2005. Develop-ing an inverse time-to-collision crash alert timDevelop-ing approach based on drivers last-second braking and steering judgments. Accident Analysis & Prevention 37 (2), 295–303.
Kozak, K., Pohl, J., Birk, W., Greenberg, J., Artz, B., Blommer, M., Cathey, L., Curry, R., 2006. Evaluation of lane departure warnings for drowsy drivers. In: Proceedings of the human factors and ergonomics society annual meeting. Vol. 50. Sage Publications Sage CA: Los Angeles, CA, pp. 2400–2404.
Lauper, E., Moser, S., Fischer, M., Matthies, E., Kaufmann-Hayoz, R., 2015. Psychological predictors of eco-driving: A longitudinal study. Transportation research part F: traffic psychology and be-haviour 33, 27–37.
LeBlanc, D., 2006. Road departure crash warning system field oper-ational test: methodology and results. volume 1: technical report. Lee, D. N., 1976. A theory of visual control of braking based on
information about time-to-collision. Perception 5 (4), 437–459. Lee, J. D., McGehee, D. V., Brown, T. L., Reyes, M. L., 2002.
Collision warning timing, driver distraction, and driver response to imminent rear-end collisions in a high-fidelity driving simulator. Human factors 44 (2), 314–334.
Leutzbach, W., Wiedemann, R., 1986. Development and applications of traffic simulation models at the karlsruhe institut f¨ur verkehr-swesen. Traffic engineering & control 27 (5), 270–278.
Levison, W. H., Campbell, J. L., Kludt, K., Bittner, A. C., Potts, I., Harwood, D. W., Hutton, J., Gilmore, D., Howe, J. G., Chris-tos, J. P., et al., 2007. Development of a driver vehicle module for the interactive highway safety design model. Federal Highway Administration, Office of Research and Technology Services. Lindgren, A., Chen, F., 2006. State of the art analysis: An overview
of advanced driver assistance systems (ADAS) and possible human factors issues. Human factors and economics aspects on safety, 38– 50.
Marchau, V., Van der Heijden, R., Molin, E., 2005. Desirability of advanced driver assistance from road safety perspective: the case of ISA. Safety Science 43 (1), 11–27.
McRuer, D. T., Allen, R. W., Weir, D. H., Klein, R. H., 1977. New results in driver steering control models. Human factors 19 (4), 381–397.
Meschtscherjakov, A., Wilfinger, D., Scherndl, T., Tscheligi, M., 2009. Acceptance of future persuasive in-car interfaces towards a more economic driving behaviour. In: Proceedings of the 1st
International Conference on Automotive User Interfaces and In-teractive Vehicular Applications. ACM, pp. 81–88.
Parasuraman, R., Hancock, P. A., Olofinboba, O., 1997. Alarm effec-tiveness in driver-centred collision-warning systems. Ergonomics 40 (3), 390–399.
Patterson, R. D., 1982. Guidelines for auditory warning systems on civil aircraft. Civil Aviation Authority.
Pick, A., Cole, D., 2003. Neuromuscular dynamics and the vehicle steering task. The Dynamics of Vehicles on Roads and on Tracks 41, 182–191.
Pipes, L. A., 1953. An operational analysis of traffic dynamics. Jour-nal of applied physics 24 (3), 274–281.
Reymond, G., Kemeny, A., Droulez, J., Berthoz, A., 2001. Role of lateral acceleration in curve driving: Driver model and experi-ments on a real vehicle and a driving simulator. Human factors 43 (3), 483–495.
Seminara, J. L., Gonzalez, W., Parsons, S. O., 1977. Human factors review of nuclear power plant control room design. Electric power research institute.
Simon, H. A., 1955. A behavioral model of rational choice. The quar-terly journal of economics 69 (1), 99–118.
Sorkin, R. D., 1988. Why are people turning off our alarms? The Journal of the Acoustical Society of America 84 (3), 1107–1108. Staubach, M., Schebitz, N., K¨oster, F., Kuck, D., 2014. Evaluation
of an eco-driving support system. Transportation research part F: traffic psychology and behaviour 27, 11–21.
Todosiev, E. P., 1963. The action point model of the driver-vehicle system. Ph.D. thesis, The Ohio State University.
Treiber, M., Hennecke, A., Helbing, D., 2000. Congested traffic states in empirical observations and microscopic simulations. Physical review E 62 (2), 1805.
Vining, C. B., 2009. An inconvenient truth about thermoelectrics. Nature materials 8 (2), 83–85.
Viviani, P., Flash, T., 1995. Minimum-jerk, two-thirds power law, and isochrony: converging approaches to movement planning. Journal of Experimental Psychology: Human Perception and Per-formance 21 (1), 32.
Viviani, P., Schneider, R., 1991. A developmental study of the rela-tionship between geometry and kinematics in drawing movements. Journal of Experimental Psychology: Human Perception and Per-formance 17 (1), 198–218.
Wang, J., Zhang, L., Zhang, D., Li, K., 2013. An adaptive longi-tudinal driving assistance system based on driver characteristics. IEEE Transactions on Intelligent Transportation Systems 14 (1), 1–12.
Winsum, W. v., Heino, A., 1996. Choice of time-headway in car-following and the role of time-to-collision information in braking. Ergonomics 39 (4), 579–592.
Yan, X., Fleming, J., Allison, C., Lot, R., 2017. Portable automobile data acquisition module (ADAM) for naturalistic driving study. In: Proceedings of the 15th European Automotive Congress. Yang, Q., Koutsopoulos, H. N., 1996. A microscopic traffic
simula-tor for evaluation of dynamic traffic management systems. Trans-portation Research Part C: Emerging Technologies 4 (3), 113–129.