PERFORMANCE EVALUATION ON THIN-WHITETOPPING
B.N. Skanda kumar
1, Suhas R
2, Bhavan V
3 1Assistant professor, Civil engineering department, Dayananda Sagar College of Engineering, Banglore-560078,
Visvesvaraya Technological University Belgaum, India.
2
Assistant professor, Construction technology department, Dayananda Sagar College of Engineering,
Banglore-560078, Visvesvaraya Technological University Belgaum, India.
3
Student of M-Tech, Civil engineering department, Dayananda Sagar College of Engineering, Banglore-560078,
Visvesvaraya Technological University Belgaum, India.
Abstract
Whitetopping is a pavement system of Portland Cement Concrete (PCC) placed on asphalt concrete pavement. Whitetopping is used to address distresses in asphalt pavement such as rutting and shoving. Whitetopping overlay projects are built in India from 2003 to 2013 but to date, there has been no specific follow-up regarding their performance. In this study, Performance Evaluation studies are conducted to determine functional and structural condition of a whitetopping overlay which has the purpose of routine monitoring or planning the corrective action. Where in structural evaluation is done by conducting Benkelman Beam Deflection (BBD) studies, Taking out core samples and subjecting them UPV and Rebound hammer tests and also developing a theoretical model through Finite Element Analysis using STAAD Pro software. The functional evaluation of this pavement is done by collecting traffic data and also riding quality is measured using MERLIN and Visual Rating is given as suggested by American Association of State Highway and Transport Officials (AASHTO).
---***---
1. INTRODUCTION
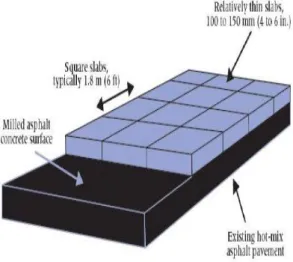
Portland Cement Concrete (PCC) overlay on an existing bituminous pavement is commonly known as White topping. The principal purpose of an overlay is either to restore or to increase the load carrying capacity or both, of the existing pavement. In achieving this objective, overlays also restore the ride-ability of the existing pavements which have suffered rutting and deformations, in addition to rectifying other defects such as loss of texture[4].
Concrete overlays have been used to rehabilitate bituminous pavements since 1918 in USA. There has been a renewed interest in white topping, particularly on Thin White Topping (TWT) and Ultra-Thin White Topping (UTWT) over Conventional White Topping. Based on the types of interface provided and the thickness of overlay, classification is as follows[4]:
i) Conventional White topping – which consists of PCC overlay of thickness 200 mm or more, which is designed & constructed without consideration of any bond between existing overlay & underlying bituminous layer (without assuming any composite action).
ii) Thin White topping (TWT) – which has PCC overlay between 100 – 200 mm. It is designed either considering bond between overlay & underlying bituminous layer or without consideration of bond. High strength concrete (M 40 or higher) is normally used to take care of flexure requirement. Joints are at shorter spacing of 0.6 to 1.25 m.
iii) Ultra-Thin White topping (UTWT) – which has PCC overlay of less than 100 mm. Bonding between overlay & underlying bituminous layer is
mandatory. To ensure this, the existing layer of bitumen is either milled (to a depth of 25 mm) or surface scrapped (with a non-impact scrapper) or gently chiseled. Joints are provided at a spacing of 0.6 to 1.25 m.
Fig 1 Shows Typical view of Whitetopping
Performance evaluations are conducted to determine functional and structural condition of a pavement either for a purpose of routine monitoring or planned corrective action. Functional condition is primarily concerned with the ride quality or surface texture and its characteristics of a pavement. Structural condition is concerned with the structural capacity of pavement as measured by deflection, layer thickness, material properties, mechanistic-empirical design of rehabilitation alternatives.
Use of Falling Weight Deflectometer (FWD) for the evaluation of pavements is gaining popularity in many countries, as it is possible to simulate the magnitude and duration of load applied by a fast moving vehicle on highways using this equipment. However, the use of FWD in India has been very limited so far because of its high cost and difficulties encountered in maintaining the equipment. Therefore, a need has been aroused to identify an alternative to FWD test, which can be cost effective and easily available. Bankelman beam test is one the static load deflection equipment which measures the maximum deflection response of a pavement to static or slowly applied loads. Advantages of the Benkelman Beam include ease to use, low equipment cost, and large database can be created about performance of the pavement over the years. But, the guidelines given by IRC: 81-1997 for conducting Benkelman Beam test are applicable only for flexible pavements. In this study attempt has been made to conduct this test on the top of UTW. Benkelman Beam test has been carried out to find deflection on top of UTW overlay, as per IRC: 81-1997. The deflection on the surface of slab at three critical positions i. e. at interior, corner and edge were measured after three to four years. Load transfer is an important for pavement longevity. Most of the performance related problems with concrete pavements are resultant of poor joints performance. Distress occurs in the pavement in the form of faults, pumping and corner breaks at the joints due to poor load transfer efficiency. Load Transfer Efficiency (LTE) of aggregate interlocking at transverse joints has been calculated using two Benkelman Beams. These results are compared with the other researcher’s results available in the literature. Use of Benkalman beam for the evaluation of pavement structurally and temperature of pavement. The slab thickness is determined by coring the pavement the flexural strength is determined by third-point loading of standard size beams[1].
Nondestructive testing (NDT) is term used to describe the examination of pavement structure and material properties through means that do not induce damage or property changes to the structure. There are various such non-destructive testing methods which can be broadly classified as those which measure the overall quality of concrete, for example dynamic or vibration methods like resonance frequency and ultrasonic pulse velocity tests; and those which involve measurement of parameters like surface hardness, rebound, penetration, pull-out strength, etc, and are believed to be indirectly related to the compressive strength of concrete[6,7].
Where the traffic volume of pavement section and of visual ratings depends upon their rating as shown in below where the pavement depends and its given by drivers or common man. Riding comfort gives the how the pavement gives comfort to road users and how it performs. Roughness survey is an important part of the pavement construction acceptance process. Roughness is a measure of a pavement’s functional performance, that is, how well the pavement is providing a smooth, safe ride to the traveling public. Roughness can develop from surface irregularities that are
built into a pavement during construction, and surface irregularities that develop after construction (due to traffic loading, climatic effects, and other factors). The primary purpose of performing roughness surveys for a given project is to obtain a roughness profile so that locations of severe roughness can be identified. The standard unit for roughness measurement is the Profile Index (PI). The P is a numeric scale that ranges from 0 to 200 mm/km (0 to 13 in/mi), with larger values indicating greater roughness. These roughness surveys are performed using profilographs by the contractor as part of construction QC/QA program. This type of survey is not used to evaluate pavement condition on individual projects.
Roughness profile index
2. LITERATURE REVIEW
D. R. Jundhare, Dr. K. C. Khare; and Dr. R. K. Jain12 said Following conclusions are reached from the detailed study carried out using BBD as per guidelines given in IRC: 81-1997, as NDT for determining deflection at three critical load positions and LTE has been calculated at the transverse joints of 100 mm thick on in-service UTW overlay constructed in Pune city, Maharashtra State (India), for its performance evaluation subjected to various traffic and climatic conditions relevant to Indian scenario. The deflections obtained in this study after two year is 0.461mm, 0.415 mm and 0.265 mm at the edge, corner and interior respectively. These deflection results have been compared with the results of three dimensional FE model (Jundhare D. R. et al., 2012), these values show good agreement. LTE in the 100 mm thick UTW overlay for this study has been ranging from 88.03% to 100.00 % in the 1.00 m x 1.00 m panel size. These results of LTE have been compared with the results of 120 mm thick overlay (Cable, J. K. et al., 2006). LTE obtained for their study ranges from 99.60% to 99.90%. In another study, based on the finite element method using KENSLAB computer program (Huang 1985) 84% of LTE value has been observed at transverse joint of bonded type of interface. When results of BBD test from this study have been compared with the deflection values obtained by three dimensional FE model (Jundhare D. R. et al., 2012) and LTE values obtained by Cable, J. K. et al. (2006) as well as KENSLAB computer program, these values show good agreement. Therefore it can be concluded
that BBD test can be a useful, reliable and alternative tool to FWD for the study the performance evaluation of UTW overlay.
D. R. Jundhare, Dr. K. C. Khare; and Dr. R. K. Jain13 said Following conclusions are the model in this study is a simple non-linear type developed by applying static axle loading. Through the present study following conclusions have been drawn for the edge loading case, the method of Westergaard gives stress 21.81 % and deflection 29.45 % more when compared with 3D FEM results. Comparison with ALIZE Method gives stress 2.09 % less. The difference between the values from this method and the 2D modeling is due to the various assumptions adopted in deriving these theories. It is revealed that, increasing the modulus of subgrade reaction (k) of HMA resulted in reducing the stresses and deflections in plain cement concrete overlay. FEM analysis of the whitetopping shows stresses and deflection induced in the whitetopping within the safe limits. Therefore unbonded plain cement concrete overlays can be an economical and durable rehabilitation option, when the existing pavement is severely deteriorated as compared to construction of conventional rigid pavement or HMA overlay. This work confirms that the use of ANSYS software has a great potential as a powerful tool for a 3D modeling of the conventional unbounded whitetopping. D. R. Jundhare, Dr. K. C. Khare; and Dr. R. K. Jain14 said Following conclusions are reached from the detailed study carried out using BBD as per guidelines given in IRC: 81-1997 and FWD test as NDT for determining deflection at edge and corner load positions of 320 mm thick on in-service conventional whitetopping overlay constructed in Pune city, Maharashtra State (India), for its performance evaluation and correlation development subjected to various traffic and climatic conditions relevant to Indian scenario. The linear, exponential and logarithmic relationship has been developed using Benkelman Beam and FWD deflection values on conventional whitetopping overlays. Among of the linear, exponential and logarithmic relationships; the exponential relationship gives high R value. R2 value of the three relationships, it is higher in edge loading position than corner loading position. The relationships developed are quite fair as R2 values are in between 0.65 to 0.80 which shows the good correlation strength between the BBD and FWD deflection values.
3. EXPERIMENTAL INVESTIGATION AND
RESULTS
The studies on the project stretch near Madiwala Underpass (Bangalore) where Whitetopping has been done on the existing Bituminous Road in 2010, were done to evaluate the performance of whitetopped pavement. To know the performance of a pavement, it must be evaluated to satisfy functional and structural requirements as per the standards. Individually, functional evaluation and structural evaluation are done by using different experiments like Visual Rating Test, MERLIN Test, Benckelman Beam Deflection (BBD)
Experiment, Rebound Hammer Test, Ultrasonic Pulse Velocity (UPV) Tests.
3.1 Visual Rating using PSI Method
The technique used to define pavement, used a team drew vehicle across the pavement to tell their experience how they feel and rate its condition with respect to driving comfort as shown below. The areas of cracking, patching, ravelling, etc were visually estimated. Based on the objective measurements the Present Serviceability Index (PSI) could be obtained using the AASHTO scaling.
Roughness profile index
3.2 Merlin Test
The wheel path along which the readings are to be taken is marked. The MERLIN is moved and kept in the starting point. The location of the pointer on the chart is recorded with a cross at the appropriate column and to kept record of the total number of observations, a cross mark is also made in the graph sheet. The handle of the Merlin is raised, so that the wheel is in contact with road surface and moved forward one round where the wheel starting is marked and stopped, the point is noted exactly in the graph. The repetition of procedure should be continued and observations are noted. The test has been conducted as per above procedure in field. The unevenness of pavement as been of right side of wheel path (Majestic to Electronic city) at Madiwala junction is 64mm and on the left side wheel path (Electronic city to Majestic) is 68mm of the center wheel path.
Where IRI (international roughness index) for most road surfaces is determined using the equation
IRI= 0.593 + 0.0471 D (2.4 < IRI < 15.9)
3.3 Rebound Hammer Test
Rebound Hammer (RH) Test is a Non-destructive method of testing the strength of the concrete. So, RH test has been used to know the strength of the Whitetopped pavement without destructing the surface of it. When the needle of the
RH Equipment is made to hit the concrete surface with a gentle push, the needle rebounds and gives the value in RH Numbers. Then by using the chart in standard code book – IS: 13311 part-2 , respective strength of the tested surface is determined. Also, the RH Test has been conducted on the core sample extracted from the test stretch by fixing the sample in between two fixtures. The results of the test are as shown in annexure.
3.4 UPV (Ultra Sonic Pulse Velocity) Test
UPV (ULTRA SONIC PULSE VELOCITY) Test is also another important Non-destructive method of testing the strength of the concrete. So, UPV test has been used to know the strength of the Whitetopped pavement without destructing the surface of it. It works on the principle of the velocity with which the sound pulses travel through the concrete specimen of known thickness. When the two cells of the test set-up are connected to PUNDIT (Pulse generating Equipment), the sound pulses gets generated and the other ends of the cell are placed firmly on both sides of the test sample. The velocity has been given in the display of PUNDIT and then by using the chart in standard code book – IS: 13311part-1, respective strength of the tested surface is determined. Also, the UPV Test has been conducted on the core sample extracted from the test stretch by holding the pulse cells on both sides of the core sample with the application of or grace Gel to get better results. This is known as the Direct Method of testing as the cells are held on both the sides of the sample. But in case of testing the Pavement surface, the Indirect Method of testing is adopted where in the cells are held on the surface at two points and length in between them is considered for determining the strength. The results of the test are as shown in annexure.
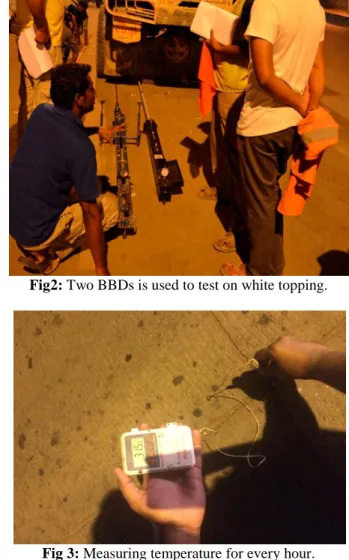
3.5 BBD (Benckelman Beam Deflection) Test:
Usually BBD Test is conducted on Flexible Pavement surface and it is difficult to follow it on the Rigid Surface. In the present study based on the research work of D R Jumdharel[4] , the concept of using two BBD Equipments at a time is followed. The usual way of testing for Rigid Pavements is to go for FWD (Falling Weight Deflectometer) which is the costlier test set-up. Two BBD’s are taken in this test as per the procedure of IRC: 81-1997 and placed on 2 adjacent slabs – one on the loaded slab and another on unloaded slab near to the joints. When the rear axle load of 8170kg moves on the pavement surface, the deflection values are noted down in both the BBD’s. The efficiency of a joint is generally expressed in terms of its ability to transfer load from one side of the joint/ crack to the other side and is termed as Load Transfer Efficiency (LTE). LTE is expressed as a percentage of the unloaded slab deflection to the loaded slab deflection.
LTE = Unloaded Slab Deflection Loaded Slab deflection 𝑋 100
values are noted down in both the BBD’s. The results are shown in annexure.
Fig2: Two BBDs is used to test on white topping.
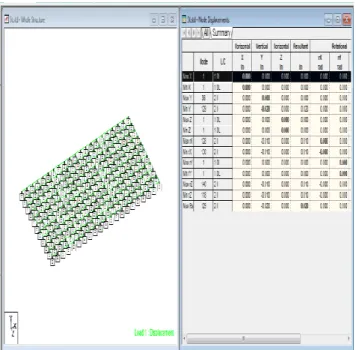
Fig 3: Measuring temperature for every hour.
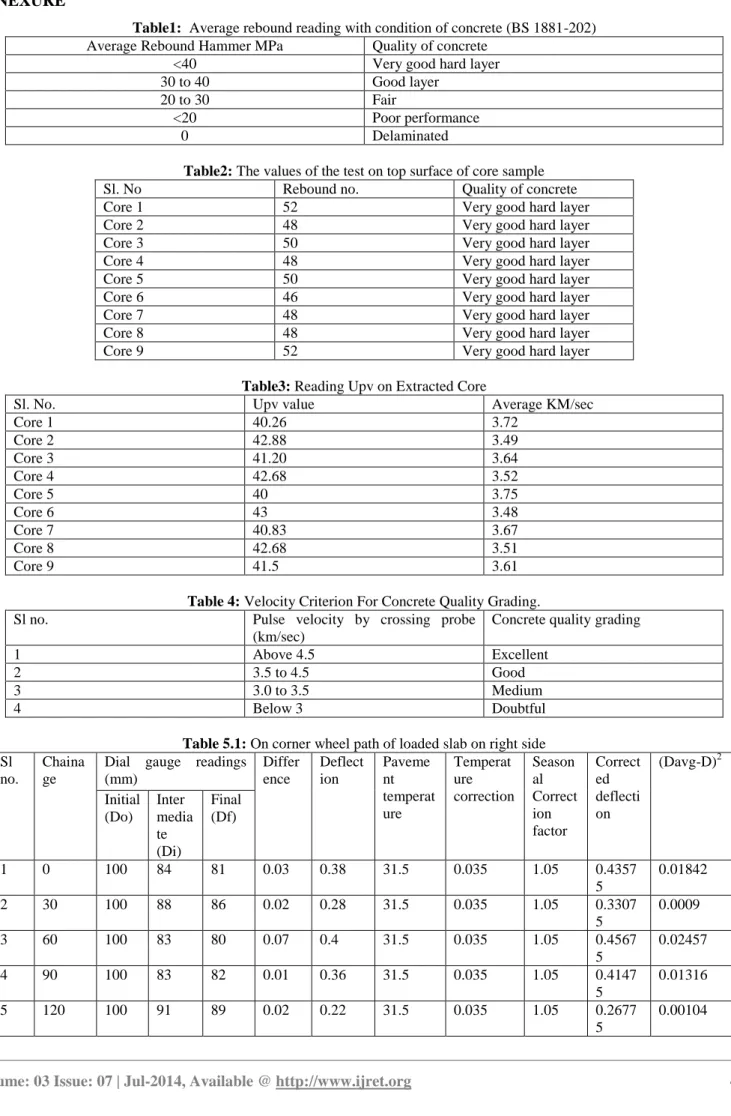
3.6 FEM Model Procedure:
The software used for FEM model analysis is STADD PRO of Bentley system. The commercial version STAAD Pro is one of the most widely used structural analysis and design software. It supports several steel, concrete and timber design codes.
The model has been carried out by specifying the material properties of whitetopping as follows
Thickness of pavement: 150mm Young’s modulus E: 3*105 Panel size: 1.25*1.25 Poisons ratio: 0.15 Tyre pressure: 0.8Mpa
Temperature co-efficient: 10*10-6 Axle load: 50 KN
By considering above materials mentioned the FEM model has been prepared by considering sub grade value (k) as 10kg/cm2 and the support is given as foundation and we got the value of base pressure.
The procedure of creating FEM model in STADD PRO is generating nodes with specific distances. Connect each node of slab and generate a mesh of panel size 1m*1m or
1.25m*1.25m. Generate the foundation support of specified slab and mention the sub grade value (k) as given above. Mention the material properties such as thickness, temperature co-efficient, young modulus, poisons ratio etc. Specify the dead load and live load and both combinational loads. Apply the load on the specified panels and check the performance and run the analysis. Accordingly the load acts on overall slab and the base pressure will be shown as if post tensioning is done.
Fig 4 shows the FEM model using STAAD PRO software.
4. CONCLUSIONS
1. As per above AASHO scale shown in visual rating, it was suggested the pavement rating was 4 out of 5. The suggested rating of pavement condition indicates, the pavement is good for riding quality. As per the engineering visual rating, the suggested rating was 3 out 5, since pavement had some cracks and one or two patched pot holes.
2. IRI value from eqn mentioned in IRI of right side and left side wheel path is 3.6 m/km and 3.8 m/km respectively. It concluded that the values are within the limit and the pavement is in good condition.
3. As per the table 3.2 BS: 1881-2002, standard rebound number obtained for the core sample and the field test conducted shows the quality of concrete in the pavement is Very good hard layer.
4. Upv results of Core sample tests and comparison with standard values as shown in table 3.6, it can be concluded the concrete in the Pavement is of good quality.
5. After four years of laying the pavement, the stretch was evaluated with BBD to know the deflection values.
Deflection values are 0.369mm, 0.39mm, 0.32mm and 0.510
mm for corner and interior wheel paths on left and right stretches of the Pavement, respectively. Values were compared with Finite Element Analytical Model developed and it is showing Pavement layer as good.
6. In future BBD can be conducted on whitetopping pavement as alternate of Falling Weight Deflectometer. 7. The percentage of load transfer efficiency form Eqn. mentioned in BBD explanation for loaded and unloaded slabs was calculated. It was found that values vary from 70% to 100%.
ACKNOWLEDGEMENTS
The authors are grateful to Bruhath Bengaluru Mahanagara Paalike(BBMP) for their kind permission in availing the required data. The authors are also thankful to Prof. Dr. H.S. Jagadeesh, Professor, Department of Civil Engineering, BMS College of Engineering & Dr. V. Ramchandra, Zonal Head (Tech), UltraTech Cements Ltd. for guidance and encouragement for conducting this study.
REFRENCES
[1] D. R. Jundhare1, Dr. K. C. Khare; and Dr. R. K.
Jain.Civil Engineering Department, Sinhgad College of Engineering, Vadgaon (Bk.), Pune-411041. M. S. India. University of Pune. Performance Evaluation of Ultra-thin Whitetopping in India by BBD Test [2] D. R. Jundhare, Dr. K. C. Khare; and Dr. R. K.
Jain.Civil Engineering Department, Sinhgad College of Engineering, Vadgaon (Bk.), Pune-411041. M. S. India. University of Pune. Development Correlation between Benkelman Beam Deflection and Falling Weight Deflectometer for Conventional Whitetopping Overly.
[3] D. R. Jundhare, Dr. K. C. Khare; and Dr. R. K. Jain.Civil Engineering Department, Sinhgad College of Engineering, Vadgaon (Bk.), Pune-411041. M. S. India. University of Pune. Study of Edge Stresses and Deflections in Whitetopping Overlay on Winkler Foundation
[4] IRC: SP: 76 – 2008 Tentative guidelines for
conventional, thin and Ultra-thin white topping, , The Indian Roads Congress, New Delhi, 2008
[5] IRC: 81-1997, Guide lines for strengthening of
flexible road pavement using benkalman beam deflection.
[6] IS: 13311 (Part-1): 1992, Non-destructive testing of
concrete -methods of test part 1 Ultrasonic pulse velocity.
[7] IS: 13311 (Part-2): 1992 Non-destructive testing of concrete -methods of test part 2 Rebound hammer.
ANNEXURE
Table1: Average rebound reading with condition of concrete (BS 1881-202) Average Rebound Hammer MPa Quality of concrete
<40 Very good hard layer
30 to 40 Good layer
20 to 30 Fair
<20 Poor performance
0 Delaminated
Table2: The values of the test on top surface of core sample
Sl. No Rebound no. Quality of concrete
Core 1 52 Very good hard layer
Core 2 48 Very good hard layer
Core 3 50 Very good hard layer
Core 4 48 Very good hard layer
Core 5 50 Very good hard layer
Core 6 46 Very good hard layer
Core 7 48 Very good hard layer
Core 8 48 Very good hard layer
Core 9 52 Very good hard layer
Table3: Reading Upv on Extracted Core
Sl. No. Upv value Average KM/sec
Core 1 40.26 3.72 Core 2 42.88 3.49 Core 3 41.20 3.64 Core 4 42.68 3.52 Core 5 40 3.75 Core 6 43 3.48 Core 7 40.83 3.67 Core 8 42.68 3.51 Core 9 41.5 3.61
Table 4: Velocity Criterion For Concrete Quality Grading. Sl no. Pulse velocity by crossing probe
(km/sec)
Concrete quality grading
1 Above 4.5 Excellent
2 3.5 to 4.5 Good
3 3.0 to 3.5 Medium
4 Below 3 Doubtful
Table 5.1: On corner wheel path of loaded slab on right side Sl
no.
Chaina ge
Dial gauge readings (mm) Differ ence Deflect ion Paveme nt temperat ure Temperat ure correction Season al Correct ion factor Correct ed deflecti on (Davg-D)2 Initial (Do) Inter media te (Di) Final (Df) 1 0 100 84 81 0.03 0.38 31.5 0.035 1.05 0.4357 5 0.01842 2 30 100 88 86 0.02 0.28 31.5 0.035 1.05 0.3307 5 0.0009 3 60 100 83 80 0.07 0.4 31.5 0.035 1.05 0.4567 5 0.02457 4 90 100 83 82 0.01 0.36 31.5 0.035 1.05 0.4147 5 0.01316 5 120 100 91 89 0.02 0.22 31.5 0.035 1.05 0.2677 5 0.00104
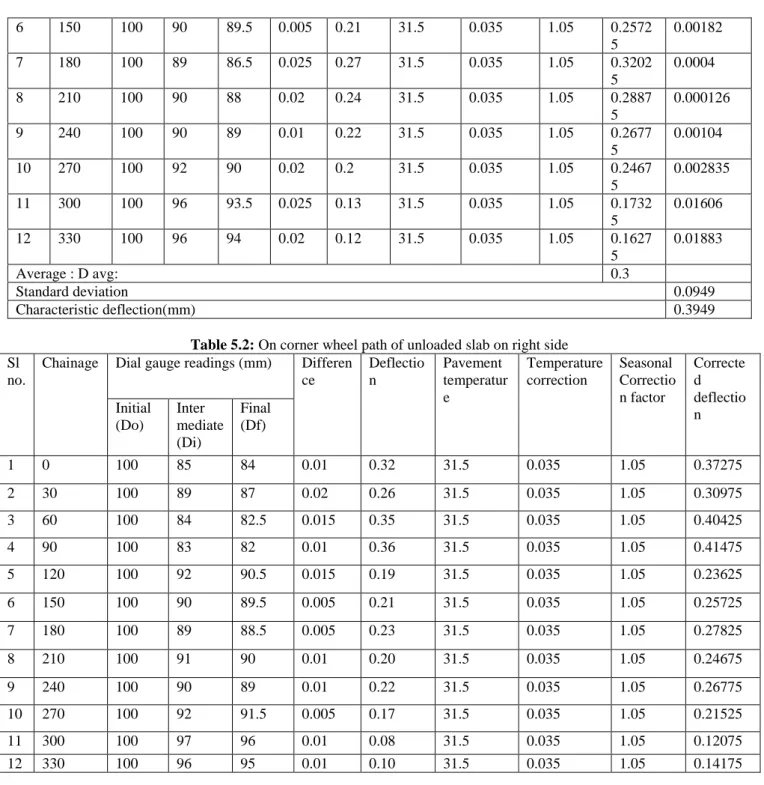
6 150 100 90 89.5 0.005 0.21 31.5 0.035 1.05 0.2572 5 0.00182 7 180 100 89 86.5 0.025 0.27 31.5 0.035 1.05 0.3202 5 0.0004 8 210 100 90 88 0.02 0.24 31.5 0.035 1.05 0.2887 5 0.000126 9 240 100 90 89 0.01 0.22 31.5 0.035 1.05 0.2677 5 0.00104 10 270 100 92 90 0.02 0.2 31.5 0.035 1.05 0.2467 5 0.002835 11 300 100 96 93.5 0.025 0.13 31.5 0.035 1.05 0.1732 5 0.01606 12 330 100 96 94 0.02 0.12 31.5 0.035 1.05 0.1627 5 0.01883 Average : D avg: 0.3 Standard deviation 0.0949 Characteristic deflection(mm) 0.3949
Table 5.2: On corner wheel path of unloaded slab on right side Sl
no.
Chainage Dial gauge readings (mm) Differen ce Deflectio n Pavement temperatur e Temperature correction Seasonal Correctio n factor Correcte d deflectio n Initial (Do) Inter mediate (Di) Final (Df) 1 0 100 85 84 0.01 0.32 31.5 0.035 1.05 0.37275 2 30 100 89 87 0.02 0.26 31.5 0.035 1.05 0.30975 3 60 100 84 82.5 0.015 0.35 31.5 0.035 1.05 0.40425 4 90 100 83 82 0.01 0.36 31.5 0.035 1.05 0.41475 5 120 100 92 90.5 0.015 0.19 31.5 0.035 1.05 0.23625 6 150 100 90 89.5 0.005 0.21 31.5 0.035 1.05 0.25725 7 180 100 89 88.5 0.005 0.23 31.5 0.035 1.05 0.27825 8 210 100 91 90 0.01 0.20 31.5 0.035 1.05 0.24675 9 240 100 90 89 0.01 0.22 31.5 0.035 1.05 0.26775 10 270 100 92 91.5 0.005 0.17 31.5 0.035 1.05 0.21525 11 300 100 97 96 0.01 0.08 31.5 0.035 1.05 0.12075 12 330 100 96 95 0.01 0.10 31.5 0.035 1.05 0.14175
Table 5.3: on center wheel path of loaded slab on right side Sl
no .
Chainag e
Dial gauge readings (mm) Differe nce Deflecti on Pavement temperatu re Temperatu re correction Seasona l Correcti on factor Correcte d deflectio n (Davg-D)2 Initial (Do) Inter mediat e (Di) Final (Df) 1 0 100 96 94.5 0.015 0.11 31.5 0.035 1.05 0.15225 0.02814 2 30 100 92 90 0.02 0.2 31.5 0.035 1.05 0.24675 0.00535 3 60 100 90 89 0.01 0.22 31.5 0.035 1.05 0.26775 0.00273 4 90 100 88 86 0.02 0.28 31.5 0.035 1.05 0.33075 0.00011 5
5 120 100 85 83 0.02 0.34 31.5 0.035 1.05 0.39375 0.00543 6 150 100 91 88 0.03 0.24 31.5 0.035 1.05 0.28875 0.00097 7 180 100 88 86.5 0.015 0.27 31.5 0.035 1.05 0.32025 6.25*10 -08 8 210 100 87 85 0.02 0.3 31.5 0.035 1.05 0.35175 0.001 9 240 100 88 86 0.02 0.28 31.5 0.035 1.05 0.33075 0.00011 5 10 270 100 86 84 0.02 0.32 31.5 0.035 1.05 0.37275 0.00278 11 300 100 85 82.5 0.025 0.35 31.5 0.035 1.05 0.40425 0.00709 12 330 100 84 81 0.03 0.38 31.5 0.035 1.05 0.43575 0.01339 Average : D avg: 0.32 Standard deviation 0.0781 Characteristic deflection 0.39
Table 5.4: Center wheel path of unloaded slab on right side Sl
no .
Chainage Dial gauge reading (mm) Differe nce Deflectio n Pavement temperatur e Temperatur e correction Seasonal Correctio n factor Correcte d deflectio n Initial (Do) Inter mediat e (Di) Final (Df) 1 0 100 95 93.5 0.015 0.11 31.5 0.035 1.05 0.15225 2 30 100 92 91 0.01 0.18 31.5 0.035 1.05 0.22575 3 60 100 90 89 0.01 0.22 31.5 0.035 1.05 0.26775 4 90 100 89 88.5 0.005 0.23 31.5 0.035 1.05 0.27825 5 120 100 85 84 0.01 0.32 31.5 0.035 1.05 0.37275 6 150 100 91 90 0.01 0.20 31.5 0.035 1.05 0.24675 7 180 100 88 87.5 0.005 0.25 31.5 0.035 1.05 0.29925 8 210 100 88 87 0.01 0.26 31.5 0.035 1.05 0.30975 9 240 100 89 88.5 0.005 0.23 31.5 0.035 1.05 0.27825 10 270 100 86 85 0.01 0.3 31.5 0.035 1.05 0.35175 11 300 100 85 84.5 0.005 0.35 31.5 0.035 1.05 0.36225
Table 5.5: Corner wheel path of loaded slab on left side Sl
no .
Chainag e
Dail gauge readings (mm) Differe nce Deflecti on Pavement temperatu re Temperatu re correction Seasona l Correcti on factor Correcte d deflectio n (Davg-D)2 Initial (Do) Interm ediate (Di) Final (Df) 1 0 100 96 94 0.02 0.12 29.8 0.052 1.05 0.1806 0.0188 2 30 100 92 90 0.02 0.2 29.8 0.052 1.05 0.2646 0.00285 3 60 100 90 89 0.01 0.22 29.8 0.052 1.05 0.2856 0.00104 4 90 100 88 86.5 0.015 0.27 29.8 0.052 1.05 0.3381 0.0004
5 120 100 96 94.5 0.015 0.11 29.8 0.052 1.05 0.1701 0.02187 6 150 100 91 89 0.01 0.22 29.8 0.052 1.05 0.2856 0.00104 7 180 100 88 86.5 0.015 0.27 29.8 0.052 1.05 0.3381 0.0004 8 210 100 87 85 0.02 0.3 29.8 0.052 1.05 0.3696 0.00266 9 240 100 88 86 0.02 0.28 29.8 0.052 1.05 0.3486 0.0009 10 270 100 86 85 0.01 0.3 29.8 0.052 1.05 0.3696 0.00266 11 300 100 84 82.5 0.015 0.35 29.8 0.052 1.05 0.4221 0.0108 12 330 100 84 81 0.03 0.38 29.8 0.052 1.05 0.4536 0.01838 Average : D avg: 0.318 Standard deviation 0.00862 Characteristic deflection 0.326
Table 5.6: Corner wheel path of unloaded slab on left side Sl
no .
Chainag e
Dial gauge readings (mm) Differe nce Deflectio n Pavement temperatur e Temperatur e correction Seasonal Correcti on factor Correcte d deflectio n Initial (Do) Inter mediat e (Di) Final (Df) 1 0 100 96 95.5 0.005 0.09 29.8 0.052 1.05 0.1491 2 30 100 92 91 0.01 0.18 29.8 0.052 1.05 0.2436 3 60 100 90 89 0.01 0.22 29.8 0.052 1.05 0.26775 4 90 100 88 86.5 0.015 0.27 29.8 0.052 1.05 0.32 5 120 100 96 95 0.01 0.10 29.8 0.052 1.05 0.1596 6 150 100 92 91 0.01 0.18 29.8 0.052 1.05 0.2436 7 180 100 88 87.5 0.005 0.25 29.8 0.052 1.05 0.3171 8 210 100 87 86 0.01 0.28 29.8 0.052 1.05 0.3486 9 240 100 88 87 0.01 0.26 29.8 0.052 1.05 0.3276 10 270 100 86 85 0.01 0.3 29.8 0.052 1.05 0.35175 11 300 100 83 82.5 0.005 0.35 29.8 0.052 1.05 0.4 12 330 100 84 83 0.01 0.34 29.8 0.052 1.05 0.4116
Table 5.7: Center wheel path on loaded slab of left side Sl
no .
Chainag e
Dial gauge readings (mm) Differe nce Deflecti on Pavement temperatu re Temperatu re correction Seasona l Correcti on factor Correcte d deflecti on (Davg-D)2 Initial (Do) Inter mediat e (Di) Final (Df) 1 0 100 84 81 0.03 0.38 29.8 0.052 1.05 0.4536 0.0178 2 30 100 84 82.5 0.015 0.35 29.8 0.052 1.05 0.4221 0.0104 3 60 100 83 82 0.01 0.36 29.8 0.052 1.05 0.4326 0.0126 4 90 100 91 89 0.02 0.22 29.8 0.052 1.05 0.2856 0.00118 5 120 100 86 85 0.01 0.3 29.8 0.052 1.05 0.3696 0.00267
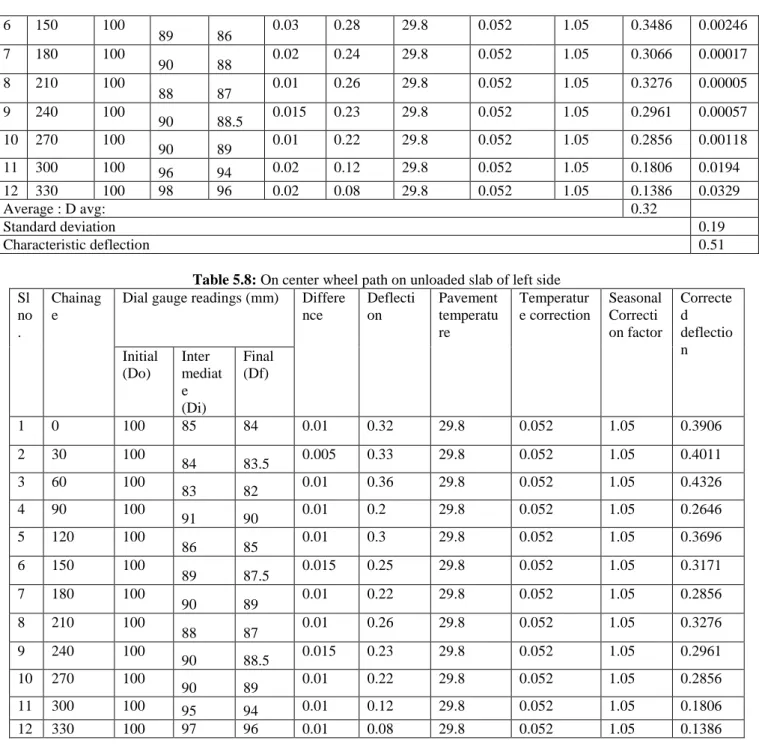
6 150 100 89 86 0.03 0.28 29.8 0.052 1.05 0.3486 0.00246 7 180 100 90 88 0.02 0.24 29.8 0.052 1.05 0.3066 0.00017 8 210 100 88 87 0.01 0.26 29.8 0.052 1.05 0.3276 0.00005 9 240 100 90 88.5 0.015 0.23 29.8 0.052 1.05 0.2961 0.00057 10 270 100 90 89 0.01 0.22 29.8 0.052 1.05 0.2856 0.00118 11 300 100 96 94 0.02 0.12 29.8 0.052 1.05 0.1806 0.0194 12 330 100 98 96 0.02 0.08 29.8 0.052 1.05 0.1386 0.0329 Average : D avg: 0.32 Standard deviation 0.19 Characteristic deflection 0.51
Table 5.8: On center wheel path on unloaded slab of left side Sl
no .
Chainag e
Dial gauge readings (mm) Differe nce Deflecti on Pavement temperatu re Temperatur e correction Seasonal Correcti on factor Correcte d deflectio n Initial (Do) Inter mediat e (Di) Final (Df) 1 0 100 85 84 0.01 0.32 29.8 0.052 1.05 0.3906 2 30 100 84 83.5 0.005 0.33 29.8 0.052 1.05 0.4011 3 60 100 83 82 0.01 0.36 29.8 0.052 1.05 0.4326 4 90 100 91 90 0.01 0.2 29.8 0.052 1.05 0.2646 5 120 100 86 85 0.01 0.3 29.8 0.052 1.05 0.3696 6 150 100 89 87.5 0.015 0.25 29.8 0.052 1.05 0.3171 7 180 100 90 89 0.01 0.22 29.8 0.052 1.05 0.2856 8 210 100 88 87 0.01 0.26 29.8 0.052 1.05 0.3276 9 240 100 90 88.5 0.015 0.23 29.8 0.052 1.05 0.2961 10 270 100 90 89 0.01 0.22 29.8 0.052 1.05 0.2856 11 300 100 95 94 0.01 0.12 29.8 0.052 1.05 0.1806 12 330 100 97 96 0.01 0.08 29.8 0.052 1.05 0.1386