ACTIONABLE PROGRAM ANALYSES FOR
IMPROVING SOFTWARE PERFORMANCE
Vom Fachbereich Informatik (FB 20) der Technischen Universität Darmstadt zur Erlangung des akademischen Grades eines
Doktor-Ingenieurs (Dr.-Ing.) genehmigte Dissertation von
Marija Selakovic, M.Sc. geboren in Uzice, Serbien.
Referenten: Prof. Dr. Michael Pradel Prof. Dr. Frank Tip
Tag der Einreichung: 10.12.2018 Tag der Disputation: 21.01.2019
Thesis written in: Darmstadt, Technische Universität Darmstadt Year thesis published in TUprints 2019
Date of the viva voce 21.01.2019
Published under CC BY-SA 4.0 International
Erklärung
Hiermit erkläre ich, dass ich die vorliegende Arbeit - abgesehen von den in ihr ausdrücklich genannten Hilfen - selbständig verfasst habe.
Darmstadt, Deutschland, Januar 2019
Marija Selakovic
Academic CV
October 2008 - June 2012
Bachelor of Information Systems and Technology, University of Belgrade October 2012 - August 2014
Master of Computer Science, University of L’Aquila and VU University Amsterdam October 2014 - January 2019
Abstract
Nowadays, we have greater expectations of software than ever before. This is followed by constant pressure to run the same program on smaller and cheaper machines. To meet this demand, the application’s performance has become the essential concern in software development. Unfortunately, many applications still suffer from performance issues: coding or design errors that lead to performance degradation. However, finding performance issues is a challenging task: there is limited knowledge on how performance issues are discovered and fixed in practice, and current performance profilers report only where resources are spent, but not where resources are wasted.
The goal of this dissertation is to investigate actionable performance analyses that help developers optimize their software by applying relatively simple code changes. To understand causes and fixes of performance issues in real-world software, we first present an empirical study of 98 issues in popular JavaScript projects. The study illustrates the prevalence of simple and recurring optimization patterns that lead to significant performance improvements. Then, to help developers optimize their code, we propose twoactionable performance analyses that suggest optimizations based on reordering opportunities and method inlining. In this work, we focus on optimizations with four key properties. First, the optimizations are effective, that is, the changes suggested by the analysis lead to statistically significant performance improvements. Second, the optimizations areexploitable, that is, they are easy to understand and apply. Third, the optimizations are recurring, that is, they are applicable across multiple projects. Fourth, the optimizations areout-of-reach for compilers, that is, compilers can not guarantee that a code transformation preserves the original semantics. To reliably detect optimization opportunities and measure their performance benefits, the code must be executed with sufficient test inputs. The last contribution complements state-of-the-art test generation techniques by proposing a novel automated approach for generating effective tests for higher-order functions.
We implement our techniques in practical tools and evaluate their effectiveness on a set of popular software systems. The empirical evaluation demonstrates the potential of actionable analyses in improving software performance through relatively simple optimization opportunities.
Zusamenfassung
Die heutigen Erwartungen an Software sind größer als je zuvor. Vor allem der Druck bestehende Programme auf günstigerer und weniger leistungsfähiger Hardware auszuführen, lässt Performance zum zentralen Anliegen in der Softwareentwicklung werden. Und doch haben viele Anwendungen Performanceprobleme, also Design-oder Programmierfehler, die zu Leistungseinbußen führen. Eben jene Performan-ceprobleme zu finden, ist allerdings eine anspruchsvolle Aufgabe: Das Wissen, wie Performanceprobleme in der Praxis gefunden und behoben werden ist begrenzt und heutige Profiler zeigen nur auf, wo Ressourcen ausgegeben, aber nicht wo sie verschwendet werden.
Ziel dieser Arbeit ist es, praktisch umsetzbar Performanceanalysen zu unter-suchen, die Entwicklern helfen ihre Software durch relative einfache Änderungen am Quelltext zu optimieren. Um besser zu verstehen wie Performanceproblemen verursacht und behoben werden, stellen wir zunächst eine empirische Studie über 98 Probleme in weit verbreiteten JavaScript-Projekten vor. Die Studie zeigt einfache und wiederkehrende Optimierungsmuster auf, die zu signifikanten Performance-verbesserungen führen. Darauf aufbauend stellen wir zwei praktisch umsetzbar Performanceanalysen vor, die Entwicklern helfen ihre Programme durch Reorder-ing und durch Methoden-InlinReorder-ing zu optimieren. Dabei fokussieren wir uns auf Optimierungen mit vier zentralen Eigenschaften. Erstens sind die Optimierungen effektiv, das heißt die von der Analyse vorgeschlagenen Änderungen führen zu statistisch signifikanten Leistungssteigerungen. Zweitens sind die Optimierungen nutzbar, das heißt sie sind leicht zu verstehen und anzuwenden. Drittens sind die Optimierungen wiederkehrend, das heißt projektübergreifend anwendbar. Viertens sind die Optimierungen unerreichbar für Compiler, das heißt Compiler können nicht garantieren, dass eine Code-Transformation semantikerhaltend ist. Um die Opti-mierungsmöglichkeiten zuverlässig zu erkennen und deren Leistungsverbesserung messen zu können, muss der Code schließlich mit ausreichend Testeingaben ausge-führt werden. Der letzte Beitrag in dieser Arbeit ergänzt Testgenerierungstechniken auf dem Stand der Technik durch einen neuen, automatisierten Ansatz zur Gener-ierung effektiver Tests für Funktionen höherer Ordnung.
Wir implementierung die genannten Techniken in praxistauglichen Werkzeugen und bewerten deren Effektivität auf einer Reihe weit verbreiteter Softwaresys-teme. Die empirische Auswertung zeigt, dass praktisch umsetzbar Performance-analysen in der Lage sind die Leistung von Software durch relativ einfache Opti-mierungsvorschläge zu verbessern.
Acknowledgments
Doing PhD has been a truly life-changing experience for me and it would not have been possible to do without the support and guidance that I received from many people.
Firstly, I would like to say a very big thank you to my advisor Prof. Michael Pradel for his continuous support during my PhD studies and research, patience, encouragement, and immense knowledge. Without his guidance on conducting research projects and constant feedback, this PhD would not have been achievable. Besides my advisor, I would like to thank the rest of my thesis committee: Prof. Frank Tip, Prof. Mira Mezini, Prof. Felix Wolf and Prof. Christian Reuter, for their insightful comments, interesting questions, and support.
My special thanks also go to great researchers: Michael Barnett, Madan Musu-vathi, Todd Mytkowicz, and Andrew Begel, for offering me summer internships in their groups at Microsoft Research and leading me working on diverse and exciting projects. It was an amazing opportunity to work in such a stimulating and produc-tive environment.
I also would like to thank my fellow labmates: Andrew, Jibesh, Christian and Daniel for all interesting, philosophical and valuable discussions and the fun we had in the last four and a half years.
Last but not least, I would like to thank my husband Jovan, my family and friends back home in Serbia and across the world for their support, patience, and love all these years.
Contents
1 Introduction 1
1.1 Terminology . . . 2
1.2 Challenges and Motivation . . . 2
1.3 Contributions and Outline . . . 4
1.4 List of Publications . . . 6
2 Performance Issues and Optimizations in JavaScript 7 2.1 Methodology . . . 8
2.1.1 Subject Projects . . . 9
2.1.2 Selection of Performance Issues . . . 9
2.1.3 Performance Measurement . . . 11
2.1.4 JavaScript Engines . . . 11
2.2 Root Causes of Performance Issues . . . 12
2.2.1 API-related Root Causes . . . 12
2.2.2 Other Root Causes . . . 14
2.3 Complexity of Optimizations . . . 16
2.3.1 Complexity of Changes . . . 16
2.3.2 Change in Complexity of Program . . . 17
2.4 Performance Impact of Optimizations . . . 18
2.5 Consistency Across Engines and Versions . . . 19
2.5.1 Consistency Across Engines . . . 19
2.5.2 Consistency Across Versions of an Engine . . . 20
2.6 Recurring Optimization Patterns . . . 21
2.6.1 Prevalence of Recurring Optimization Patterns . . . 21
2.6.2 Preconditions For Automatic Transformation . . . 24
2.7 Threats to Validity . . . 25
2.8 Summary . . . 26
3 Performance Profiling for Optimizing Orders of Evaluation 27 3.1 Problem Statement . . . 29
3.1.1 Terminology . . . 29
3.1.2 Reordering Opportunities . . . 30
3.1.3 Challenges for Detecting Reordering Opportunities . . . 30
3.2 Analysis for Detecting Reordering Opportunities . . . 31
3.2.1 Gathering Runtime Data . . . 31
3.3 Safe Check Evaluation . . . 38
3.3.1 Tracking Side Effects . . . 38
3.3.2 Undoing Side Effects . . . 39
3.4 Implementation . . . 39
3.5 Evaluation . . . 40
3.5.1 Experimental Setup . . . 40
3.5.2 Detected Reordering Opportunities . . . 42
3.5.3 Profiling Overhead . . . 44
3.5.4 Estimated vs. Actual Cost . . . 45
3.5.5 Guaranteeing That Optimizations are Semantics-Preserving . . . 45
3.6 Summary . . . 46
4 Cross Language Optimizations in Big Data Systems 47 4.1 Background . . . 48
4.1.1 Execution of a Script . . . 49
4.1.2 Intrinsics . . . 49
4.1.3 Compiler/Optimizer Communication . . . 49
4.2 Profiling Infrastructure for Data Centers . . . 49
4.2.1 Job Artifacts . . . 50
4.2.2 Static Analysis . . . 51
4.3 Evaluation . . . 52
4.3.1 Experimental Setup . . . 53
4.3.2 Native vs. Non-Native Time . . . 54
4.3.3 Optimizable Job Vertices . . . 55
4.3.4 Potentially Optimizable Job Vertices . . . 55
4.4 Case Studies . . . 58
4.4.1 Optimizations with Effects on Job Algebra . . . 59
4.4.2 Optimizations without Effects on Job Algebra . . . 59
4.5 Threats to Validity . . . 61
4.6 Summary . . . 61
5 Test Generation of Higher-Order Functions in Dynamic Languages 63 5.1 Challenges and Motivating Examples . . . 65
5.1.1 Array.prototype.map . . . 66
5.1.2 Promises . . . 66
5.2 Framework for Testing Higher-Order Functions . . . 68
5.2.1 Discovery Phase: Inferring Callback Positions . . . 70
5.2.2 Test Generation Phase . . . 71
5.3 Test Oracle: Differential Testing of Polyfills . . . 76
5.4 Evaluation . . . 78
5.4.1 Experimental Setup . . . 78
5.4.2 Effectiveness in Finding Behavioral Differences . . . 80
5.4.3 Classification of Behavioral Differences . . . 80
5.4.4 Array Polyfills Generated by Mimic . . . 81
CONTENTS
5.4.6 Effectiveness in Covering Code Under Test . . . 85
5.4.7 Efficiency . . . 86
5.5 Summary . . . 87
6 Related Work 89 6.1 Studies of Performance Issues . . . 89
6.2 Approaches to Detect Performance Bottlenecks . . . 89
6.3 Efficiency of JavaScript Engines . . . 92
6.3.1 JIT Compilation . . . 92
6.3.2 Performance Benchmarks . . . 93
6.4 Test Generation . . . 94
6.5 Other Program Analyses for JavaScript . . . 96
6.6 Optimizations of Big Data Jobs . . . 97
7 Conclusion 99 7.1 Summary of Contributions . . . 99
7.2 Future Research Directions . . . 100
List of Figures
1.1 Performance issue from Underscore library (pull request 1708). . . . 2
1.2 Connections between individual contributions and research challenges. 6 2.1 Root causes of performance issues. . . 13
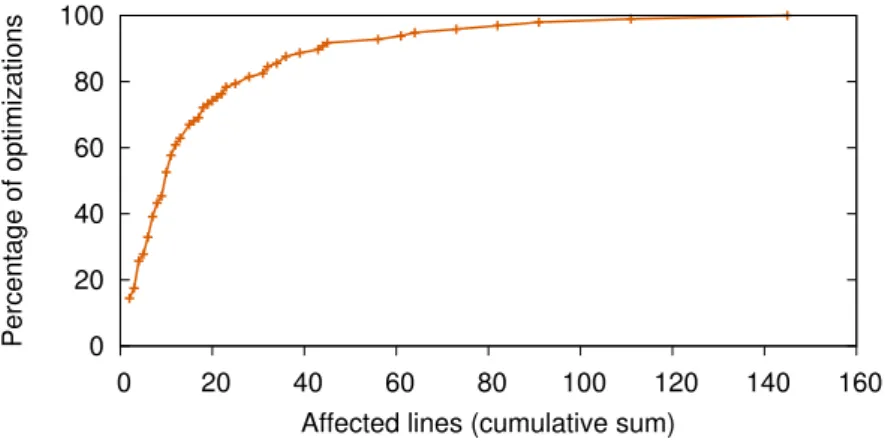
2.2 Number of source code lines that are affected by optimizations. . . 16
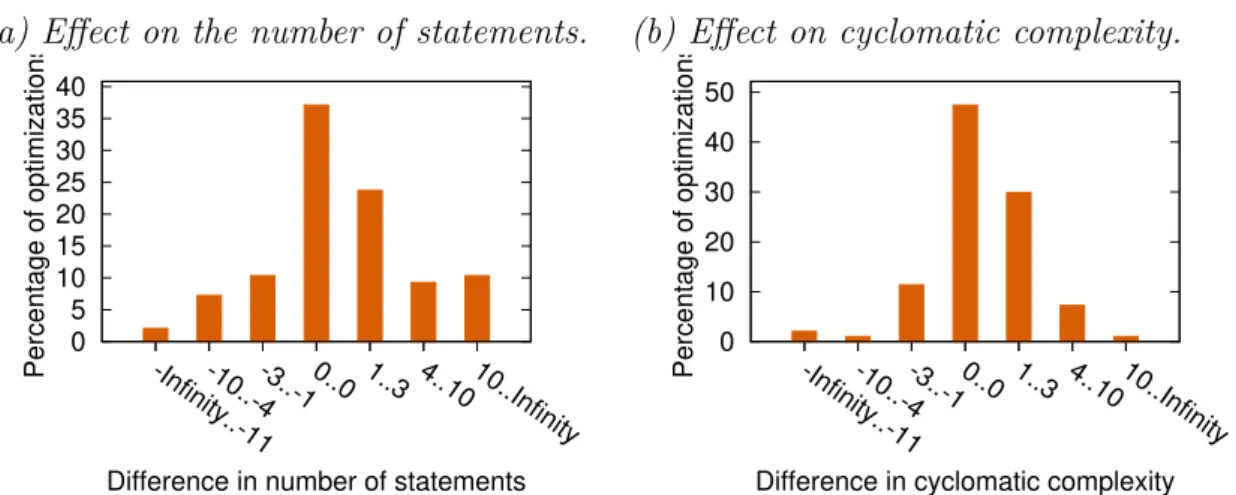
2.3 Effect of applying an optimization on the cyclomatic complexity. . 17
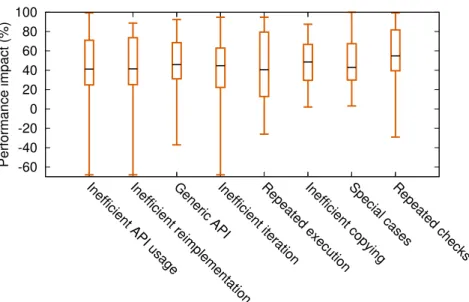
2.4 Performance improvements per root cause. . . 18
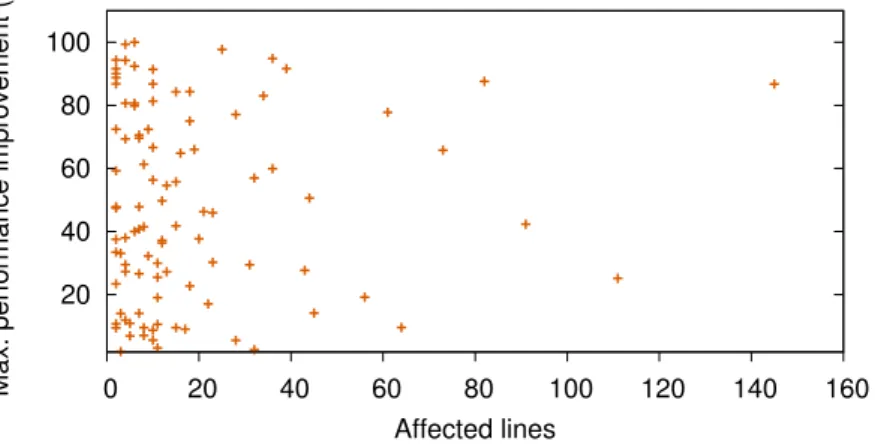
2.5 Relation between number of lines and achieved performance improve-ment. . . 19
2.6 Performance improvement of changes in different versions of engines. 21 2.7 Example of prototype overriding . . . 25
3.1 Performance issues from Underscore.string (pull request 471) and Socket.io (pull request 573). . . 28
3.2 Overview of DecisionProf. . . 31
3.3 Preprocessed logical expression from Figure 3.1a. . . 32
3.4 Preprocessed switch statement from Figure 3.1c. . . 32
3.5 Example of finding the optimal order of checks. . . 36
3.6 Changes in program behavior due to side effects. . . 38
3.7 Correlation between estimated vs. actual cost. . . 45
4.1 Examples of SCOPE programs. . . 48
4.2 Overview of the static analysis. . . 51
4.3 Time spent in native vs. non-native vertices. . . 54
4.4 Optimizable job vertices. . . 56
4.5 Potentially optimizable job vertices . . . 58
4.6 Relevance of .NET framework method types (cosmos11). . . 58
4.7 Case Study A . . . 60
4.8 Case Study F . . . 60
5.1 Implementation of Array.prototype.map from polyfill.io. . . 65
5.2 Examples of map method. . . 66
5.3 Examples of promise calls. . . 67
5.4 Overview of LambdaTester. . . 69
5.5 Examples of generated callbacks. . . 72
LIST OF FIGURES 5.7 Example of LambdaTester-generated test that exposes a behavioral
difference in the Q library. . . 85 5.8 Example of a behavioral difference found in the polyfill.io library. . 86
List of Tables
2.1 Projects used for the study. . . 9
2.2 JavaScript engines used to test performance impact. . . 12
2.3 Performanc impact of optimizations in V8 and SpiderMoneky. . . . 20
2.4 Recurring optimization patterns. . . 23
2.5 Instances of recurring optimization patterns. . . 24
2.6 Pre-conditions for applying recurring optimization patterns. . . 25
3.1 Cost-value histories from executions of Figure 3.1a. . . 34
3.2 Projects used for the evaluation of DecisionProf. . . 41
3.3 Examples of reordering opportunities found by DecisionProf. . . 43
4.1 Analyzed jobs and their CPU time. . . 53
4.2 Most relevant .NET Framework methods per data center. . . 57
4.3 Summary of case studies. The reported changes are percent improve-ments in CPU time and throughput. . . 59
5.1 Benchmarks used for the evaluation. . . 79
5.2 Test generation approaches used for the evaluation. . . 79
5.3 Comparison of different test generation approaches. . . 81
5.4 Behavioral differences found by Cb-Empty and Cb-Quick approaches. 82 5.5 Behavioral differences found by Cb-Mined and Cb-Writes approaches. 83 5.6 Behavioral differences in array polyfills generated by Mimic. . . 83
5.7 Statement coverage for 1,000 generated tests. . . 87
5.8 Time to generate 1,000 tests per API. . . 88
6.1 Approaches to detect performance issues. . . 90
List of Algorithms
1 Algorithm to find optimal order of logical expression. . . 35 2 Algorithm to infer callback position . . . 70 3 Test generation algorithm . . . 75
Introduction
Regardless of the domain, software performance is one of the most important aspects of software quality: it is important to ensure an application’s responsiveness, high throughput, efficient loading, scaling, and user satisfaction. Poorly performing software wastes computational resources, affects perceived quality and increases maintenance cost. Furthermore, a web application that is perceived “slow” can result in an unsatisfied customer who may opt for a competitor’s better performing product, resulting in loss of revenue.
To improve software performance, three kinds of approaches have been proposed:
• Performance profiling. Developers conduct performance testing in the form of CPU [GKM82] and memory profiling [JSSC15] to identify code locations that use the most resources. However, traditional profiling techniques have at least two limitations: they show where the resources are spent, but not how to optimize the program. Furthermore, they often introduce large overheads, which may affect the software’s behavior and reduce the accuracy of the collected information.
• Compiler optimizations. Compiler optimizations [ASU86] automatically trans-form a program into a semantically equivalent, yet more efficient program. However, many powerful optimization opportunities are beyond the capabilities of a typical compiler. The main reason for this is that the compiler cannot ensure that a program transformation preserves the semantics, a problem that is especially relevant for hard-to-analyze languages, such as JavaScript. For example, a just-in-time (JIT) compiler applies speculative optimizations: it uses profiling information to make assumptions about possible input values.
• Manual tuning. Finally, developers often rely on manual performance tun-ing [HNS09] (e.g., manually optimiztun-ing code fragments or modifytun-ing software and hardware configurations), which can be effective but it is time consuming and often requires expert knowledge.
The need for improving software performance is never-ending. Limitations of existing performance analyses pose several research challenges and motivate the need for techniques that provide advice on how to improve software performance. This dissertation addresses some of those limitations and proposes new approaches to help developers optimize their code with little effort.
_.map = function(obj, iterator, context) {
var results = [];
if (obj == null) return results;
_.each(obj, function(value, index, list) { results.push(iterator(value, index, list)); });
return results; };
(a) Performance issue.
_.map = function(obj, iterator, context) {
if (obj == null) return [];
var keys = _.keys(obj);
var length = keys.length, currentKey;
var results = Array(length);
for (var index = 0; index < length; index++) { currentKey = keys[index];
results[index] = iterator(obj[currentKey], currentKey, obj); }
return results; };
(b) Optimized code.
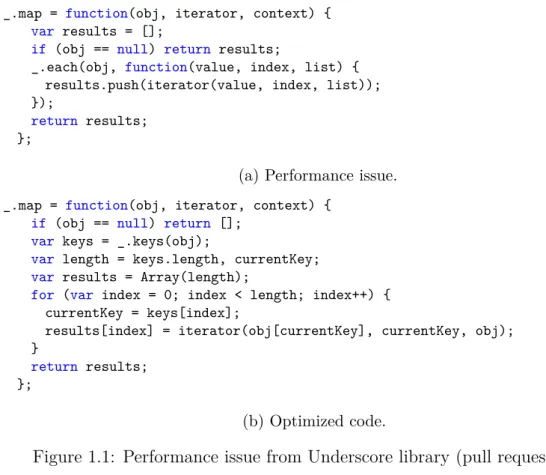
Figure 1.1: Performance issue from Underscore library (pull request 1708).
1.1
Terminology
In this work, we use the termactionable analysis to denote an analysis that demon-strates the impact of implementing suggested optimization opportunities. In par-ticular, an actionable analysis provides evidence of performance improvement (e.g., speedup in execution time or reduced memory consumption) or shows additional compiler optimizations triggered by applying a suggested optimization. Furthermore, the term optimization refers to a source code change that a developer applies to improve the performance of a program, and compiler optimization refers to an automatically applied transformation by a compiler.
1.2
Challenges and Motivation
Recent research shows that relatively small changes can make a program signifi-cantly more efficient [JSS+12]. However, exploring and exploiting such changes is a challenging task. To illustrate the potential of small code transformations on software performance, Figure 1.1 illustrates a performance issue and an associated optimization reported in Underscore, one of the most popular JavaScript utility libraries.
Figure 1.1a shows the initial implementation of the mapmethod, which produces a new array of values by mapping the value of each property in an object through a transformation function iterator. To iterate over object properties, the method
1.2. CHALLENGES AND MOTIVATION
uses an internal _.each function. However, a more efficient way is to first compute the object properties using thekeys function, and then iterate through them with a traditional for loop. The optimized version of the map method is shown in Figure 1.1b. This optimization improves performance because JavaScript engines are able to specialize the code in the for loop and execute it faster.
The optimization in Figure 1.1 has four interesting properties. First, the op-timization is effective, that is, the optimized method is on average 20% faster than the original one. Second, the optimization is exploitable, that is, the code transformation affects few lines of code and is easy to apply. Third, the optimization isrecurring, that is, developers of real-world applications can apply the optimization across multiple projects. Fourth, the optimization is out-of-reach for compilers, that is, due to the dynamism of the JavaScript language, a compiler can not guarantee that the code transformation is always semantics preserving.
Detecting such optimization opportunities in a fully automatic way poses at least three challenges:
• C1: Understanding performance problems and how developers address them. Despite the overall success of optimizing compilers, developers still apply manual optimizations to address performance issues in their code. The first step in building actionable performance analyses is to understand the common root causes of performance issues and code patterns that developers use to optimize their code. The next step is to identify optimization patterns amenable for actionable performance analyses. Our intuition is that developers are more likely to apply code changes that improve the application’s performance but do not sacrifice code readability and maintainability. An example of such an optimization is already given in Figure 1.1.
• C2: Analysis of program behavior to detect instances of performance issues. Based on patterns of common performance issues, the next step is to develop techniques to find code locations suffering from those issues and to suggest beneficial optimizations. For actionable analyses, we focus on the optimiza-tion opportunities with the four aforemenoptimiza-tioned characteristics: effective, exploitable, recurring and out-of-reach for compilers. To identify instances of known code patterns, there have been various approaches based on either static or dynamic program analysis or the combination of both. The key challenge is to develop an analysis that reports as many true optimizations as possible, while keeping the number of false positives and false negatives as low as possible.
• C3: Exercising code transformations with enough input. Once the actionable analysis suggests an optimization opportunity, the next step is to ensure the performance benefit of a code transformation by exercising the program with a wide range of inputs. One approach is to use manually written tests to check whether a code change brings a statistically significant improvement. However, manual tests may miss some of the important cases, which can lead to invalid conclusions. An alternative approach is to use automatically generated tests. Despite being effective in detecting various programming errors, test
generation approaches have limited capabilities in generating complex inputs. For example, the map method in Figure 1.1 expects three arguments: an object, an iterator function, and an optional context object. Unfortunately, generating effective tests for higher-order functions (e.g., functions that receive callbacks), such as map, is a largely unsolved problem.
Thesis Statement This dissertation supports the thesis that it is possible to create actionable program analyses that help developers significantly improve the performance of their software by applying effective, exploitable, recurring, and out-of-reach for compilers optimization opportunities.
We propose novel automated approaches to support developers in optimizing their programs. The key idea is to not only pinpoint where and why time is spent, but also to provide actionable advice on how to improve the application’s performance.
1.3
Contributions and Outline
In this section, we highlight individual contributions of the proposed approaches and how they correlate with each other. Furthermore, Figure 1.2 illustrates the connection between approaches and research challenges they address.
Study of Performance Issues and Optimizations As JavaScript is becoming increasingly popular, the performance of JavaScript programs is crucial to ensure the responsiveness and energy-efficiency of thousands of programs. Yet, little is known about performance issues that developers face in practice and how they address these issues. Chapter 2 presents the first empirical study on real-world performance issues and optimizations in JavaScript code. We identify eight root causes of issues and show that inefficient usage of APIs is the most prevalent root cause. Furthermore, we find that most issues are addressed by optimizations that modify only a few lines of code, without significantly affecting the complexity of the source code. Finally, we observe that many optimizations are instances of patterns applicable across multiple projects. Based on these results, we discuss the challenges of applying recurring optimizations in a fully automatic way and advocate for approaches that help developers optimize their code.
Contributions. This work addresses the first challenge (C1) and contributes in understanding real-world JavaScript performance issues and optimizations that developers apply to fix them. Furthermore, it provides a documented set of 98 reproduced issues1 that may serve as a reference point for work on finding and fixing performance bottlenecks in JavaScript applications. Finally, we show evidence that developers could benefit from tools and techniques to apply recurring optimization patterns and to reliably measure performance improvements.
An Actionable Performance Profiler for Optimizing Orders of Evalua-tions As presented in Chapter 2, many performance optimizations are simple code
1
1.3. CONTRIBUTIONS AND OUTLINE
changes that do not affect program complexity but provide significant performance improvements. In Chapter 3, we present DecisionProf, the first dynamic analysis that finds optimization opportunities in inefficient orders of evaluations. Decision-Prof computes all possible orders in logical expressions and switch statements, finds the optimal order, and suggests a reordering opportunity to the developer only if it yields a statistically significant performance improvement. The approach provides actionable advice: it suggests a code transformation to exploit an optimization
opportunity.
Contributions. DecisionProf addresses the second challenge (C2), and to the best of our knowledge, it is the first profiler that detects inefficiently ordered subexpres-sions in logical expressubexpres-sions and switch statements. Furthermore, it suggests simple refactorings to optimize the code. We implement the approach in a practical tool for JavaScript and show that applying suggested optimizations leads to performance improvements in widely used JavaScript projects and popular benchmarks.
Cross-Language Optimizations in Big Data Systems Building scalable big data programs currently requires programmers to combine relational code (SQL) with non-relational code (Java, C# or Scala). This programming model greatly simplifies the distribution and fault-tolerance of big data processing. However, the presence of cross-language interaction poses additional challenges for profiling and optimizing big data jobs. In Chapter 4, we present a profiling infrastructure to understand key performance bottlenecks in SCOPE, a modern data-processing system developed at Microsoft. We find that programs with non-relational code take between 45-70% of the data center’s CPU time. To reduce cross-language interaction, we propose a static analysis to find optimization opportunities based on method inlining. Method inlining is a simple code transformation that replaces the function call in a predicate with a function body. By doing this, the logic of the function becomes visible to the compiler, resulting in more compiler optimizations. The output of the static analysis isactionable: it suggests only inlining opportunities that trigger additional compiler optimizations.
Contributions. This work addresses the second challenge (C2), and it is the first approach that demonstrates the potential of cross-language optimizations in big-data jobs. We present a profiling infrastructure that enables analyzing millions of jobs without introducing any additional overhead. Furthermore, we show the effectiveness of a relatively simple code transformation, based onmethod inlining, in improving the performance of a big-data system.
Test Generation for Higher-Order Functions To reliably measure the per-formance impact of applied optimizations, the optimized program must be executed with sufficient test inputs. Unfortunately, current test generation techniques are challenged by higher-order functions in dynamic languages, such as JavaScript functions that receive callbacks. In particular, existing test generators suffer from the unavailability of statically known type signatures, do not provide functions or provide only trivial functions as inputs, and ignore callbacks triggered by the code under test. Chapter 5 presentsLambdaTester, a test generation technique for higher-order functions in dynamic languages. The approach automatically infers
Empirical study (Chapter 2) DecisionProf (Chapter 3) Cross-language optimizations (Chapter 4) LambdaTester (Chapter 5) C1 C2 C3
Figure 1.2: Connections between individual contributions and research challenges. at what argument position a method under test expects a callback, generates and iteratively improves callback functions given as input to this method, and uses novel test oracles that check whether and how callback functions are invoked. We illustrate the effectiveness of the approach by finding correctness problems in many polyfill implementations.
Contributions. LambdaTester addresses the third challenge (C3) and contributes to state-of-the-art test generation approaches in at least two ways: it generates effective tests for higher-order functions written in dynamic languages and improves the generation of callbacks that modify program state in non-trivial ways.
The remaining chapters of this dissertation present related work (Chapter 6) and discusses future work and conclusions (Chapter 7).
1.4
List of Publications
This dissertation is based on several peer-reviewed publications as listed below:
• [SP16] Marija Selakovic and Michael Pradel. “Performance issues and opti-mizations in JavaScript: An empirical study.” In International Conference on Software Engineering (ICSE).2016.
• [SGP17] Marija Selakovic, Thomas Glaser and Michael Pradel. “An actionable performance profiler for optimizing the order of evaluations.” In International Symposium on Software Testing and Analysis (ISSTA). 2017
• [SBMM18] Marija Selakovic, Michael Barnett, Madan Musuvathi, Todd Mytkow-icz. “Cross-language optimizations in Big data systems: A case study of SCOPE.”In International Conference on Software Engineering (ICSE-SEIP). 2018.
• [MS18] Marija Selakovic, Michael Pradel, Rezwana Karim, Frank Tipp. “Test generation for higher-order functions in dynamic languages.” In Conference on Object-Oriented Programming, Systems, Languages, and Applications
(OOP-SLA). 2018.
• [AGM+17] Esben Andreasen, Liang Gong, Anders Møller, Michael Pradel, Marija Selakovic, Koushik Sen, and Cristian-Alexandru Staicu. “A survey of dynamic analysis and test generation for JavaScript.” ACM Computing Surveys. 2017.
Performance Issues and
Optimizations in JavaScript
The first step in developing actionable performance analyses is to understand real-world performance issues that developers face in practice and how they address those issues. In this chapter, we introduce an empirical study on performance issues and optimizations in real-world JavaScript projects. We choose JavaScript because it has become one of the most popular programming languages. It is used not only for client-side web applications, but also for server-side applications, mobile applications, and even desktop applications. The development of the language has been enabled by significant improvements of JavaScript engines in recent years, e.g., due to highly optimizing just-in-time (JIT) compilers [GES+09, LV10, HG12, CASP13, ACS+14]. Despite the effectiveness of JIT compilation, developers still manually apply optimizations to address performance issues in their code, and future improvements of JavaScript engines are unlikely to completely erase the need for manual performance optimizations.
However, little is currently known about performance issues and optimizations in real-world JavaScript projects. This chapter addresses this problem and asks the following research questions:
• RQ 1: What are the main root causes of performance issues in JavaScript?
• RQ 2: How complex are the changes that developers apply to optimize their programs?
• RQ 3: What is the performance impact of such optimizations?
• RQ 4: Are optimizations valid across JavaScript engines, and how does the performance impact of optimizations evolve over time?
• RQ 5: Are there recurring optimization patterns, and can they be applied automatically?
Answers to these questions help improve JavaScript’s performance by providing at least three kinds of insights. First, application developers benefit by learning from mistakes made by others. Second, developers of performance-related program analyses and profiling tools benefit from better understanding what kinds of problems exist in practice and how developers address them. Third, developers of JavaScript
engines benefit from learning about recurring bottlenecks that an engine may want to address and by better understanding how performance issues evolve over time.
We address these question by studying 98 fixed issues that developers have documented in bug tracking systems. The issues come from 16 JavaScript projects, including both client-side and server-side code, popular libraries, and widely used application frameworks.
Our main findings are the following:
• The most prevalent root cause of performance issues (52%) is that JavaScript provides APIs that are functionally equivalent but have different performance, and that developers often use these APIs in a suboptimal way. This finding suggests that developers need guidance in choosing among such APIs, and that future language and API designs may want to reduce the amount of redundancy in APIs.
• Many optimizations affect a small number of source code lines: 28% and 73% of all optimizations affect less than 5 and 20 lines, respectively.
• Many optimizations do not significantly affect the complexity of the source code: 37.11% of all optimizations do not change the number of statements and 47.42% of all optimizations do not change the cyclomatic complexity [McC76] of the program. This finding challenges the common belief that improving the performance of a program often implies reducing its understandability and maintainability [Knu74, DRSS01].
• Only 42.68% of all “optimizations” provide consistent performance improve-ments across all studied JavaScript engines. A non-negligible part (15.85%) of changes even degrades performance on some engines. These findings reveal a need for techniques to reliably measure performance and to monitor the performance effect of changes across multiple execution environments.
• Many optimizations are instances of recurring patterns that can be re-applied within the same project and even across projects: 29 of the 98 studied issues are instances of patterns that reoccur within the study. Furthermore, we find 139 previously unreported instances of optimization patterns in the studied projects.
• Most optimizations cannot be easily applied in a fully automatic way, primarily due to the dynamism of JavaScript. We identify five kinds of preconditions for safely applying recurring optimization patterns. Statically checking whether these preconditions are met is a challenge. Our results suggest a need for tools that help developers apply recurring optimizations.
2.1
Methodology
This section summarizes the subject projects we use in the empirical study, our criteria for selecting performance issues, and our methodology for evaluating the performance impact of the optimizations applied to address these issues.
2.1. METHODOLOGY
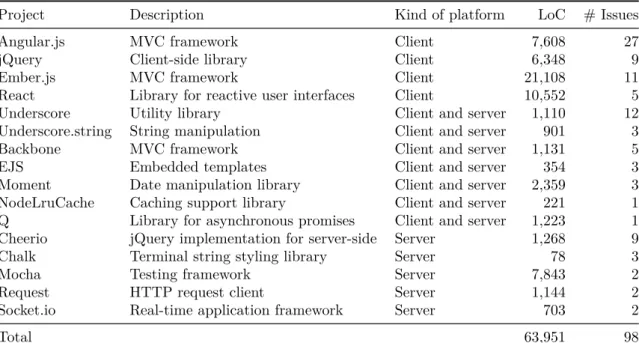
Table 2.1: Projects used for the study and the number of reproduced issues per project.
Project Description Kind of platform LoC # Issues
Angular.js MVC framework Client 7,608 27
jQuery Client-side library Client 6,348 9
Ember.js MVC framework Client 21,108 11
React Library for reactive user interfaces Client 10,552 5 Underscore Utility library Client and server 1,110 12 Underscore.string String manipulation Client and server 901 3
Backbone MVC framework Client and server 1,131 5
EJS Embedded templates Client and server 354 3
Moment Date manipulation library Client and server 2,359 3 NodeLruCache Caching support library Client and server 221 1 Q Library for asynchronous promises Client and server 1,223 1 Cheerio jQuery implementation for server-side Server 1,268 9 Chalk Terminal string styling library Server 78 3
Mocha Testing framework Server 7,843 2
Request HTTP request client Server 1,144 2
Socket.io Real-time application framework Server 703 2
Total 63,951 98
2.1.1
Subject Projects
We study performance issues from widely used JavaScript projects that match the following criteria:
• Project type. We consider both node.js projects and client-side frameworks and libraries.
• Open source. We consider only open source projects to enable us and others to study the source code involved in the performance issues.
• Popularity. For node.js projects, we select modules that are the most depended-on modules in the npm repository.1 For client-side projects, we select from the most popular JavaScript projects on GitHub.
• Number of reported bugs. We focus on projects with a high number of pull requests (≥100) to increase the chance to find performance-related issues. Table 1 lists the studied projects, their target platforms, and the number of lines of JavaScript code. Overall, we consider 16 projects with a total of 63,951 lines of code.
2.1.2
Selection of Performance Issues
We select performance issues from bug trackers as follows: 1
1. Keyword-based search or explicit labels. One of the studied projects, Angular.js, explicitly labels performance issues, so we focus on them. For all other projects, we search the title, description, and comments of issues for performance-related keywords, such as “performance”, “optimization”, “responsive”, “fast”, and “slow”.
2. Random selection or inspection of all issues. For the project with explicit performance labels, we inspect all such issues. For all other projects, we randomly sample at least 15 issues that match the keyword-based search, or we inspect all issues if there are less than 15 matching issues.
3. Confirmed and accepted optimizations. We consider an optimization only if it has been accepted by the developers of the project and if it has been integrated into the code repository.
4. Reproducibility. We study a performance issue only if we succeed in executing a test case that exercises the code location l reported to suffer from the performance problem. We use of the following kinds of tests:
• A test provided in the issue report that reproduces the performance problem.
• A unit test published in the project’s repository that exercises l.
• A newly created unit test that calls an API function that triggers l.
• A newly created microbenchmark that contains the code at l, possibly prefixed by setup code required to exercise the location.
5. Split changes into individual optimizations. Some issues, such as complaints about the inefficiency of a particular function, are fixed by applying multiple independent optimizations. Because our study is about individual perfor-mance optimizations, we consider such issues as multiple issues, one for each independent optimization.
6. Statistically significant improvement. We apply the test that triggers the performance-critical code location to the versions of the project before and after applying the optimization. We measure the execution times and keep only issues where the optimization leads to a statistically significant performance improvement.
We create a new unit test or microbenchmark for the code location l only if the test is not provided or published in the project’s repository. The rationale for focusing on unit tests and microbenchmarks is twofold. First, JavaScript developers extensively use microbenchmarks when deciding between different ways to implement some functionality.2 Second, most projects we study are libraries or frameworks, and any measurement of application-level performance would be strongly influenced by our choice of the application that uses the library or framework. Instead, focusing
2.1. METHODOLOGY
on unit tests and microbenchmarks allows us to assess the performance impact of the changed code while minimizing other confounding factors.
In total, we select and study 98 performance issues, as listed in the last column of Table 2.1.
2.1.3
Performance Measurement
Reliably measuring the performance of JavaScript code is a challenge, e.g., due to the influence of JIT compilation, garbage collection, and the underlying operating system. To evaluate to what extent an applied optimization affects the program’s performance we adopt a methodology that was previously proposed for Java programs [GBE07]. In essence, we repeatedly execute each test in NVM newly launched VM instances. At first, we perform NwarmUp test executions in each VM instance to warm up the JIT compiler. Then, we repeat the test Nmeasure more times and measure its execution times. To determine whether there is a statistically significant difference in execution time between the original and the optimized program we compare the sets of measurements Mbefore and Mafter from before and after the optimization. If and only if the confidence intervals ofMbefore andMafter do not overlap, we consider the difference to be statistically significant. Based on preliminary experiments we use NwarmUp = 5, Nmeasure = 10, and NVM = 5, because these parameters repeat measurements sufficiently often to provide stable performance results. We set the confidence level to 95%. Because very short execution times cannot be measured accurately, we wrap each test in a loop so that it executes for at least 5ms. All experiments are performed on an Intel Core i7-4600U CPU (2.10GHz) machine with 16GB of memory running Ubuntu 14.04 (64-bit).
2.1.4
JavaScript Engines
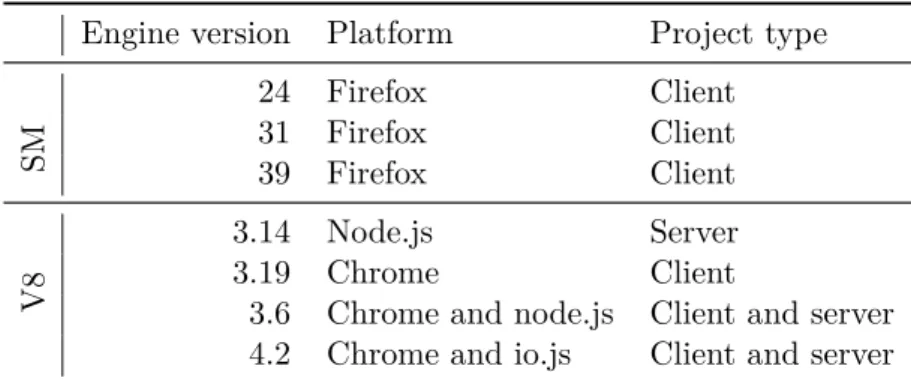
JavaScript engines evolve quickly, e.g., by adding novel JIT optimizations [GES+09, LV10, HG12, CASP13, ACS+14] or by adapting to trends in JavaScript development3. To understand how the performance impact of an optimization evolves over time, we measure the performance of tests on multiple engines and versions of engines. Table 2.2 lists the engines we consider. We focus on the two most popular engines: V8, which is used, e.g., in the Chrome browser and the node.js platform, and SpiderMonkey, which is used, e.g., in the Firefox browser and the GNOME desktop environment. For each engine, we use at least three different versions, taking into account only versions that are published after introducing JIT compilation, and including the most recent published version. All considered versions are published in different years and we take engines for which their version number indicates that the engine potentially introduces significant changes compared to the previous selected version. Table 2.2 lists for each engine which types of projects it supports. We execute the tests of a project on all engines that match the kind of platform (client or server), as listed in column three of Table 2.1.
3
Table 2.2: JavaScript engines used to test performance impact of optimizations (SM = SpiderMonkey).
Engine version Platform Project type
24 Firefox Client
31 Firefox Client
SM 39 Firefox Client
3.14 Node.js Server
3.19 Chrome Client
V8 3.6 Chrome and node.js Client and server 4.2 Chrome and io.js Client and server
2.2
Root Causes of Performance Issues
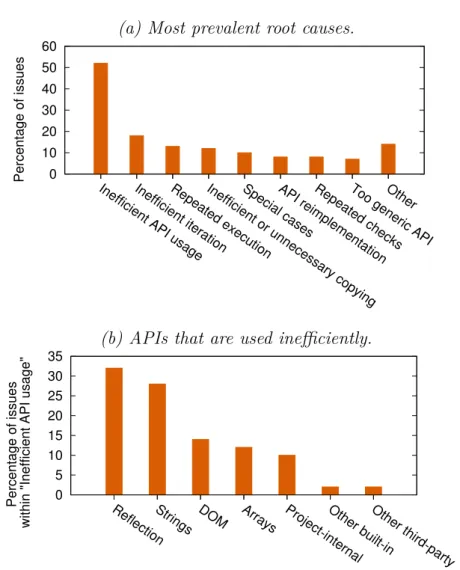
This section addresses the question which root causes real-world performance issues have. To address this question, we identify eight root causes that are common among the 98 studied issues, and we assign each issue to one or more root cause. Figure 2.1 summarizes our findings, which we detail in the following.
2.2.1
API-related Root Causes
The root cause of 65 performance issues is related to whether and how the program uses an API. We identify three specific root causes related to API usage.
Inefficient API Usage The most common root cause (52% of all issues), is that an API provides multiple functionally equivalent ways to achieve the same goal, but the API client does not use the most efficient way to achieve its goal. For example, the following code aims at replacing all quotes in a string with escaped quotes, by first splitting the string into an array of substrings and then joining the array elements with the quote character:4
.. = str.split("’").join("\\’");
The optimization is to use a more efficient API. For the example, the developers modify the code as follows:
.. = str.replace(/’/g, "\\’");
Inefficient API usage is the most prevalent root cause, with a total of 50 issues. Figure 2.1b further classifies these issues by the API that is used inefficiently. The most commonly misused APIs are reflection APIs, such as runtime type checks, invocations of function objects, and checks whether an object has a particular property. The second most common root cause is inefficient use of string operations, such as the above example.
2.2. ROOT CAUSES OF PERFORMANCE ISSUES (a) Most prevalent root causes.
0 10 20 30 40 50 60
Inefficient API usageInefficient iterationRepeated executionInefficient or unnecessary copyingSpecial casesAPI reimplementationRepeated checksToo generic APIOther
Percentage of issues
(b) APIs that are used inefficiently.
0 5 10 15 20 25 30 35
ReflectionStrings DOM Arrays Project-internalOther built-inOther third-party
Percentage of issues
within "Inefficient API usage"
Figure 2.1: Root causes of performance issues.
Inefficient Reimplementation The root cause of 8% of all issues is that the program implements some functionality that is already implemented in a more efficient way, e.g., as part of the built-in API. The optimization applied to avoid such performance issues is to use the existing, more efficient implementation. For example, Angular.js had implemented amap() function that applies a given function
to each element of an array. Later, the developers optimize the code by using the built-inArray.prototype.map() function, which implements the same functionality.5
Generic API is Inefficient Another recurring root cause (7% of all issues) is to use an existing API that provides a more generic, and therefore less efficient, functionality than required by the program. For example, given a negative number
n, the following code accesses the |n|th-to-last element of the array arr:6
arr.slice(n)[0]
5Issue 9067 of Angular.js. 6Issue 102 of jQuery.
The code is correct but inefficient because slice() copies parts of the array into
another array, of which only the first element is used. The optimization applied to avoid such performance issues is to implement the required functionality without using the existing API. For the example, the developers improve performance by directly accessing the required element:
arr[arr.length + n]
2.2.2
Other Root Causes
Besides API-related problems, we identify six other common causes of performance issues.
Inefficient Iteration JavaScript provides various ways to iterate over data collec-tions, such as traditionalforloops,for-inloops, and theArray.prototype.forEach()
method. A common root cause of poor performance (18% of all issues) is that a program iterates over some data in an inefficient way. The optimization applied to avoid such performance issues is to iterate in a more efficient way. For example, the following code iterates through all properties ofarg using afor-in loop:7
for (var prop in arg) {
if (arg.hasOwnProperty(prop)) {
// use prop
} }
This iteration is inefficient because it requires to check whether the property is indeed defined inargand not inherited fromarg’s prototype. To avoid checking each
property, the developers optimize the code by usingObject.keys(), which excludes
inherited properties:
var updates = Object.keys(arg);
for (var i = 0, l = updates.length; i < l; i++) {
var prop = updates[i];
// use prop
}
Repeated Execution of the Same Operations 13% of all issues are caused by a program that repeatedly performs the same operations, e.g., during different calls of the same function. For example, the following code repeatedly creates a regular expression and uses it to split a string:8
function on(events, ...) { events = events.split(/\s+/); ...
}
To create a regular expression, the developer may use the RegExp constructor or
a regular expression literal, like in this example. The code is inefficient because creating the regular expression is an expensive operation that is repeatedly executed.
7Issue 11338 of Ember.js. 8Issue 1097 of Backbone.
2.2. ROOT CAUSES OF PERFORMANCE ISSUES
The optimization applied to avoid such performance issues is to store the results of the computation for later reuse, e.g., through memoization [TPG15]. For the above example, the developers compute the regular expression once and store it into a variable: var eventSplitter = /\s+/; function on(events, ...) { events = events.split(eventSplitter); ... }
Unnecessary or Inefficient Copying of Data Another recurrent root cause (12% of all issues) is to copy data from one data structure into another in an inefficient or redundant way. The optimization applied to avoid such performance issues is to avoid the copying or to implement it more efficiently. For example, a function in Angular.js used to copy an array by explicitly iterating through it and by appending each element to a new array.9 The developers optimized this code by using the built-inArray.prototype.slice()method, which is a more efficient way
to obtain a shallow copy of an array.
A Computation Can Be Simplified or Avoided in Special Cases 10% of
all issues are due to code that performs a computation that is unnecessarily complex in some special case. The optimization applied to avoid such performance issues is to check for the special case and to avoid or to simplify the computation. For example, the developers of Angular.js used JSON.stringify(value) to obtain a
string representation of a value. However, the value often is a number and calling
stringify()is unnecessarily complex in this case.10 The developers optimized the
code by checking the runtime type of the value and by using the much cheaper implicit conversion into a string,""+value, when the value is a number.
Repeated Checks of the Same Condition Several issues (8%) are because the program repeatedly checks the same condition, even though some of the checks could be avoided. For example, the following code repeatedly checks whether a given object is a function, which is inefficient because the object cannot change between the checks.11
function invoke(obj, method) { _.map(obj, function(value) {
isFunc = _.isFunction(method) ...
}); }
The optimization applied to avoid such performance issues is to refactor the control flow in such a way that the check is performed only once. For the above example, the developers hoist theisFunction() check out of the map() call. Similar expressions
9Issue 9942 of Angular.js. 10Issue 7501 of Angular.js. 11Issue 928 of Underscore.js.
0 20 40 60 80 100 0 20 40 60 80 100 120 140 160 Percentage of optimizations
Affected lines (cumulative sum)
Figure 2.2: Number of source code lines that are affected by optimizations.
would be addressed by the common-subexpression elimination optimization that is performed in many compilers. However, non-local changes that require moving an expression outside the function call are outside the scope for existing compilers.
Our analysis shows that various performance issues can be mapped to a relatively small number of recurring root causes. Some but not all of these root causes have been addressed by existing approaches for automatically finding performance problems [GPS15, TPG15, XMA+10]. However, our results suggest that there is a need for additional techniques to help developers find and fix instances of other common performance issues.
2.3
Complexity of Optimizations
This section addresses the question how complex the source code changes are that developers apply to optimize their programs. To address this question, we analyze the project’s code before and after each optimization. We study both the complexity of the changes themselves (Section 2.3.1) and to what degree applying these changes affects the complexity of the program’s source code (Section 2.3.2).
2.3.1
Complexity of Changes
To assess the complexity of changes applied as optimizations, we measure for each change the number of affected lines of source code, i.e., the sum of the number of removed lines and the number of added lines. To avoid biasing these measurements towards particular code formatting styles, we apply them on a normalized represen-tation of the source code. We obtain this represenrepresen-tation by parsing the code and pretty-printing it in a normalized format that does not include comments.
We find that optimizations affect between 2 and 145 lines of JavaScript source code, with a median value of 10. Figure 2.2 shows the cumulative sum of the number of affected lines per change, i.e., how many optimizations are achieved with less than a particular number of affected lines. The graphs shows that 73% of all optimizations affect less than 20 lines of code, and that 28% of all optimizations affect even less than 5 lines of code. We conclude from these results that a significant portion of
2.3. COMPLEXITY OF OPTIMIZATIONS (a) Effect on the number of statements.
0 5 10 15 20 25 30 35 40 -Infinity..-11-10..-4-3..-10..0 1..3 4..10 10..Infinity Percentage of optimizations
Difference in number of statements
(b) Effect on cyclomatic complexity.
0 10 20 30 40 50 -Infinity..-11-10..-4-3..-10..0 1..3 4..10 10..Infinity Percentage of optimizations
Difference in cyclomatic complexity
Figure 2.3: Effect of applying an optimization on the cyclomatic complexity.
optimizations are possible with relatively simple changes, which empirically confirms an assumption made by prior research on performance bug detection [JSS+12, NSML13, NCRL15].
2.3.2
Change in Complexity of Program
To understand to what degree optimizations influence the complexity of the source code of the optimized program, we measure the number of statements in the program and the cyclomatic complexity [McC76] of the program before and after each change. These metrics approximate the understandability and maintainability of the code. For each change, we obtain the metric before and after the change, nbef ore and
naf ter, and we summarize the effect of the change as naf ter −nbef ore. A positive
number indicates that the change increases the complexity of the program because the changed program contains additional statements or increases the cyclomatic complexity, whereas a negative number indicates that the program becomes less complex due to the change.
Figures 2.3a and 2.3b summarize our results. The graphs show what percentage of optimizations affect the number of statements and the cyclomatic complexity in a particular range. For example, Figure 2.3a shows that 24% of all optimizations add between one and three statements to the program. We find that a large portion of all optimizations do not affect the number of statements and the cyclomatic complexity at all: 37.11% do not modify the number of statements, and 47.42% do not modify the cyclomatic complexity. A manual inspection of these optimizations shows that they modify the code in minor ways, e.g., by moving a statement out of a loop, by adding an additional subexpression, or by replacing one function call with another. It is also interesting to note that a non-negligible percentage of optimizations decreases the number of statements (19.59%) and the cyclomatic complexity (14.43%). These results challenge the common belief that optimizations come at the cost of reduced code understandability and maintainability [Knu74, DRSS01]. We conclude from these results that many optimizations are possible without increasing the complexity of the optimized program.
-60 -40 -20 0 20 40 60 80 100
Inefficient API usageInefficient reimplementationGeneric APIInefficient iterationRepeated executionInefficient copyingSpecial casesRepeated checks
Performance impact (%)
Performance improvements per root cause
Figure 2.4: Performance improvements obtained by optimizations per root cause. (The bottom and the top of the box indicate the first 25% and 75% of the data, and
the middle line indicates the median value. Vertical lines extend the bottom and the top of the box to indicate the minimum and the maximum values.)
2.4
Performance Impact of Optimizations
The following addresses the question of how performance is affected by applying JavaScript optimizations. To address this question, we execute the tests of all 98 optimizations on all considered JavaScript engines where the respective code can be executed (Section 2.1). In total, we obtain 568 performance improvement results.
Figure 2.4 shows the performance results obtained by optimizations for each root cause. The figure illustrates that optimizations lead to a wide range of improvements, with the majority of optimizations saving between 25% and 70% of the execution time. Perhaps surprisingly, the figure shows that some optimizations cause a performance degradation. We further analyze these cases in Section 2.5. In general, the performance results depend on the tests we use, and we can not generalize the results for a specific root cause. For example, the optimizations tested with microbenchmarks usually yield large improvements, because they run small snippets of code.
Given these results and the results from Section 2.3, one may wonder whether there is any correlation between the “pain” and the “gain” of optimizations, i.e., between the number of lines affected by a change and the performance improvement that the change yields. To address this question, Figure 2.5 shows the relation between these two metrics for all issues. The figure does not show any correlation (Pearson’s correlation coefficient: 5.85%).
We draw three conclusions from our results. First, developers apply some optimizations even though the achieved performance impact is relatively small. This strategy seems reasonable, e.g., when the modified code is in a heavily used
2.5. CONSISTENCY ACROSS ENGINES AND VERSIONS 20 40 60 80 100 0 20 40 60 80 100 120 140 160
Max. performance improvement (%)
Affected lines
Figure 2.5: Relation between the number of lines affected by a change and the achieved performance improvement.
library function, but may also be a sign for “premature optimizations” [Knu74]. Second, developers apply some optimizations even though these optimizations cause a performance degradation on some JavaScript engines, either consciously or without knowing what impact a change has. Third, some optimizations lead to significant savings in execution time and future work on profiling should pinpoint such optimization opportunities to developers.
2.5
Consistency Across Engines and Versions
Since different JavaScript engines apply different optimizations, changing code to improve performance in one engine risks degrading it in another engine. Furthermore, since engines evolve quickly, an optimization applied to speed up the program in one version of an engine may have the opposite effect in another version of the same engine. To assess to what degree developers struggle with these risks, this section addresses the question how consistent performance improvements are across different JavaScript engines and across multiple versions of the same engine.
Similar to RQ 3, we address this question by measuring the performance impact of the performance issues in all considered JavaScript engines. Since we want to compare performance impacts across engines, we include only issues that we can execute in both V8 and SpiderMonkey, i.e., we exclude non-browser optimizations. In total, we consider 82 issues for this research question.
2.5.1
Consistency Across Engines
Table 2.3 compares the performance impact of changes in the V8 and SpiderMonkey engines. For each engine, the table distinguishes five cases: + means that a change improves performance in all versions of the engine, +0 means that the change improves performance or does not affect performance, +- means that the change improves performance in some version but degrades it in another version, 0- means no performance change or a performance degradation, and finally, - means a negative
Table 2.3: Percentage of optimizations that result in positive (+), positive or no (+0), positive or negative (+-), no or negative (0-), and negative (-) speedup in V8
and SpiderMonkey. SpiderMonkey + +0 +- 0- -V8 + 42.68 8.5 0 0 0 +0 13.4 19.5 1.2 3.7 0 +- 4.9 0 3.7 1.2 0 0- 1.2 0 0 – – - 0 0 0 – –
performance impact in all versions. For each combination of these five cases, the table shows the percentage of changes that fall into the respective category. Because the study includes only issues that provide an improvement in at least one engine (Section 2.1.2), the four cases in the bottom right corner of the table cannot occur.
We find that only 42.68% of all changes speed up the program in all versions of both engines, which is what developers hope for when applying an optimization. Even worse, 15.85% of all changes degrade the performance in at least one engine, i.e., a change supposed to speed up the program may have the opposite effect. Interestingly, a non-negligible percentage of changes speed up the program in one engine but cause slowdown in another. For example, 4.9% of all changes that increase performance in all versions of SpiderMonkey cause a slowdown in at least one version of V8. Some changes even degrade performance in some versions of both engines. For example, 3.7% of all changes may have a positive effect in V8 but will either decrease or do not affect performance in SpiderMonkey.
2.5.2
Consistency Across Versions of an Engine
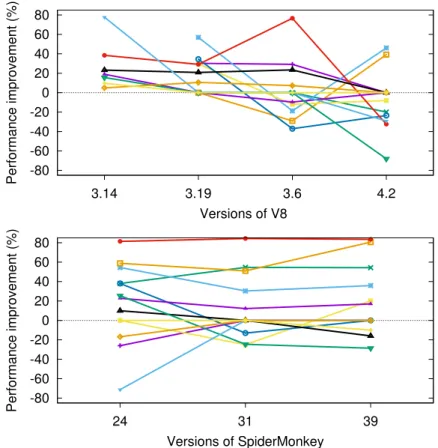
To better understand how the performance impact of a change evolves across different versions of a particular engine, Figure 2.6 shows the speedups of individual changes in the V8 (top) and SpiderMonkey (bottom) engines. For readability, the figure includes only those 15.85% of all changes that cause a slowdown in at least one version of some engine. The graphs show that performance can differ significantly across different versions. For example, a change that provides an almost 80%-speedup in version 3.6 of the V8 engine causes a non-negligible slowdown in version 4.2 of the same engine. The graphs also show that the performance impact of a change sometimes evolves in a non-monotonic way. That is, a beneficial optimization may turn into a performance degradation and then again into a beneficial optimization.
In summary, our results show that performance is a moving target. This finding motivates future work that supports developers in achieving satisfactory performance despite the heterogeneity of JavaScript engines, such as techniques to decide when to apply an optimization, to reliably and automatically measure the performance effect of a change, to track the effect of an optimization over time, to undo an optimization
2.6. RECURRING OPTIMIZATION PATTERNS -80 -60 -40 -20 0 20 40 60 80 3.14 3.19 3.6 4.2 Performance improvement (%) Versions of V8 -80 -60 -40 -20 0 20 40 60 80 24 31 39 Performance improvement (%) Versions of SpiderMonkey
Figure 2.6: Performance improvement of changes in different versions of engines. Each line represents one performance optimization (same line style in both figures means the same optimization).
that turns out to be counterproductive in a new engine, and to specialize JavaScript code for particular engines.
2.6
Recurring Optimization Patterns
The following addresses the question whether there are recurring optimization patterns and whether they can be applied automatically. To address the first part of the question, we manually identify a set of optimizations that can be re-applied across several projects and semi-automatically search for instances of these optimization patterns beyond the 98 studied issues (Section 2.6.1). To address the second part of the question, we identify pre-conditions for applying the recurring optimization patterns in a fully automated way (Section 2.6.2).
2.6.1
Prevalence of Recurring Optimization Patterns
To identify performance optimizations that may apply in more than a single situation we inspect all 98 issues. First, we identify optimizations that occur repeatedly within the study (Table 2.4, Patterns 1–5). Second, since the 98 studied issues may not expose multiple instances of a pattern that would occur repeatedly in a larger set
of issues, we also identify patterns that may occur repeatedly (Table 2.4, Patterns 6–10). For each optimization pattern in Table 2.4, we provide a short description, as well as an example of code before and after the optimization.
In Table 2.5, the numbers before the vertical lines show how often each opti-mization pattern occurs within the 98 issues considered in the study. For instance, there are two instances of Pattern 1 (avoidfor-in loops) in the Angular.js project.
The last column shows that the studied issues contain eight optimizations that match Pattern 1. In total, 29 of the 98 studied optimizations match one of the 10 optimization patterns.
To study whether there are occurrences of the optimization patterns beyond the 98 studied optimizations, we develop a simple, AST-based, static analysis for each pattern in Table 2.4. Each such analysis performs an AST traversal of a JavaScript program to find matches of the patterns. Due to the well-known difficulties of statically analyzing JavaScript in a sound way (Section 2.6.2), the analyses cannot guarantee that the optimization patterns can indeed be applied at the identified code locations without changing the program’s semantics. To enable us to manually check whether a match is a valid optimization opportunity, the analyses also rewrite the program by applying the respective optimization pattern. We then manually inspect the rewritten program and prune changes that would modify the program’s semantics.
We apply the ten analyses to the current version of each of project. In total, the analyses suggest 142 optimizations, of which we manually prune 3 changes because they break the semantics of the program. In Table 2.5, the numbers after the vertical lines show how many previously unreported optimization opportunities the analyses find for each project. We omit four projects for which we do not find any match.
In total, we find 139 instances of recurring optimization patterns. The most common patterns are Pattern 1 (avoid for-inloop), Pattern 3 (use implicit string
conversion), and Pattern 7 (useinstanceof). For two patterns (4 and 6), the analyses
do not find any previously unreported instances. The results show that patterns are recurring within a project. For example, Pattern 1 has been applied only once in the Ember project by the developers, but we find 21 additional code locations that offer the same optimization opportunity. Furthermore, the results show that recurring patterns can be applied across projects. For example, the only instance of Pattern 7 within the 98 studied issues is in the Mocha project, but there are 17 additional instances in other projects. We have been reporting optimization opportunities to the developers and some of them have already been applied incorporated into the projects.12
We conclude from these results that there is a need for tools and techniques that help developers apply an already performed optimization at other code locations, both within the same project and across projects, possibly along the lines of existing work [MKM11, MKM13, BGH07].
12See
https://github.com/marijaselakovic/JavaScriptIssuesStudyfor an updated list of reported issues.
2.6. RECURRING OPTIMIZATION PATTERNS
Table 2.4: Recurring optimization patterns.
Id Description Before After
1 Prefer Object.keys() over
computing the properties of an object with afor-inloop.
for (var k in obj) {
if (obj.hasOwnProperty(k)) { ... }
}
var keys = Object.keys(obj);
for (var i=0; l=keys.length; i<l; i++)){
var key = keys[i]; ...
}
2 To extract a substring of length one, access the char-acter directly instead of call-ingsubstr().
str.substr(i, 1) str[i]
3 To convert a value into a string, use implicit type con-version instead ofString().
starts = String(starts); starts = ’’ + starts;
4 Use jQuery’sempty()instead
ofhtml(’’).
body.html(’’); body.empty();
5 Use two calls ofcharAt()
in-stead ofsubstr().
key.substr(0, 2) !== ’$$’ key.charAt(0) !== ’$’ && key.charAt(1) !== ’$’
6 To replace parts of a string with another string, use
replace() instead of split()
andjoin().
str.split("’").join("\\’") str.replace(/’/g, "\\’")
7 Instead of checking an ob-ject’s type with toString(),
prefer the instanceof
opera-tor.
if (toString.call(err) === "[object Error]")
if (err instanceof Error || toString.call(err) === "[object Error]")
8 For even/odd checks of a number use &1 instead of
%2.
index % 2 == 0 index & 1 == 0
9 Prefer for loops over functional-style processing of arrays. arr.reduce( function (str, name) { return ...; }, str);
for (var i=0; l=arr.length; i<l; i++){
var name = arr[i]; str = ...;
}
return str;
10 When joining an array of strings, handle single-element arrays efficiently.
[].slice.call(arguments) .join(’ ’); arguments.length === 1 ? arguments[0] + ’’ : [].slice.call(arguments) .join(’ ’);