RISK-BASED SEISMIC PERFORMANCE ASSESSMENT
OF EXISTING TALL STEEL FRAMED BUILDINGS
Thesis submitted for the degree of
Doctor of Philosophy in Earthquake Engineering
Carlos Molina Hutt, PE, CEng MICE
University College London
Civil, Environmental and Geomatic Engineering Department
2017
I, , confirm that the work presented in this thesis is my own. Where information has been derived from other sources, I confirm that this has been indicated in the thesis.
“The final challenge is not in predicting performance or estimating losses; it is in contributing effectively to the reduction of losses and the improvement of safety. We must never forget this.”
Abstract
One of the major concerns in earthquake disaster resilience is understanding the risk posed by existing buildings that are not conformant with modern building codes. A related challenge is how, if necessary, to mitigate the risk through retrofit policies or other measures in a cost effective manner. For some types of buildings, such as unreinforced masonry, the risks are so obviously large, that mandatory laws have been enacted to assess and retrofit the buildings. However, in other cases, such as with non-ductile concrete buildings or older tall steel buildings, the risks and mitigation strategies are not as clear cut. This research addresses the risks posed by older seismically deficient steel buildings, which constitute a significant portion of tall buildings in western US cities with high seismic hazard. These buildings include many steel moment resisting frames (MRF), constructed during the late 1960's through mid-1990's, with the type of welded connections that experienced sudden brittle fractures during the 1994 Northridge earthquake.
This work applies performance-based earthquake engineering (PBEE) tools to this potential seismic safety problem. San Francisco is selected as a case study city in order to permit engagement with the city’s ongoing earthquake safety initiatives. The performance of existing 1970s tall steel MRF buildings is evaluated through the development of archetype buildings. A series of studies that progressively explore the performance of individual archetype buildings, within a probabilistic framework, are carried out, including scenario-based, intensity-based and time-based assessments. Additionally, a method is proposed to extend such assessments to evaluate clusters of buildings and how their performance may impact the resilience of the community; going beyond individual building performance, towards more holistic seismic performance evaluations. The results of this body of research are communicated not only in terms of structural response, but also in terms of direct economic losses, downtime and recovery, which are more accessible to decision makers.
The scenario-based and intensity-based evaluations are carried out to assess performance under an expected earthquake scenario, and design level shaking, respectively. The results indicate that, while the archetype buildings considered are expected to guarantee the life-safety of occupants, the associated economic losses and downtime entail a costly and slow recovery, which can, additionally, result in considerable indirect losses. The impact of adopting structural retrofit schemes, enhanced non-structural building components, and seismic mitigation measures is explored. The results indicate that, through a combination of these interventions, significant reductions, in both losses and downtime, under the earthquake
In order to benchmark the performance of 1970s steel MRFs versus modern design standards, a comparative time-based evaluation is carried out. The results indicate that the probabilities of collapse of the 1970s archetype buildings considered are well in excess of the 1% in 50 year target implicit in modern design standards. The results also illustrate that while modern designs result in performance that complies with the code intended collapse-safety margin, the level of damage control may be insufficient to enable a swift recovery and ensure the seismic resilience of these buildings.
A methodology to assess the earthquake risk of existing tall buildings on the urban community is proposed. This method is implemented in a simple case study of a cluster of tall steel MRF buildings in downtown San Francisco. The results suggest that under a range of realistic earthquake scenarios, a considerable loss of occupancy and functionality is expected in buildings consistent with the 1970s archetype. Furthermore, permanent deformations in these buildings can result in large cordons around the damaged structures, which would prevent access to other buildings within a considerable area.
The results of this research serve to inform the debate over the expected seismic performance of existing 1970s tall steel MRF buildings. This work provides an array of results from different types of assessment that can be informative to different parties including design practitioners, building owners, policy makers and the insurance sector.
Acknowledgements
I offer my most sincere gratitude to my supervisor Professor Tiziana Rossetto (University College London), for her guidance, enthusiasm and encouragement. The opportunities she has afforded me throughout my PhD studies, many of which go beyond the scope of this thesis, are helping me grow towards my goal of becoming a well-rounded earthquake engineer.
I am grateful to Professor Gregory Deierlein (Stanford University), who agreed to co-supervise this research, and who has, despite the distance, provided continuous guidance and support.
I would like to thank my former employer Arup, where I initiated this research through their ‘Arup University’ scheme. In particular, I would like to thank Michael Willford and Ibbi Almufti for supporting and believing in this work, as well as Damian Grant and Adam Pearce for their technical guidance and encouragement when I first expressed interest in working with Arup’s Advanced Technology and Research group. I would also like to thank Tabitha Tavolaro, my line manager during my four years at Arup, who challenged me and inspired me to become a better engineer.
I am grateful to Professor Dina D’Ayala (University College London), who, as my line manager, ensured I was able to balance my duties as a full-time Teaching Fellow in the Civil, Environmental and Geomatic Engineering Department with the demands of a part-time PhD. I would also like to thank my colleague and office-mate, Dr. Lena Ciric, for her charisma, uniqueness, nerve and talent, but more importantly for her endless patience putting up with me over the past five years.
Last, but not least, I would like to thank my family and friends for their continuous love and support, without whom I would have never completed this work. In particular, I would like to thank my mother, Judith, my father, Carlos, and my sister, Ana, who are my foundation. I would also like to thank my partner, Diego, for his endless love, support and encouragement.
Contents
1 Introduction... 1
1.1 Background and motivation ... 1
1.2 Aim, objectives and scope... 3
1.3 Thesis structure... 5
1.4 Publications ... 6
2 Literature Review... 9
2.1 Seismic vulnerability of existing tall steel buildings in the US... 9
2.1.1 Seismic design evolution of building codes ... 9
2.1.2 Welded steel moment resisting frame (WSMRF) vulnerabilities ... 12
2.1.3 Seismic design of tall buildings ... 14
2.1.4 Loss assessment of tall buildings from a vulnerability perspective ... 15
2.2 Seismic performance assessment of buildings and FEMA P58 ... 16
2.2.1 Performance-based earthquake engineering (PBEE) ... 18
2.2.2 Seismic hazard analysis... 19
2.2.3 Structural response simulation ... 21
2.2.4 Damage and consequence estimation... 24
2.2.5 PBEE for risk management ... 26
2.3 Seismic resilience and frameworks for evaluation ... 27
2.4 Point of departure ... 32
3 Methodology ... 35
3.1 Index buildings and modelling approaches ... 37
3.2 Building specific performance evaluations (BSPE) ... 38
3.2.1 BSPE: Scenario-based assessment ... 40
3.2.2 BSPE: Intensity-based assessment ... 41
3.2.3 BSPE: Time-based assessment... 41
3.3 Beyond individual building evaluations ... 42
3.4 Transferability of method ... 44
4 Archetype Buildings and Numerical Modelling ... 45
4.1 Archetype tall building selection... 45
4.1.1 Design requirements per UBC 1973 vs IBC 2012 ... 49
4.1.2 Design summary of 40- and 20-storey 1970s archetype buildings ... 67
4.1.3 Tall buildings in other US west coast cities ... 71
4.2 Non-linear response history analysis (NLRHA) models ... 73
4.2.3 Non-linear panel zones... 80
4.2.4 Other analysis assumptions ... 81
4.2.5 Global response: comparison against instrumented buildings ... 81
4.2.6 Collapse simulation ... 82
4.2.7 Adjustments for 40- and 20-storey archetypes... 84
4.3 Building performance model... 85
4.3.1 Loss assessment methodology ... 86
4.3.2 Downtime assessment methodology ... 92
4.3.3 Recovery functions... 96
5 BSPE: Scenario-based Assessment... 103
5.1 HayWired scenario ground motions ... 105
5.2 Non-linear dynamic analysis results... 110
5.2.1 Impact of fracture distribution... 119
5.2.2 Impact of building orientation... 120
5.3 Expected direct economic losses and downtime ... 122
5.4 Summary and conclusions... 123
6 BSPE: Intensity-based Assessment... 125
6.1 Seismic hazard and ground motions... 126
6.2 40-storey archetype building and strategies for increased resilience ... 130
6.3 Summary and conclusions... 145
7 BSPE: Time-based Assessment ... 147
7.1 Methodology ... 147
7.2 Seismic hazard and ground motions... 149
7.3 Structural performance assessment ... 156
7.4 Time-based assessment ... 166
7.4.1 Collapse risk... 167
7.4.2 Performance functions... 172
7.5 Loss assessment... 176
7.5.1 Loss function and average annual loss ... 183
7.5.2 Seismic vulnerability function ... 182
7.6 Recovery functions... 190
7.7 Implications of results on deaths and injuries ... 201
7.8 Summary and conclusions... 203
8 Beyond Individual Building Evaluations ... 205
8.1 Overview ... 205
8.3 Comprehensive scenario-based assessments ... 210
8.4 Building cluster assessment... 219
8.5 Conclusions ... 228
9 Summary and Conclusions... 229
9.1 Overview ... 229
9.2 Summary of findings and conclusions ... 230
9.2.1 BSPE: Scenario-based evaluation ... 230
9.2.2 BSPE: Intensity-based evaluation ... 231
9.2.3 BSPE: Time-based evaluation... 232
9.2.4 Beyond individual building evaluations... 234
9.3 Reflections on transferability ... 234
9.4 Limitations and future research ... 237
9.5 Concluding remarks ... 241 References ... 243 Appendix A ... 257 Appendix B ... 309 Appendix C ... 329 Appendix D ... 373 Appendix E ... 393 Appendix F ... 403 Appendix G ... 415 Appendix H ... 437
List of Figures
Figure 1-1: Building height distribution in Los Angeles, San Francisco, and Seattle. ... 2
Figure 2-1: Design spectra for UBC 1973 to 1994 versus modern building codes. ... 11
Figure 2-2: Schematic illustration of standard levels of seismic performance. ... 17
Figure 2-3: Schematic of PEER methodology. ... 18
Figure 2-4: Conceptual resilience function. ... 28
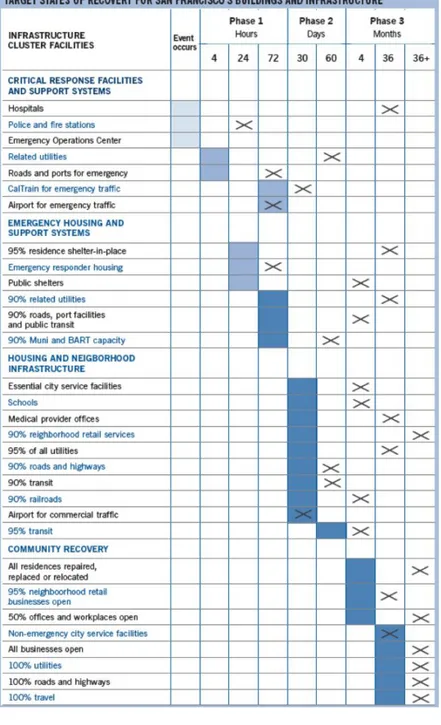
Figure 2-5: Target states of recovery for San Francisco’s building and infrastructure... 30
Figure 2-6: CAPSS Earthquake Safety Implementation Program Phase C. ... 31
Figure 3-1: General methodology flowchart... 36
Figure 3-2: Index building and modelling approaches flowchart. ... 38
Figure 3-3: Flowchart for building specific evaluations including general evaluation procedure, scenario-based, intensity-based and time-based evaluations... 39
Figure 3-4: Framework for assessing the earthquake risk of tall buildings to cities and the impact of different retrofit risk mitigation strategies... 43
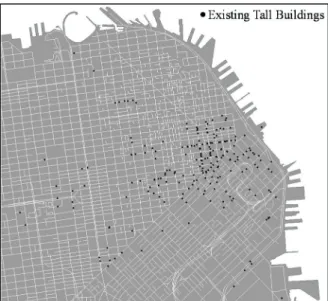
Figure 4-1: Spatial distribution of existing tall buildings in downtown San Francisco. ... 46
Figure 4-2: Number of tall buildings built in San Francisco per decade between 1900 and 2010 (a) and lateral resisting system types for tall buildings built between 1960 and 1990 (b)... ... 47
Figure 4-3: Images of existing tall buildings in downtown San Francisco greater than 35 storeys, built between 1960 and 1990, whose lateral system is believed to be a steel MRF. ... 48
Figure 4-4: 1973 and 2012 archetype building plan drawings of lateral resisting system illustrating typical cross section shapes... 50
Figure 4-5: UBC 1973 seismic zone map of the United States... 52
Figure 4-6: IBC 2012 design spectra. ... 54
Figure 4-7: UBC 1973 wind pressure map of the United States... 55
Figure 4-8: Design wind pressure distribution per UBC 1973 and IBC 2012. ... 56
Figure 4-9: Design compliance of archetype building with interstorey drift requirements per (a) UBC 1973 and (b) IBC 2012. ... 57
Figure 4-10: 1973 and 2012 archetype building elevation drawings of lateral resisting system illustrating typical section sizes in beams and columns. ... 60
Figure 4-11: Typical details observed in existing building drawings: typical moment connection plan view (a) and elevation (b); typical splice connection (c). ... 63
Figure 4-12: Dynamic properties of the UBC 1973 archetype building (only lateral resisting system shown). ... 65
Figure 4-13: Dynamic properties of the IBC 2012 archetype building (only lateral resisting
system shown). ... 66
Figure 4-14: Archetype 40-storey office building plan (a) and isometric (b). ... 68
Figure 4-15: Structural models for the 40- and 20-storey 1973 archetype buildings... 69
Figure 4-16: Construction material of existing tall buildings constructed between 1960 and 1990 in (a) Los Angeles, (b) Seattle, (c) San Francisco (d) San Diego and (e) Oakland. ... 72
Figure 4-17: Isometric of 40-storey analytical model and close-up of component models (boxed in red). ... 73
Figure 4-18: Sample analytical versus experimental hysteretic moment-rotation response in a (a) RBS and (b) non-RBS beam-to-column connection consistent with pre-qualified detailing... 75
Figure 4-19: Impact of introduction of fracture variable in the moment-rotation response of beams, shown against ASCE 41 recommendations... 76
Figure 4-20: Sample analytical versus experimental column moment-rotation hysteretic response under varying ALR: 0.1(a) and 0.3 (b)... 78
Figure 4-21: Sample analytical versus experimental response of panel zones in W (a) and HSS (b) column sections. ... 80
Figure 4-22: Design response spectrum versus ground motion spectra recorded at the base of the Chevron Building during 1989 Loma Prieta Earthquake. ... 82
Figure 4-23: Collapse realization results including contour plot illustrating ASCE 41 rotation performance levels as well as sample hysteretic response of a sample beam, panel zone and column in the storeys in which a collapse mechanism is observed.... 83
Figure 4-24: Probability distributions CDF (a) and PDF (b), and sample hysteretic response of moment rotation in beam to column moment connections under different levels of plastic rotation at fracture: 0.005 rad (c) and 0.015 (d). ... 85
Figure 4-25: Loss and downtime assessment methodology... 87
Figure 4-26: Fragility function (and repair consequence) for a standard partition wall. ... 91
Figure 4-27: Simplified tri-linear recovery path to re-occupancy or functional-recovery... 96
Figure 4-28: Illustration of the Repair Time (RT) matrix or dataset to enable the development of recovery functions... 98
Figure 4-29: Illustration of the Repair Class Database (RCD) matrix or dataset to enable the development of recovery functions. ... 98
Figure 4-30: Illustration of the Damage State (DS) matrix or dataset to enable the development of recovery functions... 98 Figure 4-31: Illustration of the Repair Class (RC) matrix or dataset to enable the development
Figure 5-1: USGS shakemap of the San Francisco bay area under the HayWired earthquake scenario, a Mw7.0 earthquake on the Hayward fault. ... 104 Figure 5-2: HayWired earthquake scenario assessment locations in downtown San Francisco (red pin) and downtown Oakland (green pin). ... 105 Figure 5-3 Acceleration, velocity and displacement time histories of the east-west and north-south components of the HayWired scenario earthquake in San Francisco. ... 106 Figure 5-4: Acceleration, velocity and displacement time histories of the east-west and north-south components of HayWired scenario earthquake in Oakland... 107 Figure 5-5: Uniform hazard spectrum and conditional spectra (mean, variance and ground motion suite) at a representative site in downtown San Francisco versus ground motion spectra from earthquake scenarios: HayWired (at San Francisco and Oakland sites) and 1989 Loma Prieta (Chevron Building, San Francisco). .... 109 Figure 5-6: Illustration of damageable drift calculation. ... 110 Figure 5-7: Archetype 40-storey (a, b) and 20-storey (c, d) building interstorey drift ratio (IDR) in the short (a, c) and long (b, d) building directions in Oakland. ... 111 Figure 5-8: Archetype 40-storey (a, b) and 20-storey (c, d) building peak floor acceleration (PFA) in the short (a, c) and long (b, d) building directions in Oakland... 112 Figure 5-9: Archetype 40-storey (a, b) and 20-storey (c, d) building interstorey drift ratio (IDR) in the short (a, c) and long (b, d) building directions in San Francisco. 113 Figure 5-10: Archetype 40-storey (a, b) and 20-storey (c, d) building peak floor acceleration (PFA) in the short (a, c) and long (b, d) building directions in San Francisco. ... 114 Figure 5-11: Archetype 40-storey (a, b) and 20-storey (c, d) building beam performance for sample long (a, c) and short (b, d) building elevations in Oakland. ... 115 Figure 5-12: Archetype 40-storey (a, b) and 20-storey (c, d) building beam performance for sample long (a, c) and short (b, d) building elevations in San Francisco. ... 116 Figure 5-13: Archetype 40-storey (a, b) and 20-storey (c, d) building column performance (ASCE 41 thresholds) for sample long (a, c) and short (b, d) building elevations in Oakland. ... 117 Figure 5-14: Archetype 40-storey (a, b) and 20-storey (c, d) building column performance (ASCE 41 thresholds) for sample long (a, c) and short (b, d) building elevations in San Francisco. ... 118 Figure 6-1: Compliance with ASCE 7 for site-specific ground motions. ... 128 Figure 6-2: Mean of maximum and minimum demand response spectra and individual components for the short period (a) and long period (b) suites of ground motions. ... 129
Figure 6-3: Demand parameters for the archetype building: transient and residual drifts (i.e. IDR) and accelerations (i.e. PFA) at each storey in each building direction... 133 Figure 6-4: Demand parameters for the elastic spine retrofit: transient and residual drifts (i.e. IDR) and accelerations (i.e. PFA) at each storey in each building direction... 133 Figure 6-5: Demand parameters for the base isolation retrofit: transient and residual drifts (i.e. IDR) and accelerations (i.e. PFA) at each storey in each building direction. 133 Figure 6-6: Fragility functions for standard (solid line) versus enhanced (dashed line) partitions walls. ... 134 Figure 6-7: Loss estimates for archetype building (baseline), elastic spine, and base isolation retrofit schemes with standard and enhanced non-structural components: (a) with consideration of residual drifts; (b) without consideration of residual drifts. 139 Figure 6-8: Contribution to losses of building components for the following: (a) archetype building (baseline); (b) elastic spine retrofit scheme; (c) base isolation retrofit scheme with standard and enhanced non-structural components. ... 140 Figure 6-9: Probability distribution of residual drifts for archetype building (baseline), elastic spine, and base isolation retrofit schemes and associated FEMA damage states. ... 142 Figure 6-10: Downtime contributors for re-occupancy (a) and functional recovery (b) and sample de-aggregation of impeding factors for the archetype building (baseline) using standard non-structural components and no mitigation measures to minimize impeding factors versus enhanced non-structural components and mitigation measures to minimize impeding factors... 144 Figure 7-1: Methodology adopted in the time-based assessment of the 1973 and 2012 50-storey archetype buildings... 148 Figure 7-2: Seismic hazard curve at the representative site in downtown San Francisco (Vs30=260m/s, T=5sec.) illustrating the earthquake ground motion intensities (ei) considered in the time-based assessment. ... 150 Figure 7-3: Target conditional mean, variance, ground motion records and corresponding the UHS for the intensity levels considered in the time based assessment including SA, AFE, return periods and de-aggregation data (M, R and ). The geomean spectra of a Loma Prieta ground motion record is also shown for comparison. ... 154 Figure 7-4: Revised earthquake ground motion intensities (ei) considered in the time-based assessment for (a) the 1973 storey archetype building and (b) the 2012 50-storey archetype building. ... 155
Figure 7-5: Peak transient storey drift results from non-linear dynamic analysis for all intensity levels considered. Probabilities of no collapse at each earthquake intensity specified atop. ... 157 Figure 7-6: Peak residual storey drifts results from non-linear dynamic analysis for all intensity levels considered. Probabilities of no collapse at each earthquake intensity specified atop... 158 Figure 7-7: Peak floor acceleration results from non-linear dynamic analysis for all intensity levels considered. Probabilities of no collapse at each earthquake intensity specified atop... 159 Figure 7-8: Peak beam plastic rotation results from non-linear dynamic analysis for all intensity levels considered. Probabilities of no collapse at each earthquake intensity specified atop. ... 160 Figure 7-9: Peak column plastic rotation results from non-linear dynamic analysis for all intensity levels considered. Probabilities of no collapse at each earthquake intensity specified atop. ... 161 Figure 7-10: Peak panel zone rotation results from non-linear dynamic analysis for all intensity levels considered. Probabilities of no collapse at each earthquake intensity specified atop... 162 Figure 7-11: UBC 1973 design storey drifts, shear and overturning moment versus peak storey results from non-linear dynamic analysis subject to ground motions consistent with a 72 year return period event... 166 Figure 7-12: Multiple stripe analysis results (a) for collapse fragility derivation (b) of the 1973 and 2012 archetype buildings... 168 Figure 7-13: Graphical illustration of mean annual frequency of collapse calculation and collapse de-aggregation for the 1973 and 2012 archetype buildings. ... 171 Figure 7-14: Peak Interstorey Drift Ratio (IDR) (a) dynamic analysis results and (b) associated performance functions for 1973 and 2012 50-storey archetype buildings. ... 173 Figure 7-15: Peak Residual Interstorey Drift Ratio (IDR) (a) dynamic analysis results and (b) associated performance functions for 1973 and 2012 50-storey archetype buildings. ... 174 Figure 7-16: Peak floor acceleration (PFA) (a) dynamic analysis results and (b) associated performance functions for 1973 and 2012 50-storey archetype buildings. ... 175 Figure 7-17: Loss realizations and fitted loss curves under earthquake intensities considered in the time-based assessment for the 1973 50-storey archetype building. ... 178 Figure 7-18: Loss realizations and fitted loss curves under earthquake intensities considered in the time-based assessment for the 2012 50-storey archetype building. ... 179
Figure 7-19: Contribution of drift and acceleration sensitive components to repairable damage at different intensities of ground motion shaking for the (a) 1973 and (b) 2012 50-storey archetype buildings... 181 Figure 7-20: Contribution of different building component categories to repairable damage at different intensities of ground motion shaking for the (a) 1973 and (b) 2012 50-storey archetype buildings... 181 Figure 7-21: Contribution of (a) acceleration versus drift-sensitive and (b) different building component categories to repairable damage under earthquake ground motion intensity e2Afor the 1973 archetype. ... 182 Figure 7-22: Probabilities of observing repairable damage, irreparable damage or collapse at different intensities of ground motion shaking for the (a) 1973 and (b) 2012 50-storey archetype buildings... 183 Figure 7-23: Loss curves for the (a) 1973 and (b) 2012 50-storey archetype buildings. ... 185 Figure 7-24: Contribution of repairable damage, irreparable damage and collapse to the average annual loss (AAL) for the (a) 1973 and (b) 2012 50-storey archetype buildings. ... 186 Figure 7-25: Contribution of different earthquake ground motion intensities to the cumulative 1973 50-storey archetype building loss curve. ... 187 Figure 7-26: Contribution of different earthquake ground motion intensities to the cumulative 2012 50-storey archetype building loss curve. ... 187 Figure 7-27: Seismic vulnerability functions for the (a) 1973 and the (b) 2012 50-storey archetype buildings illustrating loss contribution from collapse, repairable and irreparable damage. ... 189 Figure 7-28: Re-occupancy recovery curves under the earthquake intensities considered in the time-based assessment for the 1973 50-storey archetype building showing mean and sample realizations (10th, 20th30th, 40th, 50th, 60th, 70th, 80th, 90th percentile estimates) for realizations where damage is repairable.. ... 191 Figure 7-29: Functionality recovery curves under the earthquake intensities considered in the time-based assessment for the 1973 50-storey archetype building showing mean and sample realizations (10th, 20th30th, 40th, 50th, 60th, 70th, 80th, 90th percentile estimates) for realizations where damage is repairable. ... 192 Figure 7-30: Re-occupancy recovery curves under the earthquake intensities considered in the time-based assessment for the 2012 50-storey archetype building showing mean and sample realizations (10th, 20th30th, 40th, 50th, 60th, 70th, 80th, 90th percentile estimates) for realizations where damage is repairable. ... 193 Figure 7-31: Functionality recovery curves under the earthquake intensities considered in the
and sample realizations (10th, 20th30th, 40th, 50th, 60th, 70th, 80th, 90thpercentile estimates) for realizations where damage is repairable. ... 194 Figure 7-32: Downtime curves to re-occupancy for the 1973 and 2012 50-storey archetype buildings. ... 197 Figure 7-33: Downtime curves to functional recovery for the 1973 and 2012 50-storey archetype buildings... 197 Figure 7-34: Impeding factors, structural repairs, non-structural repairs, residual drift and collapse contribution to the 1973 50-storey archetype building’s downtime curve to (a) re-occupancy and (b) functional recovery. ... 198 Figure 7-35: Impeding factors, structural repairs, non-structural repairs, residual drift and collapse contribution to the 2012 50-storey archetype building’s downtime curve to (a) re-occupancy and (b) functional recovery. ... 199 Figure 7-36: Contribution of repairable damage, irreparable damage from residual IDRs and collapse to the average annual downtime (AAD) to (a, c) re-occupancy and (b, d) functional recovery for the (a, b) 1973 and (c, d) 2012 50-storey archetype buildings. ... 200 Figure 8-1: 1973 50-storey archetype building vulnerability curves for resilience-based evaluations... 208 Figure 8-2: 2012 50-storey archetype building vulnerability curves for resilience-based evaluations... 208 Figure 8-3: Median spectra for earthquake scenarios ranging from M7 to M8. ... 214 Figure 8-4: Distribution of sampled spectral intensities at a 5 second period for earthquake scenarios ranging from M7 to M8 at the site of interest... 215 Figure 8-5: UBC 1973 mean recovery curves to (a) re-occupancy and (b) functional recovery, as well as expected cordon radius and duration (c) for earthquake scenarios ranging from M7 to M8... 216 Figure 8-6: IBC 2012 mean recovery curves to (a) re-occupancy and (b) functional recovery, as well as expected cordon radius and duration (c) for earthquake scenarios ranging from M7 to M8... 217 Figure 8-7: Location of buildings sites in downtown San Francisco... 220 Figure 8-8: Distribution of spectral intensities for earthquake scenario with M7.5 at buildings sites A through E considered in the building cluster assessment. ... 221 Figure 8-9: Mean recovery curves to (a to d) re-occupancy and (e to h) functional recovery, (a, b, e, f) normalized and (c, d, g, h) in absolute terms, for (a, c, e, g) individual buildings and (b, d, f, h) the overall cluster under a M7.5 earthquake scenario assuming UBC 1973 archetypes... 222
Figure 8-10: Mean recovery curves to (a to d) re-occupancy and (e to h) functional recovery, (a, b, e, f) normalized and (c, d, g, h) in absolute terms, for (a, c, e, g) individual buildings and (b, d, f, h) the overall cluster under a M7.5 earthquake scenario assuming IBC 2012 archetypes. ... 223 Figure 8-11: Mean cordon preventing access to surrounding areas under a M7.5 earthquake scenario assuming (a) UBC 1973 and (b) IBC 2012 archetypes. ... 224 Figure 8-12: Probability of cordon with a mean radius equal to the building height and duration equal to the building demolition time under a M7.5 earthquake scenario assuming UBC 1973 archetypes integrated with GIS map. ... 227 Figure 8-13: Probability of cordon with a mean radius equal to the building height and duration equal to the building demolition time under a M7.5 earthquake scenario assuming IBC 2012 archetypes integrated with GIS map. ... 227
List of Tables
Table 2-1: Key specifications from UBC 1973, 1985 and 1994 related to seismic principles and steel MRF design. ... 11 Table 4-1 Gravity loading criteria... 51 Table 4-2: IBC 2012 wind design parameters. ... 55 Table 4-3: Comparison in load combinations per UBC 1973 and IBC 2012. ... 61 Table 4-4: Comparison of steel ASD stress limits in UBC 1973 versus LRFD strength checks in IBC 2012. ... 61 Table 4-5. Dynamic properties of the UBC 1973 and IBC 2012 50-storey archetype buildings. ... 64 Table 4-6. Effective wind and seismic design base shears for the 1973 40- and 20-storey archetype buildings... 68 Table 4-7: Dynamic properties of the 40- and 20-storey 1973 archetype buildings... 69 Table 4-8: Lateral resisting system section sizes for the 1973 40-storey archetype building... 70 Table 4-9: Lateral resisting system section sizes for the 1973 20-storey archetype building... 70 Table 4-10: Non-linear beam and column modelling parameters for 1973 and 2012 building archetypes... 79 Table 4-11: Mean peak storey acceleration (PFA) and displacement (D) comparison between the instrumented Chevron building and the 1973 archetype building during Loma Prieta earthquake.. ... 82 Table 4-12: Fragility numbers, category, description and source for a sample of components included in the 50-storey 1973 archetype building performance model. ... 90 Table 4-13: Assumed delays associated with impeding factors... 95 Table 4-14: Assumed labour allocation parameters for repair time estimates. ... 95 Table 5-1: Impact of ground motion directionality on 40-storey archetype peak interstorey drift ratios (IDRs) and peak floor accelerations (PFAs) in Oakland. ... 121 Table 5-2: Impact of ground motion directionality on 20-storey archetype peak interstorey drift ratios (IDRs) and peak floor accelerations (PFAs) in Oakland. ... 121 Table 5-3 Impact of ground motion directionality on 40-storey archetype peak interstorey drift ratios (IDRs) and peak floor accelerations (PFAs) in San Francisco. ... 121 Table 5-4: Impact of ground motion directionality on 20-storey archetype peak interstorey drift ratios (IDRs) and peak floor accelerations (PFAs) in Oakland. ... 121 Table 5-5: Abbreviation for case study buildings for which estimates of direct economic losses
Table 5-6: Direct economic loss estimates (50th and 90th percentile) expressed USD and percentage of replacement cost for the case study buildings considered. ... 123 Table 5-7: Downtime estimates to re-occupancy and functional (50th and 90th percentile) for the case study buildings considered. ... 123 Table 6-1: Assumed delays associated with impeding factors... 136 Table 6-2: Expected loss estimates for the baseline building and enhanced performance schemes with consideration of residual drifts. ... 138 Table 6-3: Expected loss estimates for the baseline building and enhanced performance schemes without consideration of residual drifts. ... 138 Table 6-4: Downtime estimates for the baseline building and enhanced performance schemes for re-occupancy... 142 Table 6-5: Downtime estimates for the baseline building and enhanced performance schemes for functional recovery. ... 142 Table 7-1: SAs at a 5 second period, AFEs, return periods and magnitude (M), distance (R) and epsilon () de-aggregation results for the ground motion intensities considered in the time-based assessment. ... 151 Table 7-2: SAs at a 5 second period, AFEs, return periods and magnitude, distance and epsilon de-aggregation results for the ground motion intensities considered in the time-based assessment. ... 153 Table 7-3: Maximum of peak storey results from non-linear dynamic analysis: interstorey drift ratio (IDR), residual IDR, peak floor acceleration (PFA), beam plastic rotation, column plastic rotation and panel zone rotations for the 1973 and 2012 50-storey archetype buildings... 163 Table 7-4: Probabilities of collapse over different periods of time for a range of codes and structural systems. ... 170 Table 7-5. Time-based performance assessment metrics related to peak IDRs, peak residual IDRs and maximum PFAs for the 1973 and 2012 archetype buildings. CP denotes collapse... 176 Table 7-6: Median (μ) and dispersion (β) of time to re-occupancy estimates in key recovery
phases for the 1973 and 2012 50-storey archetype building. ... 195 Table 7-7: Median (μ) and dispersion (β) of time to functional recovery in key recovery phases
for the 1973 and 2012 50-storey archetype buildings. ... 196 Table 8-1: Summary of time-based assessment results for the 1973 50-storey archetype building that enable the development of vulnerability curves for resilience-based evaluations (number of realizations or probability of observing each limit state). ... 207
Table 8-2: Summary of time-based assessment results for the 2012 50-storey archetype building that enable the development of vulnerability curves for resilience-based evaluations (number of realizations or probability of observing each limit state). ... 207 Table 8-3: UBC 1973 limit state consequence data as a function of earthquake ground motion intensity. ... 212 Table 8-4: IBC 2012 limit state consequence data as a function of earthquake ground motion intensity. ... 213 Table 8-5: Probabilities of observing a building cordon with an average radius equal to the building height and a time equal to the demolition time (R=192.8 m, t=300 days) for the IBC 2012 and UBC 1973 archetypes under different scenarios. ... 218 Table 8-6: Site labels, coordinates and distances to epicentre for the buildings selected to evaluate impact on the urban community... 219 Tables included within the Appendices are listed on the first page of each Appendix.
Glossary of Terms
Abbreviations Definitions
AACE Association for the Advancement of Cost Engineering
AAD Average Annual Downtime
AAL Average Annual Loss
AFE Annual Frequency of Exceedance AISC American Institute of Steel Construction AISI American Iron and Steel Institute ASCE American Society of Civil Engineers ASD Allowable Stress Design
BORP Building Occupancy Resumption Program BSPE Building Specific Performance Evaluations CAPSS Community Action Plan for Seismic Safety CBD Central Business District
CMS Conditional Mean Spectrum CP Collapse Prevention (Limit State)
CS Conditional Spectrum
DBE Design Basis Earthquake or Design Level Earthquake DBI Department of Building Inspection
DM Damage Measure
DS Damage State or Damage State matrix
DSi Damage State i
DV Decision Variable
EDP Engineering Demand Parameter
EMMD Enveloppe of Mean of Maximum Demand EPS Earthquake Protection Systems
FEMA Federal Emergency Management Agency GIS Geographical Information System
GM Ground Motion
GMPE Ground Motion Prediction Equation HVAC Heating, Ventilation, Air Conditioning IBC International Building Code
IDR Interstorey Drift Ratio
IM Earthquake Intensity Measure IO Immediate Occupancy (Limit State)
LL Live Load
LRFD Load and Resistance Factor Design LS Life Safety (Limit State)
M or Mw Earthquake moment magnitude MCE Maximum Considered Earthquake
MCER Risk-targeted Maximum Considered Earthquake MEP Mechanical, Electrical and Plumbing
MF Moment-resisting Frame
MRF Moment Resisting Frames
Abbreviations Definitions (Continued)
NIST National Institute of Standards and Technology NLRHA Non-Linear Response History Analysis
PBEE Performance-Based Earthquake Engineering PBSD Performance-Based Seismic Design
PEER Pacific Earthquake Engineering Research Centre PFA Peak Floor Acceleration
PGA Peak Ground Acceleration
PNC Percentage of Non-Collapsed simualtions PSHA Probabilistic Seismic Hazard Analysis
RBS Reduced Beam Section
RC Reinforced Concrete
RC Repair Class matrix
RCD Repair Class Database matrix
REDi Resilience-based Earthquake Design Initiative RSCB Replaceable Steel Coupling Beam
RT Repair Time matrix
SA Spectral Acceleration
SAMAX Maximum Spectral Acceleration SAMIN Minimum Spectral Acceleration
SAT1 Spectral Acceleration at T1(fundamental period of a structure)
SDL Superimposed Dead Load
SEAOC Structural Engineers Association of California
SEAONC Structural Engineers Association of Northern California SFPIM San Francisco Property Information Map
SLE Service Level Earthquake
SPUR San Francisco Planning and Urban Research Association
UBC Uniform Building Code
UHS Uniform Hazard Spectrum
USD United States Dollar ($)
USGS United States Geological Survey
VRE Very Rare Earthquake
WGCEP Working Group on California Earthquake Probabilities WSMRF Welded Steel Moment Resisting Frame
2D Two-dimensional
List of Symbols
Abbreviations Definitions
Ag Gross cross sectional area (Table 4-4) ALR Axial load-to-capacity ratios (Section 4.2)
ASPLICE Ratio of splice to column tensile capacity (Section 4.2)
Aw Web area (Table 4-4)
C Period dependent factor (Table 2.1, Equations 4-1 and 4-2) C Exposure category (Table 4-2)
C Collapse (Equations 7-1, 7-3 and 7-4) Cc Column slenderness ratio (Table 4-4)
Cd Displacement amplification factor (Section 4.1.1) CDF Cumulative Distribution Function (Figure 4-24) Cp External pressure coefficient (Table 4-2) Cs Seismic response coefficient (Section 4.1.1) Ct Factor for period estimation (Table 2.1) Cv Web shear coefficient (Table 4-4)
D Dead load (Table 4-3)
D Peak storey displacement (Table 4-11)
D or Ds Width of the lateral resisting system (Table 2.1 and Equation 4-3) Dir. Direction (Table 4-7)
E Earthquake load (Tables 4-3 and 4-6) Epsilon (Tables 7-1 and 7-2)
e or ei Earthquake ground motion shaking intensity (i) (Figure 7-2) E/T Effective over total mass (Table 4-7)
ɛij Intra-event residual mean (Equation 8-1) EL. Elevation (Tables 4-8 and 4-9)
ER Exceedance rate (Equation 7-6) Strength reduction factor (Table 4-4) Fa Allowable compressive stress (Table 4-4) Fb Allowable bending stress (Table 4-4) Fcr Critical stress (Table 4-4)
Fi Seismic force at storey i (Table 2.1) FS Factor of safety (Table 4-4)
Ft Allowable tensile stress (Table 4-4)
Ft Seismic force atop the building (Table 2.1, Equations 4-3 and 4-4) Fv Allowable shear stress (Table 4-4)
Fx Seismic force at storey x (Equation 4-4) Fy Specified minimum yield stress (Table 4-4)
G(A|B) Conditional probability of A given B (Equation 2-1) GCpi Internal pressure coefficient (Table 4-2)
Gf Gust effect factor (Table 4-2)
hn Height of the building (Table 2.1 and Equation 4-3)
hxor hior hsx Height of storey x or i (Figure 5-6, Table 2.1, Equations 4-4 and 4-11) I or Ie Occupancy importance factor (Table 2.1 and Section 4.1.1)
Abbreviations Definitions (Continued)
Kl Effective length (Table 4-4) Kzt Topography factor (Table 4-2)
L Live load (Table 4-3)
L or Li Loss (at intensity level i) (Equation 7-3 and 7-5) lij Width of panel j at storey i (Figure 5-6)
m, n or p Matrix dimensions (Figures 4-28 to 4-31) Mn Nominal flexural strength (Table 4-4) Mp Plastic bending moment (Table 4-4) MRC Mean repair cost (Section 4.3.1) MRT Mean repair time (Section 4.3.1) My Yield moment (Section 4.2)
N or n Number of storeys (Table 2.1 and Equation 4-4) NC, NR Non-collapse, non-repairable damage (Equation 7-4) NC, R Non-collapse, repairable damage (Equation 7-4) NDS Number of Damage States (Section 4.3.1) PCollapse Probability of collapse (Equation 7-2) PDF Probability Density Function (Figure 4-24) Pn Nominal axial strength (Table 4-4)
Pt Tensile capacity of column(Section 4.2)
Px Total vertical design load above level x (Equation 4-11) Stability coefficient for p-delta effects (Equation 4-11) Q(t) Quality of system (Section 2.3)
Pre-capping plastic rotation (Section 4.2) Post-capping plastic rotation (Section 4.2)
Plastic rotation threshold for fracture (Section 4.2) Qty Quantity (Section 4.3.1)
r Radius of gyration (Table 4-4) R Distance (Table 7-1 and 7-2) S Site coefficient (Table 2.1)
S1 MCERspectral response acceleration at 1-second period (Section 4.1.1) SD1 Design spectral response acceleration at 1-second period (Section 4.1.1) SDS Design spectral response acceleration at short periods (Section 4.1.1) t Time in years (Equation 7-2)
T or T1 Fundamental period (Equation 4-2, Tables 2-1 and 4-7) TL Mapped long period transition (Equation 4-8)
V Design base shear (Table 2.1, Section 4.1.1, Equations 4-1 and 4-4) V Basic Wind Speed (Table 4-2)
Vn Nominal shear strength (Table 4-4)
VS30 Shear wave velocity in top 30 meters of soil (Figure 7-2) Vt Base shear estimated from modal response (Section 4.1.1)
Vx Seismic shear force at the storey under consideration (Equation 4-11) W Weight of the structure or seismic weight (Table 2.1 and Equation 4-1) W Wind load (Tables 4-3 and 4-6)
wxor wi Weight of storey x or i respectively (Equation 4-4) ij Ground motion parameter of interest (Equation 8-1) ij Ground motion model median prediction (Equation 8-1)
Abbreviations Definitions (Continued)
Z Seismic zone factor (Table 2.1 and Equation 4-1) ZSPLICE Ratio of splice to column bending capacity (Section 4.2) Zx Plastic section modulus (Table 4-4)
β Ratio of shear demand to capacity of the storey (Equation 4-11) βIF Dispersion, impeding factors (Tables 7-6 and 7-8)
βNon-Struct Dispersion, non-structural repairs (Tables 7-6 and 7-8) βStruct Dispersion, structural repairs (Tables 7-6 and 7-8) γij Damageable storey drift (Figure 5-6)
γp Plastic rotation (Figure 4-21)
γy Yield rotation (Figure 4-21) Δ Storey drift (Equation 4-11)
Δei Earthquake ground motion intensity interval (Figure 7-2)
Δuij Horizontal displacement at storey i along width of panel j (Figure 5-6) Δvij Vertical displacement at storey i along width of panel j (Figure 5-6) Δλi Annual rate of occurrence of intensity level I (Figure 7-2)
Δλi Annual rate of occurrence of interval i (Figure 7-2) ηij Inter-event residual mean (Equation 8-1)
θij Floor rotation at storey i along width of panel j (Figure 5-6) Λ Cumulative plastic rotation capacity (Section 4.2)
λ(e) Annual frequency of exceedance of e (Figure 7-2) λc Mean annual rate of collapse (Equation 7-1) μIF Median, impeding factors (Tables 7-6 and 7-8) μNon-Struct Median, non-structural repairs (Tables 7-6 and 7-8) μStruct Median, structural repairs (Tables 7-6 and 7-8) σij Intra-event residual standard deviation (Equation 8-1) τij Inter-event residual standard deviation (Equation 8-1)
Chapter 1
1
Introduction
1.1
Background and motivationThroughout the world, tall buildings play an important role in the socio-economic activity of major metropolitan areas. They are consistently a part of the economic structure in high performing financial and business services cities (Buchanan et al. 2008) and their resilience is vital to ensuring an effective recovery after major disasters. Events such as the Canterbury earthquake in 2011 have highlighted the impact of poor performing buildings on the business continuity of downtown districts, where tall buildings are typically clustered together. Following the 2011 earthquake, Christchurch’s Central Business District (CBD) red zone covered a significant area of the city and more than 60% of the businesses were displaced (CERC 2012). Buildings such as the 26-storey Hotel Grand Chancellor sustained significant damage and residual deformations, prompting authorities to cordon off an area with a radius that was roughly equal to its height (NZPA 2011). Thus, in addition to the direct economic losses in the Hotel Grand Chancellor, there were significant indirect losses attributed to business disruption in surrounding buildings.
Until the introduction of Performance-Based Seismic Design (PBSD) in the 1990s, most tall buildings in highly seismic regions were designed following a prescriptive force-based approach (SEAOC 1995). The performance of buildings designed following code prescriptive seismic design requirements, during major earthquakes, is not explicitly quantified in the design process, but rather assumed to be sufficient because the standards specified by the code are met. To address this limitation, the Pacific Earthquake Engineering Research Centre (PEER) developed a framework for Performance-Based Earthquake Engineering (PBEE), which considers uncertainties in the seismic hazard and structural response, and enables the quantification of the seismic performance of new and existing buildings in a more rigorous manner than previously. Following developments in PBEE, several jurisdictions in the United States, including Los Angeles and San Francisco, have adopted performance-based approaches for the design of new tall buildings (e.g., PEER 2010a). Whilst modern tall buildings follow a more adequate approach, at present, little is known about the seismic performance of older existing tall buildings that were designed prior to the adoption of PBSD (Molina Hutt et al. 2015, Wang et al. 2017).
Figure 1-1 shows the building height distribution in western US cities such as Los Angeles, San Francisco and Seattle, where damage to tall buildings has the potential to affect a large number of people and can have significant consequences on surrounding areas. Many of these existing tall buildings were designed following building codes from the late 1960's through mid-1990's, which did not specify drift limits, and prescribed design forces that were significantly lower than those in modern building codes. Such tall buildings include many steel moment frame buildings constructed with the type of welded connections that experienced sudden brittle fractures during the 1994 Northridge earthquake. Furthermore, there are several other significant considerations in modern design codes and practice, which were not adopted in older design standards, and have drastically improved seismic performance, including (1) capacity design principles, (2) prequalified seismic connection details to ensure ductile component behavior, (3) treatment of multi-mode response using response spectrum analysis methods, (4) consideration of bi-directional force components, and other factors.
Figure 1-1: Building height distribution in Los Angeles, San Francisco, and Seattle. Source: Eads et al. (2017).
While there are currently no mandatory requirements for the routine assessment or retrofit of existing steel moment frame buildings, San Francisco, Los Angeles and other US cities do have ordinances that require assessments and retrofit during substantial building renovation or within a specified time horizon, e.g. ordinances 183893 and 184081 in Los Angeles for pre-1978 wood-frame soft-storey and non-ductile concrete buildings, respectively. Looking towards the future, San Francisco’s Earthquake Safety Implementation Program (CAPSS 2011) has plans to develop assessment requirements for existing low-performance steel buildings. Just as with current programs for wood-frame or concrete buildings, the development and implementation of an effective program for steel buildings will require guidelines for screening and assessment of steel moment frames, along with practical and cost effective retrofit solutions, which this research aims to explore.
1.2
Aim, objectives and scopeEngineering seismologists, seismic, structural and geotechnical engineers have demonstrated that through PBEE, detailed assessments of individual building performance can be conducted through complex Non-Linear Response History Analysis (NLRHA) by subjecting a structural model to different ground motions at various intensity levels, e.g. Krawinkler (2004), Wang et al. (2017), Hwang and Lignos (2017). Advances in computational power and the development of models that can more accurately reproduce the behaviour of structural components have made such assessments possible. These tools can be used both for new design and for the assessment and retrofit of existing buildings in order to ensure adequate performance under seismic events of a specified return period. Estimates of the monetary losses associated with the performance of buildings can also now be conducted through approaches such as that in FEMA P58 (FEMA 2012), implemented in tools such as PACT (2012) or SP3 (2017). Furthermore, recent developments in downtime assessment methodologies for buildings (e.g. Almufti and Willford 2013) provide a framework for identifying the likely causes of downtime such that these can be mitigated to achieve a more resilient seismic performance. Despite significant progress, existing cost and downtime estimation tools limit these detailed performance assessments to individual buildings and neglect the impact of the assessed building on surrounding areas.
The overall aim of this research project is to characterize the earthquake risk of existing tall buildings in West Coast US cities that were designed following code-prescriptive guidelines developed before modern seismic building codes, and to explore retrofit techniques for enhancing their structural performance and resilience. A central component of this work is to apply the framework and latest advancements of PBEE to assess the potential risks of existing tall steel moment frame buildings. Performance is assessed through dynamic analysis of non-linear numerical models, where the results of these simulations are used to estimate damage in the building, as well as the associated consequences (direct economic loss, downtime, etc.). Collapse risk and the potential for the damaged building to be deemed irreparable is a necessary part of this process, as these potential outcomes contribute to the expected economic losses resulting from a seismic event. Such evaluations enable assessing collapse safety and whether the exhibited seismic performance has consequences on the surrounding area. As part of this work, comprehensive risk-based assessments are carried out to enable the development of risk metrics that can be used to advise policy and decision making, allowing building owners to explicitly manage seismic risk through the use of quantitative metrics. Furthermore, this project aims to integrate PBEE tools and
Geographical Information Systems (GIS) to develop a framework that enables analysis and visualization of the seismic performance assessment beyond individual buildings. This framework can help highlight critical risk hotspots, e.g., where building damage is most likely to have disproportionate impacts on the urban community, and the broader socio-economic factors that affect resilience (e.g., services provided by the affected buildings to the community). To this end, the key research objectives of the project are as follows:
1. To quantify the expected seismic performance, in terms of structural response, of existing tall steel moment frame buildings under a scenario earthquake specifically developed to assess impact on the built environment.
2. To quantify the expected seismic performance of these buildings under earthquake intensities consistent with a Design Basis Earthquake (DBE), in terms of structural performance, direct economic losses and downtime to re-occupancy and functional recovery.
3. To evaluate the impact of different strategies including innovative structural retrofits, non-structural enhancements or other measures, that can be adopted to minimize damage, direct economic losses and downtime in these buildings.
4. To assess performance under a wider range of intensities of earthquake ground motion shaking, including levels at which collapse or large permanent deformations my result in the complete loss of these buildings, their content, and their function. 5. To develop comprehensive risks metrics that can be used to help communicate the
seismic performance of these buildings including: the mean annual frequency of collapse, expected annualized losses, and expected annualized downtime.
6. To benchmark the seismic performance and associated risk metrics of these existing buildings against equivalent modern code-based designs.
7. To evaluate how different types of building-specific assessments, namely scenario, intensity or time-based assessments, can be formulated to address the specific decision making needs of various stakeholders.
8. To propose a framework that integrates PBEE with GIS tools to extend detailed seismic performance assessments beyond individual buildings, towards a framework for evaluating resilience at city-level.
The study targets districts in areas of high seismicity in the US, where a large number of tall buildings are clustered together (see Figure 1-1) and where significant damage to a single building could compromise the business continuity of surrounding areas. San Francisco is selected as a case study for most of this work, in order to permit engagement and support of ongoing efforts of the city’s Earthquake Safety Implementation Program (CAPSS 2011).
1.3
Thesis structureThis dissertation addresses the risks posed by the older seismically deficient steel buildings. Chapter 1 provides the background and motivation for this work, its objectives and scope, as well as the overall organization of the thesis.
Chapter 2 provides a literature review with a focus on the seismic design evolution of building codes in the US, and a review of PBEE for seismic performance assessment of buildings. The latter includes aspects related to seismic hazard estimation and ground motion selection, structural response simulation, and methods for estimating damage and associated consequences. A review of existing frameworks that enable an evaluation of seismic resilience is also provided.
Chapter 3 outlines the methodology adopted to address the research questions outlined in this work. The research questions are addressed through a number of risk-based assessments that evaluate expected seismic performance of individual buildings, as well as through a framework developed to enable evaluating the impact of buildings on surrounding areas and the urban community.
Chapter 4 describes key characteristics of the archetype buildings developed including geometry, structural detailing, occupancy and other relevant parameters that can affect seismic performance. This chapter also outlines the numerical models developed to obtain structural response parameters via NLRHA. It includes calibration of key structural components against experimental test data, as well as global checks against data from instrumented buildings consistent with the archetypes considered. Chapter 4 also describes the building performance models used to estimate the consequences of building response in terms of damage, economic losses and downtime. A method to extend existing assessments to enable the development of probabilistic recovery functions is proposed.
Chapter 5 presents a scenario-based seismic performance assessment of two archetype tall steel buildings. Scenario assessments evaluate building performance subject to an earthquake scenario, with a specific magnitude and location. The HayWired scenario, a Mw
7.0 earthquake on the Hayward fault, developed to study impacts on the San Francisco Bay area is used in this study. This chapter addresses objective No. 1 as outlined in Section 1.2.
Chapter 6 presents an intensity-based seismic performance assessment of an archetype tall steel building. It evaluates building performance under a specified earthquake shaking intensity consistent with a DBE. It evaluates the impact of a number of retrofit schemes, structural and non-structural, developed to achieve increased levels of resilience. This chapter addresses objectives No. 2 and 3 as outlined in Section 1.2.
Chapter 7 presents a comprehensive time-based seismic performance assessment of an archetype tall steel building. It consists of the evaluation of a number of intensity-based performance assessments under a range of ground motion intensity levels, which are then combined with seismic hazard data to provide the annual rates of exceedance of different performance measures. Performance is benchmarked against an equivalent modern code-based design. This chapter addresses objectives No. 4, 5 and 6 as outlined in Section 1.2.
Chapter 8 proposes a framework to assess the risk of existing tall steel buildings and the implications on urban resilience. The proposed framework integrates PBEE tools and seismic risk assessment methodologies into GIS, to enable an analysis and visualization of the seismic performance assessment of business districts. This chapter addresses objectives No. 7 and 8 as outlined in Section 1.2.
Chapter 9 presents the summary and major conclusions of this work. It also provides a reflection on the transferability of the method, it describes the limitations of the present study and provides recommendations for future work.
1.4
PublicationsThe work presented in this thesis has yielded a number of journal and conference publications. The following journal publications have already been published and are included for reference in Appendix A.
A1. Molina Hutt C., Almufti I., Willford M. and Deierlein G. (2015). “Seismic loss and downtime assessment of existing tall steel-framed buildings and strategies for increased resilience.” American Society of Civil Engineers, Journal of Structural Engineering, Special Issue Resilience-Based Analysis and Design of Structures and Infrastructure Systems. Available at:
http://dx.doi.org/10.1061/(ASCE)ST.1943-541X.0001314
This publication draws largely on content presented in Chapters 4 and 6.
A2.Ji X., Liu D., Ya S. andMolina Hutt C.(2016). “Seismic performance assessment of a hybrid coupled wall system with replaceable steel coupling beams versus traditional RC coupling beams.” Journal of Earthquake Engineering and Structural Dynamics. Available at:http://dx.doi.org/10.1002/eqe.2801
This publication is the result of a collaboration with Tsinghua University in Beijing, China funded through a Royal Academy of Engineering Newton Fund Award. While the results of the publication are not included within the body of the thesis, this study enables a reflection on the transferability of the methods used in this thesis to different contexts. This reflection is included in Chapter 9.
A3.Goretti A., Molina Hutt C. and Hedelung L. (2017). “Post-earthquake safety evaluation of buildings in Portoviejo, Manabí following the M7.8 coastal Ecuador earthquake of 16 April 2016.” International Journal of Disaster Risk Reduction. Available at:https://doi.org/10.1016/j.ijdrr.2017.06.011
This publication summarizes field work carried out in Ecuador following the April 2016 earthquake within the EU Civil Protection Mechanism. It does not relate directly to the thesis contents. However, it provides context and inspiration, particularly for Chapter 8, as it highlights the value of GIS in the seismic performance evaluation of buildings.
Content presented in Chapters 4 and 5 is also included in a peer reviewed report prepared in collaboration with Arup (www.arup.com) as part of the United States Geological Survey (USGS) HayWired Scenario – Tall Building Performance project (RFP – Reference Number G16PS00702).
Additionally, a number of journal publications, which draw on material directly presented in this thesis, are currently in preparation and are listed below.
Molina Hutt C., Rossetto T. and Deierlein G. (2017a). “Comparative risk-based seismic performance assessment of 1970s vs modern tall steel moment resisting frames.”
This publication draws largely on content presented in Chapters 4 and 7.
Molina Hutt C., Rossetto T. and Deierlein G. (2017b) “A framework for assessing the impact of tall building performance on the resilience of business districts.” This publication draws largely on content presented in Chapter 8.
Ji X., Liu D. and Molina Hutt C. (2017). “Evaluating the impact of replaceable steel coupling beams versus traditional RC coupling beams on the seismic recovery of buildings.”
This publication is an extension of the study presented in Appendix A2, which applies some of the methods developed in this thesis to new construction.
A number of conference papers have also been accepted and presented at international conferences. In most cases, these papers consist of preliminary results of work compiled in this thesis.
Molina Hutt C.(2017). "A comparative study on the seismic vulnerability of 1970s vs modern tall steel moment-resisting frame buildings." Proc., 16th World Conference of Earthquake Engineering,Santiago, Chile (oral presentation).
Eads L.,Molina Hutt C.and Menun C. (2017). "Loss assessment of tall buildings from a vulnerability perspective." Proc., 16th World Conference of Earthquake Engineering,Santiago, Chile (oral presentation).
Molina Hutt C., Almufti I., Willford M. and Deierlein G. (2015). "Risk-based seismic performance assessment of existing tall steel-framed buildings in San Francisco."Proc., SECED 2015 Conference: Earthquake Risk and Engineering towards a Resilient World,Cambridge, UK (oral presentation).
Molina Hutt C., Almufti I., Willford M. and Deierlein G. (2014). "Seismic loss and downtime estimates of existing tall buildings and strategies for increased resilience."Proc., 2nd European Conference of Earthquake Engineering and
Seismology,Istanbul, Turkey (oral presentation).
Molina Hutt C. (2013). "Non-Linear time history analysis of tall steel moment frame buildings in LS-DYNA." Proc., 9th European LS-DYNA Conference,Manchester, UK (oral presentation).
Almufti I., Molina Hutt C., Willford M. and Deierlein G. (2012). "Seismic assessment of typical 1970s tall steel moment frame buildings in downtown San Francisco."Proc., 15th World Conference of Earthquake Engineering,Lisbon, Portugal (oral presentation).
Molina Hutt C.(2011). “Seismic assessment and retrofit recommendations for tall steel moment frame buildings in San Francisco.”Proc., Arup University 2011 Doctoral College Conference, London, UK (oral presentation).
Throughout my time at UCL, I have had the opportunity to engage on a number of activities which, whilst not directly related to the work presented in this thesis, have provided inspiration to the later chapters and valuable insight into other areas of earthquake engineering research. Some of the associated outputs and publications are listed below.
Perez-Fuentes G.,Molina Hutt C., Rossetto T. and Joffe H. (2017). "Are residents of Seattle ready for ‘the big one’? An intervention study to change earthquake preparedness."Proc., 16th World Conference of Earthquake Engineering,Santiago, Chile (oral presentation).
EEFIT (2013). “The Mw9.0 Tōhoku earthquake and tsunami of 11th March 2011 -
return mission.” Institution of Structural Engineers.
ECHO (2016). “Earthquake in Ecuador.” European Commission, Humanitarian Aid and Civil Protection, ECHO’s Next - Newsletter for Civil Protection National Experts, Issue 12, June/July 2016.
Molina Hutt C.(2016). “The guardians of public safety in Ecuador.” The Blog of the Institution of Structural Engineers.
Chapter 2
2
Literature Review
This chapter presents a review of the literature with a focus on three distinct areas. The first section provides a historical overview of seismic design provisions in US building codes, vulnerabilities in steel moment frame buildings with welded beam-to-column connections, and considerations related to the seismic design of tall buildings and associated loss evaluations. The second section provides an overview of state of the art methods for seismic performance assessment of buildings with a focus on the PEER PBEE framework and its implementation to enable decision making for seismic risk mitigation. The last section provides a review of methods for evaluation and quantification of seismic resilience. Overall, this review provides context, identifies research needs and sets the point of departure for this work.
2.1
Seismic vulnerability of existing tall steel buildings in the US
Seismic design evolution of building codes
The seismology committee of the Structural Engineers Association of California (SEAOC) is the originator of seismic design provisions in the US. Since 1959, this committee published a number of editions of “Recommended Lateral Force Requirements and Commentary,” informally referred to as the ‘SEAOC Blue Book’. These recommendations, which had no legal standing, progressively made their way into the building code regulations, the Uniform Building Code (UBC). The Blue Book of 1959 (SEAOC 1959) already established performance goals, which are still today found in building codes. The objective of the lateral force requirements outlined in the Blue Book of 1959 is to produce structures capable of resisting: minor earthquakes without damage, moderate earthquakes without structural damage, but some non-structural damage and major earthquakes without collapse, but possibly both structural and non-structural damage. At the time of publication, knowledge was insufficient to provide rigorous criteria to ensure these performance goals, hence they were achieved by empirical base shear equations intended to account for different complex phenomena. These equations in conjunction with elastic drift limits and detailing requirements were intended to provide collapse safety and damage control. These principles are still present in modern codes in the form of ductility, achieved through seismic detailing, and capacity design principles where enough ductility cannot be achieved.
Significant changes to US building codes came about in the 1970s, mainly in terms of how seismic inputs were defined. Principles of seismic hazard analysis from Cornell (1968) were implemented to develop hazard maps with effective peak accelerations for a 475 year return period event. These mapped parameters, in conjunction with soil profile coefficients, were used to derive ground motion spectra (ATC 1978). Force-based design requirements, based on the first mode lateral force coefficient, were the predominant method of design, along with the concept of a response modification factor, to permit elastic force design requirements for systems that are expected to behave inelastically. These design principles were based strictly on elastic behaviour without consideration of the deformation capacity of different systems. These concepts are still present in modern building codes. However, they are significantly more detailed and the seismic inputs for design, in the US, have shifted toward a 2475 year return period event, defined as the Maximum Considered Earthquake (MCE), which is later scaled by two-thirds to define the DBE. The notion of a response modification factor is still present and is currently specified for roughly 70 different structural system types in ASCE 7 (ASCE 2010).
Lee and Foutch (2000) conducted a review of seismic design provisions for all editions of the UBC from 1958 to 1994. Based on changes to the provisions for seismic design, these editions of the UBC can be subdivided into three main groups: UBC 1958 to 1973, UBC 1976 to 1985, and UBC 1988 to 1994. Changes to the design methodology, highlighting design considerations for steel Moment Resisting Frames (MRF), are summarized below and illustrated in Table 2-1.
From 1958 to 1973 seismic and steel design requirements in the UBC did not undergo significant changes. A horizontal force factor of 0.67 was used for MRF structures, regardless of material. This factor is analogous to the response modification factor previously discussed, which is introduced to permit elastic force design requirements. Regarding steel MRFs, two requirements were introduced: (i) capacity design for moment connections and (ii) the use of compact sections for members that were intended to develop plastic hinges.
From 1976 to 1985, a site coefficient and an importance factor were introduced in order to emphasize the impact of a building’s site and occupancy respectively. A new seismic zone was introduced. Most importantly, an interstorey drift limit of 0.005 under the seismic forces defined in the code was introduced. The distribution of lateral forces was modified by re-defining the lateral force applied atop the building. This change resulted in considerably larger forces atop the building for tall and slender structures, such as steel MRFs, than those in prior codes.
From 1988 to 1994, seismic regulations adopted the recommendations of the SEAOC Blue Book of 1988. The response modification factor was changed to reflect the energy dissipation and ductility of different structural systems and the seismic zone factor was changed to represent the effective peak ground acceleration representative of a 475 year return period event. From a steel design point of view, panel zone provisions were included in the code, as well as strong column-weak beam requirements.
Figure 2-1: Design spectra for UBC 1973 to 1994 versus modern building codes. Sources: Lee and Foutch (2000) and ASCE (2010).
Table 2-1: Key specifications from UBC 1973, 1985 and 1994 related to seismic principles and steel MRF design.
Source: Adapted from Lee and Foutch (2000)
UBC 1973 UBC 1985 UBC 1994
Allowable Stress Allowable stresses can be increased by 1/3 when considering earthquake forces. Seismic Zones 3 4 4 Base Shear V=Z·K·C·W C=0.05/T1/3 K=0.67 for MRF V=Z·I·K·C·S·W C=1/(15·T1/2) K=0.67 for MRF V=Z·I·C·W/Rw C=1.25·S/T2/3 Rw=12 for MRF
Period 0.1N for steel MRF T=Ct·hn3/4
Distribution of forces V=Ft+∑Fi Ft=0.004V·(hn/D)2 V=Ft+∑Fi Ft=0.07T·V Drift Limits In accordance with accepted engineering practice Storey drift < 0.005 with displacement amplified by (1/K) For T>0.7 sec Limit = 0.03/Rw or 0.004*hi Steel MRF Requirements
-Connections able to develop full plastic capacity
-Local buckling to satisfy plastic design
-Panel zone strength and thickness -Strength Ratio (strong
column-weak beam)
See List of Symbols for variable definitions.
0.00 0.02 0.04 0.06 0.08 0.10 0.12 0.14 0.00 1.00 2.00 3.00 4.00 S p ec tr a l A cc el er a ti o n (g ) Period (sec) UBC 73 UBC 79 & 85 UBC 88 & 94 ASCE 7-10


![An account of Marinogammarus (Schellenberg) gen.nov. [Amphipoda], with a description of a new species. M Pirloti](data:image/gif;base64,R0lGODlhAQABAIAAAP///wAAACH5BAEAAAAALAAAAAABAAEAAAICRAEAOw==)