Volume-03 ISSN: 2455-3085 (Online) Issue-11 RESEARCH REVIEW International Journal of Multidisciplinary
November -2018 www.rrjournals.com [UGC Listed Journal]
Consumers‟ Attitude and Perception towards Short Message Service (SMS)
Advertising through Mobile Phones
*1
Vipin K.P & 2Sumathy. M. 1
Ph.D. Research Scholar, School of Commerce, Bharathiar University, Coimbatore, Tamilnadu (India) 2
Dean, Professor & Head, School of Commerce, Bharathiar University, Coimbatore, Tamilnadu (India)
ARTICLE DETAILS ABSTRACT
Article History
Published Online: 10 November 2018
In India there are over 1170 million mobile subscribers and it is increasing day by day. This has paved the way for many companies of goods and services in the state to manage their sales promotions through the mobile telephone platform. SMS marketing is one of the most popular kinds of mobile marketing. The present research investigates consumer‟s attitude and perception towards SMS advertising and a descriptive research design is made to extract the relevant factors bearing on consumer attitude towards SMS based advertisements and users actual behavior. A sample of 110 smart phone users from Malappuram District of Kerala state has been taken for the study by using convenient sampling method. Malappuram district consist of 25 lakh smart phone users due to time and cost constraints sample size it‟s fixed to 110. The data required for the study were collected by using of the interview schedule method. The questionnaire was prepared in English language, the investigator recorded the responses in the instrument. The instrument consist of five point scale Likert scale statements relating to attitude and perception towards short message service (SMS) advertising through mobile phones. The collected data analyzed by employing factor analysis and independent sample t-test. The result reveal that there are no difference in perception towards privacy in relation to SMS advertisements among male and female. The study also found that privacy and disturbance related perception factors, purchase intention related perception factors and finally content related perception factors are the leading factors contributing to the perception towards SMS advertisements.
Keywords
SMS Advertisements, Mobile Phone, Consumer Behavior
*Corresponding Author
Email:vipinkpp[at]gmail.com
1. Introduction
In the current scenario, mobile internet applications enable consumers to access a variety of services: Web information search, SMS (short message service), MMS (multimedia message service), banking, payment, gaming, e-mailing, chat, weather forecast, GPS (global positioning service), and so forth. Collectively, we denominate this wide array of services as “m-commerce.” These digital media are considered to potentially improve the possibilities to reach consumers by allowing personalization of the content and context of the message. Combining customer‟s user profile and the context situation, advertising companies can provide the target customers exactly the advertisement information they desire, not just “spam” them with irrelevant advertisements. Mobile
advertising is a brand new phenomenon. Yunos et al. (2003)
defined mobile advertising as marketing and advertising activities that deliver advertisements to mobile devices using wireless networks and mobile advertising solutions to promote goods and services and build brand awareness. The unprecedented technological development in mobile devices, mobile computing and mobile web has resulted in significant
growth of mobile commerce, which refers to one or two--‐way
exchange of value facilitated by a mobile device (MMA, 2010). In the context of retailing, mobile commerce encompasses
shopping via the Internet--‐enabled mobile devices (i.e.,
smartphones and tablets) that is rapidly emerging as a new retail channel. A study done by Heinonen & Strandvik (2003) showed that mobile channels are perceived to be more personal than traditional and email channels. This creates high expectations for the relevance of marketing communication
messages. A consumer expects messages to be personal and of high interest and this makes the disappointment greater when they get undesired messages.
2. Objectives of the study
The following are the important objectives of the study 1. To assess the number of mobile phone users in India 2. To identify the general attitude of the people towards
SMS advertising.
3. To evaluate the factors affecting the attitude of the customers towards SMS advertising.
Hypothesis
1. There is no significant difference in perception towards privacy in relation to SMS advertisements among male and female.
3. Research Methodology
This study consists of 110 samples customers of mobile users in the area of Malappuram district of Kerala. The data set include, primary data were collected by field survey method using a structured questionnaire and secondary data were collected from various data bases, Internet, Business articles, business periodicals, TRAI (Telecom Regulatory Authority of India ) report etc. Apart from this data, the leading journals and magazines relating to mobile advertising sector were also referred for this study. In the present study the technique used by the researcher is a non-probability sampling method of purposive sampling. The respondents are purposively selected on the basis of ownership of the mobile. Further they are
considered on the basis of using mobiles and receiving SMS advertisements and interesting to give response towards questionnaire. In these study areas, the total numbers of respondents are 110 which include various Questionnaire is the main tool for data collection and the questions are on five
point Likert scale from strongly disagree (1) to strongly agree (5), the field survey method was adopted for collection of data. The data is analyzed through simple percentage method independent sample t-test, factor analysis etc.
4. Result and discussion
Table -1 Wireless Subscribers in India
Area November 2017(in millions) December 2017(in millions)
Urban 664.94 668.44
Rural 497.53 499
Total 1162.47 1167.44
Source: Telecom Regulatory Authority of India Report 2017
Figure -1 Wireless Subscribers in India
Total wireless subscribers (GSM, CDMA & LTE) increased from 1,162.47 million at the end of Nov-17 to 1,167.44 million at the end of Dec-17, thereby registering a monthly growth rate of 0.43%. The Wireless subscription in urban areas increased from 664.94 million at the end of Nov-17 to 668.44 million at the end of Dec-17, and wireless subscriptions in rural areas
also increased from 497.53 million to 499.00 million during the month. The monthly growth rates of urban and rural wireless subscription were 0.53% and 0.29% respectively. The growth in the number mobile subscribers shows the prospects advertising through mobile phones. There is a wide scope for SMS advertisements in India.
Table 2. Demographic features of respondents
Demographic variable frequency Percntage
Gender Male 65 59.09 Female 45 40.91 Occupation Government service 53 48.2 Privet employees 12 10.9 Students 9 8.2 Business 26 23.6 Others 10 9.1 Monthly Income Below 15000 49 44.5 15000-25000 36 32.7 25000-45000 17 15.5 45000-55000 8 7.3
The demographic profile of the respondents shows that 59.09% of the respondents are male and40.91% of the respondents are female. The table also shows that 48.2% of
the respondents are government employees. 44.5% of the respondents have an income of below Rs.15000.Income level,
education and gender have greater role in influencing consumer behavior towards SMS advertisements.
Factors influencing perception towards SMS advertisements through mobile phone
There are many factors influencing on the formulation of perception towards SMS advertisements through mobile
phone. Taking all 13 variables for next stage analysis is not necessary because respondents might have similar perception for one or two variables. To reduce 13 variables into a minimum manageable number of variables factor analysis is applied. The variables are grouped by exploring common dimensions available among the variables
Table 3- KMO and Bartlett’s Test
Kaiser-Meyer-Olkin Measure of Sampling Adequacy. .580
Bartlett's Test of Sphericity
Approx. Chi-Square 268.850
Df 78
Sig. .000
Before going for factor analysis, suitability of data for the purpose of factor analysis has to be tested. KMO test and Bartlett‟s test are two such examinations. The value of KMO of 0.580 shows that a factor analysis is useful for the present data. Bartlett‟s test of Sphericity indicates whether the correlation matrix is an identity matrix, which would show that the variables are unrelated. The significance level gives the outcome of the trial. Hither, the significant value is 0.000 which suggests that there exist significant relationships among the variables. The resultant value of KMO test and Bartlett‟s test indicate that the present data is useful for factor analysis.
The next step in the process is to decide about the number of factors to be derived. The thumb rule is factors which are having „Eigen values‟ greater than unity can be accepted. For the use of extraction Principal Component Analysis method is applied. The Component metrics so formed is further rotated orthogonally using a Varimax rotation algorithm for convenience factors are cut to three. After the rotation all the program lines are loaded with the three ingredients. The results so obtained have been given in the tables separately along with factor loadings.
Table 4 Total Variance Explained on Interest
Compone nt
Initial Eigenvalues Rotation Sums of Squared Loadings
Total % of Variance Cumulative % Total % of Variance Cumulative %
1 2.712 20.861 20.861 2.180 16.770 16.770 2 1.900 14.616 35.477 1.966 15.122 31.892 3 1.367 10.518 45.996 1.834 14.104 45.996 4 1.237 9.517 55.513 5 1.124 8.648 64.161 6 .975 7.500 71.661 7 .792 6.089 77.750 8 .655 5.038 82.788 9 .616 4.735 87.523 10 .481 3.697 91.220 11 .456 3.511 94.731 12 .414 3.181 97.913 13 .271 2.087 100.000
From the 13 statements only 5 statements have Eigen values more than 1. This means that these 5 statements can be used to explain maximum variance in the characteristics of people. The total variance accounted by all the three factors is 45.996 percent. This means that significant amount of variance
is explained by the reduced three factors alone. Therefore it is better to take three variables alone for further analysis. Among the three factors, the first factor accounts for around 17 percent of variance.
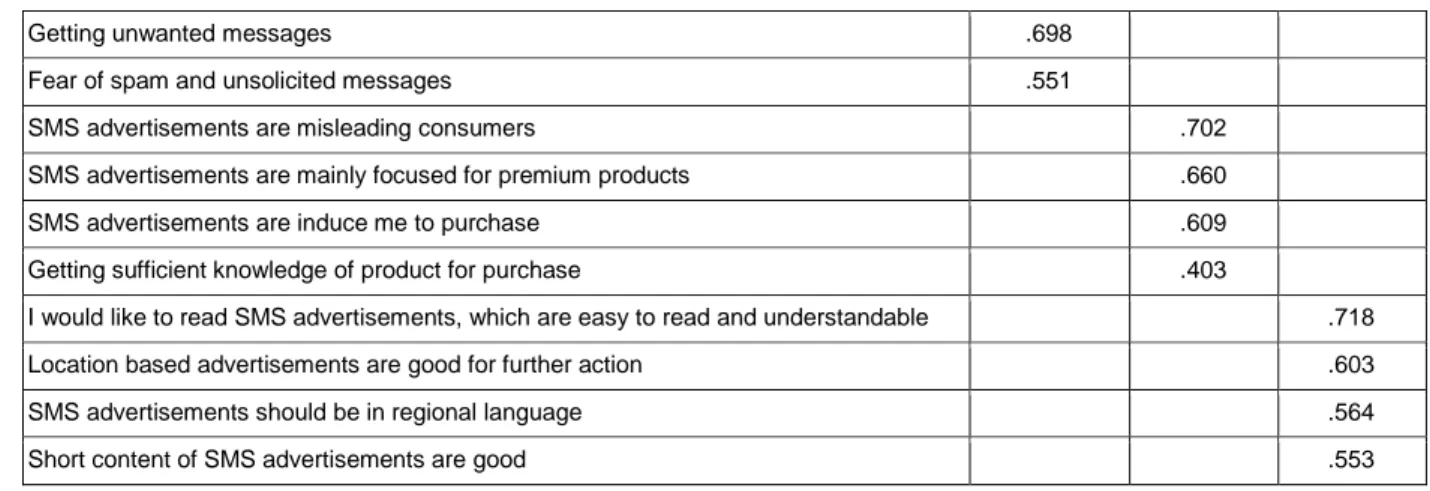
Table 5 Rotated component matrix
Statements Component
1 2 3
SMS advertisements are sending without prior permission .754
Getting unwanted messages .698
Fear of spam and unsolicited messages .551
SMS advertisements are misleading consumers .702
SMS advertisements are mainly focused for premium products .660
SMS advertisements are induce me to purchase .609
Getting sufficient knowledge of product for purchase .403
I would like to read SMS advertisements, which are easy to read and understandable .718
Location based advertisements are good for further action .603
SMS advertisements should be in regional language .564
Short content of SMS advertisements are good .553
From the rotated component matrix it is clear that the first factor is having four statements, the second factor is having four statements and the third factor is having four statements. Based on the statements included in the factors can be named.
The reduced three factors are privacy and disturbance related perception factors, purchase intention related perception factors and finally content related perception factors
Table 6-Unwanted attributes in mobile advertisements
Attribute Frequency Percentage
Generalized advertisements 26 23.63
Lack of useful information 32 29.09
Unwanted timing 32 29.09
Repetition 20 18.18
Figue 2- Unwanted attributes in mobile advertisements Table 2 and figure 2 show that unwanted attributes in mobile advertiseents. It is inferencecd that 29.09 percent of the respondents are identified that SMS advertisements are does not contetnt useful information, again the 29.09 percent people
responded that advertismettns are sending in unwanted timing. 23.63 percent of the total respondent says that SMS advertisemets are generalised in nature and rest of the people opinioned that SMS advertisemts are repitive in nature. Table –7 independent sample t- test -Group Statistics
Statement Gender N Mean Std. Deviation Std. Error Mean
I have the Fear of spam and unsolicited messages MALE 65 3.17 1.140 .141
FEMALE 45 2.96 1.147 .171
Getting unwanted messages MALE 65 3.31 1.074 .133
FEMALE 45 3.62 .912 .136
I Concerned about my privacy and personal data MALE 65 3.68 .970 .120
FEMALE 45 4.00 .929 .139
SMS advertisements are sending without prior permission
MALE 65 3.98 .893 .111
Assumptions
Levene's Test for
Equality of Variances t-test for Equality of Means
F Sig. t df Sig. (2-tailed)
I have the Fear of spam and unsolicited messages
Equal variances assumed .242 .624 .964 108 .337
Equal variances not assumed .963 94.379 .338
Getting unwanted messages Equal variances assumed 1.056 .306 -1.604 108 .112
Equal variances not assumed -1.653 103.491 .101
I Concerned about my privacy and personal data
Equal variances assumed .630 .429 -1.747 108 .083
Equal variances not assumed -1.761 97.335 .081
SMS advertisements are sending without prior permission
Equal variances assumed .334 .564 .414 108 .680
Equal variances not assumed .409 90.929 .683
The p-value of Levene's test and for t test is greater than
".000" for all statements, so we accept the null of Levene's test and conclude that there is no variance in perception towards privacy in relation with SMS advertisements of male is not
significantly different than that of female. It had
observed p > α, then we would have used the "Equal variances
assumed" 5. Conclusion
Mobile technology‟s magical characteristics of an anywhere, anytime, easy to use personal device makes it one of the strongest channels for retail shopping. All the same, despite of all the inherent advantages of mobile shopping, adoption remains low. This field, therefore is an early step in the way of seeing the role of psychographic and behavioral components that encourage or inhibit customer intention to utilize mobile devices for shopping and purchase. It can be understood from the psychoanalysis of the results that a bulk of the collected respondents are favored to get the SMS ads if
their tastes are accepted into consideration before sending the ads and further those who are disagree they have a negative attitude toward SMS ads. By dissecting the results it is found that some of the mobile users are getting wild while getting SMS ads due to inconvenient at times when they are in use and especially at working hours therefore the advertisers need to see the time convenience of the customers while sending the SMS ads. According to TRAI (Telecom Regulatory Authority of India), an average Indian sends 29 text messages a month. Text messages in India are not only applied for personal communication. People hold back their bank balances, book tickets for movies, check air ticket and train ticket status, pay their bills, and do loads more. The response rate for text message marketing in India is real impressive. One in every three urban Indians has responded to such marketing campaigns either by forwarding the messages to his friends or by naming the sender to obtain more inside information.
References
1. Adhami, M. (2013). Using Neuromarketing To Discover How We Really Feel About Apps. International Journal of Mobile Marketing, 8(1), 95–103. https://doi.org/89412796
2. Ahanonu, K., Biggerstaff, P., Flacuks, A., Hatfield, M., Nahman, M., Seal, K., … Yerelian, D. (2013). Mobile Brand Interaction in South-East Asia: A Comparative Study.
International Journal of Mobile Marketing, 8(2), 5–18. 3. Anusha, G. (2016). Effectiveness of Online Advertising.
Anusha* EFFECTIVENESS OF ONLINE ADVERTISING International Journal of Research – Granthaalayah, 43(3),
14–21. Retrieved from
http://granthaalayah.com/Articles/Vol4Iss3/03_IJRG16_SE03 _03.pdf
4. Betta, P. Di, & Lucera, F. (2013). Segmentation , involvement and the reach-engagement relationship : Evidence from a qr code advertising campaign. International Journal of Mobile Marketing, 8(2), 30–41.
5. Bhave, K., Jain, V., & Roy, S. (2013). Understanding the Orientation of Gen Y Toward Mobile Applications and in-App Advertising in India. International Journal of Mobile Marketing. Summer2013, 8(1), 62–74.
6. Deshwal, P. (2016). Online advertising and its impact on consumer behavior. International Journal of Applied Research, 2(2), 200–204. Retrieved from www.allresearchjournal.com
7. Huan Chen, Fang Liu, T. Da. (2013). Chinese Consumers ‟
Perceptions Toward Smartphone and Marketing
Communication on. Mobile Marketing Association, 8(1), 38– 46.
8. Jay Sang Ryu, & Ryu, J. S. (2013). Mobile Marketing Communications in the Retail Environment: A Comparison of Qr Code Users and Non-Users. International Journal of Mobile Marketing, 8(2), 19–29. Retrieved from http://search.ebscohost.com/login.aspx?direct=true&db=buh &AN=95277944&site=ehost-live&scope=site
9. Karim, S., & Reddy, S. K. (2013). Mobile advertising and its impact on the customers mind : Case of New Delhi ( India ).
Science, Technology and Arts Research Journal, 2(1), 103– 107.
10. Kumar, Archana; Mukherjee, A. (2013). Shop While You Talk: Determinants of Purchase Intentions Through a Mobile Device. International Journal of Mobile Marketing, 8(1), 23– 38.
11. Kumar, A. (2013). Scope and Impact of SMS Advertising in India : The Case of Bundelkhand Region. International Journal of Business Research and Development, 2(1), 28– 34. https://doi.org/10.24102/ijbrd.v2i1.111
12. Mishra, P. (2014). Rise of Online Advertising in India : An Overview. Mass COmmunication and Journalism, 4(1), 1–3.
https://doi.org/10.4172/2165-7912.1000172
13. Ravindra Reddy. T, D. R. N. (2011). A Study On Indian Consumers ‟ Attitude Towards SMS Advertising Through Mobile Phones, 1(1), 38–43.
Mobile Marketing in the Current Indian Scenario and Proposing CUSTOMERIZATION as a Solution. Jaipuria Institute of Management, Lucknow, 1–15.
15. Tripathi, S. N., & Siddiqui, M. H. (2008). Effectiveness of mobile advertising: The indian scenario. Vikalpa, 33(4), 47– 59. https://doi.org/10.1177/0256090920080404
16. Hassim Mohamed Yunos, Jerry Gao, (2004) Wireless Advertising Department of Computer Engineering San Jose State University.
17. Heinonen, Kristina & Strandvik, Tore (2003): Consumer responsiveness to marketing communication in digital channels, FeBR2002 Frontiers of e-Business Research 2002, ed. M. Hannula, A-M. Järvelin & M. Seppä, pp. 137-152, Tampere University of Technology and University of Tampere
18. https://www.trai.gov.in/sites/default/files/PR_No.23_TSD_En g_16022018.pdf