Preventing Impaired
Driving
Ralph W. Hingson, Sc.D., Timothy Heeren, Ph.D., and Michael R. Winter, M.P.H.
Although moderate drinking does not necessarily increase a person’s blood alcohol concentration (BAC) to the level at which driving is legally prohibited in the United States, any drinking can impair driving tasks. In addition to laws establishing lower legal BAC limits for drivers, legislative approaches for reducing alcohol-impaired driving include imposing sanctions for drinking and driving and restricting alcohol’s availability. KEY WORDS: moderateAOD use; drinking and driving; AOD impairment; BAC; DWI laws; sanction; AOD availability; minimum drinking age; traffic accident; AODR (alcohol and other drug related) mortality; literature review
A
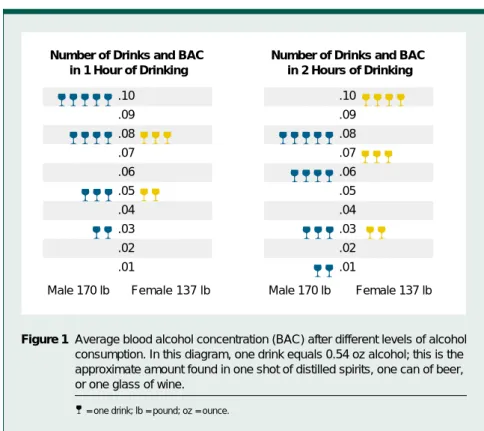
driver does not necessarily have to be intoxicated to be impaired by alcohol. Even moderate drinking, defined as drink-ing no more than two drinks per day for men and no more than one drink per day for women (National Institute on Alcohol Abuse and Alcoholism [NIAAA] 1995), may impair driving performance. This level of drinking generally results in a blood alcohol concentration (BAC) of 0.03 percent for both men and women (if the drinks are consumed in 1 hour on an empty stomach) (see figure 1). A person’s risk of involvement in a fatal crash nearly doubles with each 0.02-percent increase in BAC (Zador 1991). In 1997, 18 percent of fatally injured drivers who tested positive for alcohol had BACs between 0.01 and 0.09 percent (National High-way Traffic Safety Administration [NHTSA] 1998a), a range that falls below the legal BAC limit for drivers in most States. Eight percent of these drivers had BACs between 0.01 and 0.04 percent.This article explores the relationship between alcohol consumption and impairment and examines legislative approaches for reducing alcohol-impaired driving, including laws low-ering the legal BAC limits for drivers, sanctions imposed for impaired driv-ing, and strategies for restricting alco-hol’s availability.
Moderate Drinking
and Impairment
Even at low BAC levels, alcohol impairs driving performance by reducing the driver’s reaction time and slowing his or her decisionmaking process (Moskowitz et al. 1985). A driver’s ability to divide his or her attention between two or more visual stimuli can be impaired at BACs of 0.02 per-cent or lower (Starmer 1989; Howat et al. 1991; Moskowitz et al. 1985). Starting at BACs of 0.05 percent, drivers exhibit impairment in eye movement, glare resistance, visual perception, reaction time, certain
types of steering tasks, information processing, and other driving compo-nents (Starmer 1989; Howat et al. 1991; Hindmarch et al. 1992; Finnegan and Hammersley 1992). Currently, the legal BAC limit for noncommercial drivers in most States is 0.10 percent. Thus, although moderate drinking may impair driving ability, most States have legal BAC limits for drivers that exceed the BAC level reached as a result of moderate drinking. Consequently, mod-erate drinkers, although often impaired, can still drive legally.
Alcohol absorption and metabolism vary among people, depending on
RALPHW. HINGSON, SC.D., is a
profes-sor and chair of the Social and Behavioral Sciences Department;
TIMOTHYHEEREN, PH.D., is a
profes-sor in the Epidemiology and
Biostatistics Department; and MICHAEL
R. WINTER, M.P.H., is a statistical
coordinator in the Data Coordinating Center at the Boston University School of Public Health, Boston,
tissue. Typically, a 170-pound man would need to consume five drinks in 1 hour on an empty stomach to reach a BAC of 0.10 percent. To reach a BAC of 0.08 percent, the legal limit in 17 States, a 170-pound man would need to consume four drinks in 1 hour on an empty stomach (see figure 1).
Women absorb and metabolize alcohol differently than do men. In general, compared with men, women contain a smaller amount of body water to absorb each drink. Women also exhibit lower activity levels of the alcohol-metabolizing enzyme alcohol dehydrogenase (ADH) in the stomach, causing a larger portion of ingested alcohol to reach the blood (NIAAA 1997). A 137-pound woman would need to consume three drinks in 1 hour on an empty stomach to reach a 0.08-percent BAC and four drinks in 2 hours to reach a 0.10-percent BAC (see figure 1). Drinking over a longer period of time and eating while drinking extend the number of drinks required to reach these BAC levels (NHTSA 1997).
Although moderate drinking may not cause a person’s BAC to exceed the legal limit for driving, moderate drink-ing increases the risk of bedrink-ing involved in a fatal crash. Compared with drivers who have not consumed alcohol, drivers with BACs between 0.02 and 0.04 percent are 1.4 times as likely to be involved in a single-vehicle fatal crash. Furthermore, this risk increases to an estimated 11.1 times higher for drivers with BACs between 0.05 and 0.09 percent, 48 times higher for drivers with BACs between 0.10 and 0.14 percent, and 380 times higher for drivers with BACs at or above 0.15 percent (Zador 1991).
For drivers under age 21, fatal crash risk increases more with each 0.02-percent increase in BAC than it does for older drivers (Zador 1991). At all BAC levels including zero, the fatal crash risk for female drivers ages 16 to 20 is at least double the risk for female drivers age 25 and over, and the risk for male drivers ages 16 to 20 is triple
than older drivers and are more likely to take risks in traffic, such as speeding, disobeying traffic signals, and not wear-ing safety belts (Hwear-ingson and Howland 1993). Because alcohol consumption further increases the risk of crash involvement for young drivers, all States have adopted zero-tolerance laws for drivers under age 21, prohibiting driving after any alcohol consumption.
Recognizing the threat to the public safety associated with even moderate drinking and driving by transporta-tion workers, the Federal government prohibits commercial truck drivers, railroad and mass transit workers, marine employees, and aircraft pilots from operating their vehicles with a BAC at or greater than 0.04 percent. To reach this relatively low BAC limit, however, most people would have to drink above the level of mod-erate drinking. The American Medical Association (1986) has endorsed low-ering the legal BAC limit to 0.05 per-cent for all drivers; however, no State has yet adopted this standard.
moderate drinking. The legal limit in Canada, Austria, and the United Kingdom is 0.08 percent. Legal limits in Australia range from 0.05 to 0.08 percent. The Netherlands, Finland, France, Germany, and Japan all have 0.05-percent legal limits. Sweden has lowered the legal BAC limit for drivers to 0.02 percent (NHTSA 1997).
Legislative Measures
Society has implemented a variety of legislative measures to reduce alcohol-impaired driving. To date, U.S. laws have not attempted to restrict adult drivers to moderate drinking. None-theless, research indicates that laws adopted in the United States have reduced alcohol-related traffic deaths among both moderate drinkers and those who have very high blood alcohol levels. Current U.S. laws that limit drivers’ BACs to 0.10 and 0.08 percent have been found effective for reducing alcohol-related crashes, as have license
Figure 1 Average blood alcohol concentration (BAC) after different levels of alcohol consumption. In this diagram, one drink equals 0.54 oz alcohol; this is the approximate amount found in one shot of distilled spirits, one can of beer, or one glass of wine.
= one drink; lb = pound; oz = ounce. .10 .09 .08 .07 .06 .05 .04 .03 .02 .01
Number of Drinks and BAC in 1 Hour of Drinking .10 .09 .08 .07 .06 .05 .04 .03 .02 .01 Female 137 lb Male 170 lb Female 137 lb Male 170 lb
Number of Drinks and BAC in 2 Hours of Drinking
revocation/suspension and other penalties for exceeding those limits as well as laws restricting access to alcohol.
Legal BAC Limits for Drivers
Reducing the BAC level at which people can legally drive can effectively reduce alcohol-related traffic crashes (e.g., Johnson and Fell 1995; Hingson et al. 1996). Drivers under age 21 are subject to lower BAC limits than older drivers, and a few States have set lower limits for drivers previously convicted of driving while intoxicated (DWI).
Lowering the Legal BAC Limits to 0.08 Percent for Drivers Over Age 21.
Seventeen States have lowered the criminal per se legal BAC limit from 0.10 to 0.08 percent for noncommercial
drivers age 21 and older (lower limits have been established for drivers younger than age 21 and are discussed later in this article). According to the criminal per se provision, prosecutors are not required to introduce evidence other than a BAC of 0.08 percent or higher to demonstrate impairment, thereby mak-ing convictions easier to obtain. These laws also have administrative license revocation (ALR) provisions, which permit police officers to immediately seize the license of any driver with a BAC of 0.08 percent or higher. The person’s license is then suspended until either a hearing or trial is conducted.
Several studies have examined the effects of 0.08 laws on fatal crash trends. In California, the largest State to adopt a 0.08 law, researchers found a 12-percent decline in alcohol-related fatal
crashes after the law was adopted. Because California also adopted an ALR law 6 months after the criminal per se law, the separate effects of each law are difficult to determine (NHTSA 1991). According to one study, most of the effects occurred after the ALR provisions were added (Rogers 1995).
Johnson and Fell (1995) monitored six measures of driver alcohol involve-ment in the first five States to adopt 0.08 laws (Utah, Oregon, Maine, California, and Vermont) and identi-fied several statistically significant pre-to post-law decreases. Because the study did not compare States with the 0.08 law with States that did not have the law, researchers could not determine whether the changes were indepen-dent of general regional trends. The researchers concluded that the effects of the law were independent of national trends.
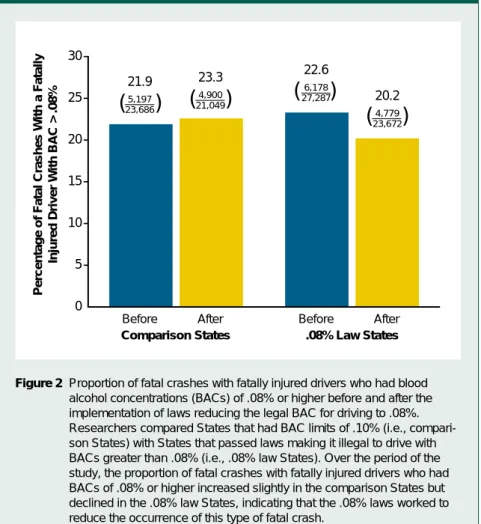
In a subsequent analysis, Hingson and colleagues (1996) paired the aforementioned first five States to adopt a 0.08 law with five nearby States that retained the 0.10-percent legal BAC limit (Idaho, Washington, Massachusetts, Texas, and New Hampshire). Relative to the compari-son States, the States that adopted the 0.08 law experienced a significant reduction (i.e., 16 percent) in the pro-portion of fatal crashes involving fatally injured drivers with BACs of 0.08 percent or higher (see figure 2). These results resembled those reported in both the United Kingdom and France when those countries first combined 0.08 laws with automatic license revocation provisions (Ross 1973; Ross 1982).
The majority of drivers killed in traffic crashes in 1997 who tested positive for alcohol had BACs of 0.15 percent or higher. The first five States to adopt the 0.08 law also experienced a significant decline (i.e., 18 percent) relative to the comparison States in the proportion of fatal crashes involv-ing fatally injured drivers with BACs of 0.15 percent or higher (Hingson et al. 1996). Compared with 0.10-percent States, the 0.08-percent States may have been more concerned about alcohol-impaired driving and more
Preventing Impaired Driving
Before After Before After
Comparison States .08% Law States 0 5 10 15 20 25 30 21.9 5,197 23,686 23.3 4,900 21,049 22.6 6,178 27,287 20.2 4,779 23,672
( )
( )
( )
( )
Percentage of Fatal Crashes With a Fatally
Injured Driver With BAC > .08%
Figure 2 Proportion of fatal crashes with fatally injured drivers who had blood alcohol concentrations (BACs) of .08% or higher before and after the implementation of laws reducing the legal BAC for driving to .08%. Researchers compared States that had BAC limits of .10% (i.e., compari-son States) with States that passed laws making it illegal to drive with BACs greater than .08% (i.e., .08% law States). Over the period of the study, the proportion of fatal crashes with fatally injured drivers who had BACs of .08% or higher increased slightly in the comparison States but declined in the .08% law States, indicating that the .08% laws worked to reduce the occurrence of this type of fatal crash.
the study period, and three of the States implemented ALR laws within 1 year of the 0.08 law. This proximity restricted the study’s ability to separate the effect of the 0.08 laws from that of the ALR laws. ALR laws alone have been asso-ciated with a 5-percent decline in both alcohol- and non-alcohol-related fatal crashes and as much as a 9-percent decline in alcohol-related fatal crashes (Zador et al. 1989).
In another study, researchers paired six additional States that had adopted 0.08 laws in 1993 and 1994 (Kansas, North Carolina, Florida, New Hamp-shire, New Mexico, and Virginia) with six similar contiguous or nearby States that retained a 0.10-percent legal limit (Oklahoma, Tennessee, Maryland, Georgia, Colorado, and Connecticut) (Hingson et al. in press). As a group, the 0.08 States experi-enced a 16-percent reduction in the proportion of alcohol-related fatal crashes (i.e., crashes in which either a driver or pedestrian had a BAC of 0.10 percent or higher), which was significantly greater than the 11-percent decline identified in comparison States during the same time period. Similarly, the 0.08 States experienced a 20-percent decline in the propor-tion of drivers with BACs of 0.10 per-cent or higher who were involved in fatal crashes. This decline was signifi-cantly greater than the 14-percent decline in the comparison States. Declines experienced by comparison States were not significantly different from those experienced by other 0.10 States across the country during the same time period. Four of the 0.08 States (i.e., Kansas, North Carolina, Florida, and New Mexico) had ALR laws in place before the study period. Therefore, ALR laws in those States could not confound the study find-ings. Relative to the comparison states, the four 0.08 States with ALR laws experienced a significantly greater decline in the proportion of alcohol-related fatal crashes (17 versus 13 percent) and in the proportion of drivers involved in fatal crashes with
these States, although the effects were smaller than the effects seen in studies of States that adopted both 0.08 and ALR laws simultaneously or within a close timeframe (Hingson 1996; Rogers 1995).
In the most comprehensive study of its type to date, a national study conducted over a 16-year period iden-tified an 8-percent decline in the pro-portion of drivers with positive BACs involved in fatal crashes in States that had adopted 0.08 laws. This reduction was independent of the effects of other DWI laws, such as the 0.10-percent BAC limit and ALR laws. The study also controlled for the effects of safety belt laws and potentially confounding trends in demographic, economic, and
0.01 to 0.09 percent and drivers with BACs of 0.10 percent and higher (Voas and Tippets 1999). In addition, an 11-State study found that 0.08 legis-lation, either alone or in conjunction with ALR laws, was associated with declines in alcohol-related fatalities in seven States, and significant declines were associated specifically with 0.08 laws in five States (Apsler et al. 1999). It appears that 0.08 percent laws have effects independent of ALR laws but that their greatest impact is in combi-nation with ALR laws.
For legal BAC limits to most effec-tively deter alcohol-impaired driving, the public must be informed of them. A national survey of more than 4,000 drivers (NHTSA 1996) found that
0 10 20 30 40
Before After Before After
Comparison States Zero-Tolerance States 31.3 1,439 4,597 31.7 1,079 3,400 31.6 1,150 3,637 25.1 717 2,851
( )
( )
( )
( )
Teen Fatal Crashes Involving Single
Vehicles at Night (%)
Figure 3 Proportion of teen fatal crashes involving single vehicles at night before and after zero-tolerance laws for youth. Researchers compared States that had passed laws making it illegal for underage youth to drive with a measurable blood alcohol concentration (BAC) (i.e., zero-tolerance States) with States that had not passed such legislation (i.e., comparison States). Over the period of the study, the proportion of teen fatal crashes involving single vehicles at night increased slightly in the comparison States but declined in the tolerance States, indicating that the zero-tolerance laws worked to reduce the occurrence of this type of fatal crash. SOURCE: Hingson, Heeren, and Winter 1994.
only 54 percent of residents in States with 0.08 laws and only 38 percent of residents in States with 0.10 laws could correctly identify their State’s BAC limit. When the legal BAC limits for drivers are lowered, the need to educate the public about these changes is appar-ent. Research indicates that public educa-tion to promote awareness of a State’s new legal BAC limit can enhance the legislation’s effects (Blomberg 1992). Public education also is needed to increase drivers’ knowledge about the impairments associated with different levels of alcohol consumption. Among drivers surveyed, 75 percent thought that at least one-half of all drivers would be dangerous if they drove after consuming five drinks in 2 hours, but only 28 percent of the respondents thought all drivers would be unsafe under those conditions (NHTSA 1996).
Zero-Tolerance Laws for Drivers Under Age 21. Although all States prohibit people under age 21 from purchasing, possessing, or consuming alcohol, drinking remains prevalent among teenagers (Johnston et al. 1998). Zero-tolerance laws are designed to reduce drinking and driving among
young people by making it illegal for persons under 21 to drive after any drinking. These laws set the legal BAC limit for drivers under age 21 at 0.00 or 0.02 percent. In the fall of 1995, the U.S. Congress mandated that Federal highway funds be with-held from States that did not adopt zero-tolerance laws. At that time, only one-half of the States had such laws.
A recent study (Hingson et al. 1994) found that the first eight States to adopt zero-tolerance laws experienced a 20-percent greater decline in the proportion of nighttime single-vehicle fatal crashes among 15- to 20-year-old drivers compared with eight nearby States without zero-tolerance laws (see figure 3). Single-vehicle nighttime crashes are the type of fatal crash most likely to involve alcohol.
States that did not adopt zero-tolerance laws but lowered their BAC limits for drivers under age 21 to either 0.04 or 0.06 percent experienced declines of 6 to 7 percent relative to States with no BAC limit specific to drivers under age 21 (Hingson et al. 1994). Setting BAC limits for young drivers at 0.04 or 0.06 percent allows youth to speculate about how much
they can drink and still drive legally. Conversely, zero-tolerance laws send a clear message to young drivers that it is illegal to drive after engaging in any drinking. By the summer of 1998, all 50 States had passed zero-tolerance laws.
Unfortunately, some States have experienced difficulty in achieving broad public awareness of zero-tolerance laws. Studies in both California and Massachusetts found that 45 to 50 percent of young drivers were unaware of the law (Martin et al. 1996). Ob-viously, increasing awareness of the zero-tolerance law can enhance its effects. Blomberg (1992) found a one-third greater decline in alcohol-involved crashes among young drivers in Maryland counties where public service announcements about the State’s zero-tolerance law were aired compared with drivers in other counties.
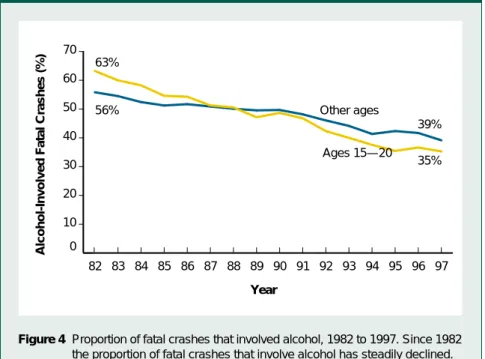
As a result of all States raising the minimum legal drinking age (MLDA) to 21 and adopting zero-tolerance laws for persons under age 21, the greatest reductions in alcohol-related traffic crashes in recent years have occurred among drivers under 21. Since NHTSA first began conducting national esti-mates of alcohol involvement in fatal crashes, alcohol-related fatalities among 15- to 20-year-olds have declined 59 percent, from 5,380 in 1982 to 2,209 in 1997. By comparison, alcohol-related fatalities among all other age groups declined 29 percent, from 19,785 to 13,980 (NHTSA 1998a) (see figure 4). The proportion of all fatal crashes among 15- to 20-year-olds that involved alcohol declined 44 percent compared with 30 percent for all other age groups from 1982 to 1997.
Lower Legal BAC Limits for Drivers Convicted of Driving While Intoxicated.
Similar to drivers under age 21, drivers with prior DWI convictions are dis-proportionately at risk for alcohol-related fatal crash involvement. One study found that drivers killed in alcohol-related crashes were eight times more likely to have had a DWI conviction in the previous 5 years than drivers randomly selected from the general population of licensed drivers (Brewer et al. 1994). 0 10 20 30 40 50 60 70 Other ages Ages 15—20 97 96 95 94 93 92 91 90 89 88 87 86 85 84 83 82 63% 56% 39% 35%
Alcohol-Involved Fatal Crashes (%)
Figure 4 Proportion of fatal crashes that involved alcohol, 1982 to 1997. Since 1982 the proportion of fatal crashes that involve alcohol has steadily declined. SOURCE: National Highway Traffic Safety Administration 1998a.
Year
1995 the law was modified to make it illegal for these drivers to drive after engaging in any drinking. The law allows first-time DWI offenders’ licenses to be reinstated after a mandatory sus-pension of 2 months on the condition that they not drive with a positive BAC for 1 year. Licenses of second-time offenders are reinstated on the condi-tion that the offenders not drive with a positive BAC for 10 years. Convicted DWI offenders who are apprehended with positive BACs receive a 1-year administrative license suspension or revocation and may receive court-imposed penalties.
One method for measuring the effectiveness of laws lowering BAC limits for DWI-convicted drivers is to determine any pre- to post-law changes in the extent to which DWI offenders are involved in fatal crashes. During the first 6 years after Maine adopted its 0.05-percent BAC limit for drivers with prior DWI convictions, the pro-portion of fatal crashes involving drivers with prior DWI convictions declined 25 percent, compared with the 6 years before the law took effect. The pro-portion of fatal crashes involving drivers with prior DWI convictions and BACs of 0.05 percent or higher declined 31 percent (Hingson et al. 1998).
Opponents of lowering the legal BAC limits for drivers have argued that these measures target “social drinkers” and have no effect on drivers with high BACs or prior DWI convictions. However, during the 6 years after Maine adopted its 0.05-percent law for drivers with prior DWI convictions, the proportion of fatal crashes involving drivers with prior DWI convictions and BACs of 0.15 percent or higher declined 35 percent. During those 6 years, com-pared with the previous 6 years, the rest of the United States experienced minimal change in the proportion of fatal crashes involving drivers with prior DWI convictions and positive BACs. In the rest of New England, the proportion of fatal crashes involving drivers with prior DWI convictions
State to adopt a zero-tolerance law for convicted DWI offenders. Maine was also the first State to adopt a zero-tolerance law for drivers under age 21 in 1983. Because of the benefits of that law, by the end of 1998, all States had adopted a zero-tolerance law for drivers under 21. Further research is needed to evaluate the effects of Maine’s sec-ond zero-tolerance law.
Sanctions for Drivers Convicted of DWI
Other measures to reduce recidivism among persons convicted of DWI include such sanctions as jail sentences, mandatory alcoholism treatment, and license plate or vehicle impoundment. In a meta-analysis of over 200 studies, Wells-Parker and colleagues (1995) reported that alcoholism treatment was associated with a 7- to 9-percent reduc-tion in alcohol-related crashes compared with standard sanctions (e.g., jail or fines). Sanctions combining punish-ment, education, and therapy with monitoring and aftercare were more effective for both first-time and repeat offenders than any single approach.
(Voas et al. 1997, 1998; Rodgers 1994), as does the use of ignition interlock devices that prevent vehicle operation when a driver’s breath alcohol exceeds a designated limit (Beck et al. in press).
Restricting Access to Alcohol
Another approach to reducing drinking and driving is to lower the accessibility of alcohol. Decreased accessibility can be accomplished by raising the price of alcohol through increased taxes, restricting both alcohol outlet density (i.e., the number of alcohol outlets in an area) and hours of operation, main-taining State control of alcohol sales, and implementing laws to restrict alcohol sales to inebriated persons or persons under age 21 (Kenkel and Manning 1996; Gruenewald et al. 1996; DeJong and Hingson 1998). Research shows that alcohol-related traffic fatalities can be reduced by increasing taxes on alcohol (Cook 1981; Saffer and Grossman 1987a; 1987b; Grossman et al. 1991) and enforcing laws that hold alcohol servers responsible for actions taken by under-age persons or intoxicated patrons
0 10 20 30 40 50 60 70 80 90 100
5+ drinks in one session in the past 2 weeks Used past year
97 96 95 94 93 92 91 90 89 88 87 86 85 84 83 82 81 80 88% 41% 75% 31%
High School Seniors (%)
Figure 5 Alcohol use by high school seniors. Since 1980 high school seniors’ use of alcohol has steadily declined.
SOURCE: Johnston et al. 1998.
who were sold alcohol (McKnight 1993; McKnight and Streff 1994; Wagenaar and Holder 1991b; Sloan et al. 1994). The operation of alcohol outlets by private owners rather than govern-ment agencies has been associated with increased alcohol consumption (Gruenewald et al. 1993; Gruenewald and Ponicki 1995; Wagenaar and Holder 1991a; Holder and Wagenaar 1990), and increased outlet density has been associated with increased alcohol-related traffic fatalities (Scribner et al. 1994).
Minimum Legal Drinking Age. Raising the MLDA to 21 was designed to re-duce impaired driving by restricting the accessibility of alcohol to everyone under age 21. This law tried to eliminate even moderate drinking by adolescent drivers. In 1984, when the Federal Government passed the National Minimum Drinking Age Act, 25 States had MLDAs of 21. By 1988 all 50 States had adopted MLDAs of 21. Survey results show a decline in drinking among young people follow-ing the increase in the MLDA. The proportion of high school seniors who reported drinking during the year
before being surveyed declined from 88 percent in 1980 to 75 percent in 1997. The proportion of high-school seniors who reported consuming five or more drinks on at least one occasion in the past 2 weeks declined from 41 to 31 percent (Johnston et al. 1998) (see figure 5). In addition to the decrease in drinking observed among persons under age 21 following the increase in the MLDA, research also suggests that raising the MLDA resulted in reduced drinking among 21- to 25-year-olds who grew up in States with a MLDA of 21 compared with those who grew up in other States (O’Malley and Wagenaar 1991).
Numerous studies have indicated that raising the MLDA to 21 reduces alcohol-related fatal crash involvement among drivers under age 21 (United States General Accounting Office 1987). Of the 29 studies completed since the early 1980s that evaluated increases in the MLDA, 20 studies showed significant decreases in traffic crashes and crash fatalities for persons under age 21. Only three studies found no change in traffic crashes involving youth. The remaining six studies had equivocal results (Toomey et al. 1996).
States adopting MLDAs of 21 in the early 1980s experienced a 10- to 15-percent decline in alcohol-related traffic deaths among young drivers compared with States that did not adopt such laws. NHTSA (1998b) has estimated that the raising of the MLDA to 21 has prevented more than 17,300 traf-fic deaths among persons under age 21 since 1975, approximately 700 to 1,000 deaths annually for the past decade (see figure 6). Research has not examined whether MLDA laws have also reduced alcohol-related crash involvement among 21- to 25-year-olds who grew up in States with a MLDA of 21 relative to those who grew up in other States.
Despite the declines in teenage drinking and fatal crashes associated with prohibiting the purchase and possession of alcohol by persons under age 21, underage youth throughout the United States still can obtain alcohol easily from many sources. Heightened enforcement of MLDA laws can reduce youth access to alco-hol, however. Preusser and colleagues (1994) reported that alcohol sales to underage youth declined dramatically following an enforcement campaign targeted at retail alcohol vendors. The campaign involved four “sting opera-tions” over 10 months in which under-age male police cadets attempted to purchase alcohol at liquor, grocery, and drug stores. Store owners received warnings if cadets were able to pur-chase alcohol on their first attempt. Stores that sold alcohol to the cadets during subsequent attempts were penalized accordingly. Over the 10-month period the cadets’ rate of suc-cessful purchase declined from 59 to 26 percent.
Conclusion
Although moderate drinking can impair driving performance, this level of alcohol consumption would not cause a person’s BAC to reach the legal limit for most drivers in the United States. In most States, the legal BAC limit for drivers age 21 and older is 0.10 percent. Based on this standard,
What Is Moderate Drinking?
0 5 10 15 20 97 96 95 94 93 92 91 90 89 88 75—87
Number of Lives (thousands)
Figure 6 Cumulative estimated number of lives saved by the minimum drinking age laws, 1975 to 1997. The minimum drinking age laws are credited with having saved increasing numbers of lives among the general U.S. popula-tion since 1975.
SOURCE: National Highway Traffic Safety Administration 1998b. Year
28 percent of the drivers surveyed reportedly believed that all drivers would be unsafe after consuming amounts of alcohol that would increase a person’s BAC to 0.08 percent. However, virtu-ally all drivers are seriously impaired at this BAC level. Drivers must become more informed about alcohol consump-tion’s effects on BAC levels and the various impairments a person experi-ences as a result of increasing BAC levels. Educational programs about alcohol consumption and impairment must be developed, implemented, and evaluated in an effort to reduce alcohol-related traffic crashes.
Research has demonstrated the effectiveness of lowering the legal BAC limit to 0.08 percent for drivers over age 21 and to 0.05 percent for drivers with prior DWI convictions, as well as implementing zero-toler-ance laws for drivers under age 21. Further research is needed to deter-mine whether Maine’s zero-tolerance law for drivers with prior DWI con-victions will further reduce their involvement in fatal crashes just as zero-tolerance laws did for drivers under age 21. The decline in alcohol-related fatal crashes associated with Maine’s 0.05 law for convicted DWI offenders suggests that it warrants consideration and study in other States as well. Increased knowledge of what constitutes moderate drinking and the amount of alcohol a person can reasonably consume before becoming impaired would help raise people’s sense of responsibility, both as drinkers and as drivers, ultimately saving thousands of lives. ■
Acknowledgment
This article is dedicated to Ashley Frazier, who on December 22, 1995, was struck and fatally injured at 8:20 a.m. by a driver with a BAC of approximately 0.08 percent while she was waiting for a school bus in front of her Westminster, Maryland, home.
American Medical Association 255(4):522– 527,
1986.
APSLER, R.; CHAR, A.R.; HARDING, W.; AND
KLEIN, T. The Effects of 0.08 BAC Laws.
Washington, DC: National Highway Traffic Safety Administration, 1999.
BECK, K.; ROUCH, W.; ANDBAKER, E. Effects of
the alcohol ignition interlock license restrictions on multiple alcohol offenders: A randomized trial in Maryland. Alcohol, Drugs and Traffic Safety, in press. BLOMBERG, R.D. Lower BAC Limits for Youth:
Evaluation of the Maryland .02 Law. DOT HS
806–807. Washington DC: U.S. Department of Transportation, 1992.
BREWER, R.D.; MORINS, P.D.; COLE, T.B.; WATKINS, S.; PATETTA, M.J.; ANDPOPKIN, C. The risk of dying in alcohol-related automobile crashes among habitual drunk drivers. New
England Journal of Medicine 331(8):513–517,
1994.
COOK, P. Effect of liquor taxes on drinking,
cirrhosis, and auto accidents. In: Moore, M.H., and Gerstein, D.R., eds. Alcohol and Public Policy. Washington, DC: National Academy Press, 1981. pp. 255–285.
DEJONG, W., ANDHINGSON, R. Strategies to
reduce driving under the influence. Annual
Review of Public Health 19:359–378, 1998.
FINNEGAN, F., ANDHAMMERSLEY, R. The effects of alcohol on performance. In: Smith, A.P., and Jones, D.M., eds. Handbook of Human
Perform-ance: Volume 2. Health and Performance. London:
Academic Press, 1992. pp. 73–126.
GROSSMAN, M.; SAFFER, H.; ANDCHALOUPKA, F.
Alcohol Regulation and Motor Vehicle Mortality: Final Report for Grant 5 RO1 AA07593. Bethesda,
MD: National Institute on Alcohol Abuse and Alcoholism, 1991.
GRUENEWALD, P.J., ANDPONICKI, W.R. The relationship of the retail availability of alcohol and alcohol sales to alcohol-related traffic crashes.
Accident Analysis and Prevention 27(2):249–259,
1995.
GRUENEWALD, P.J.; MILLAR, A.B.; ANDTRENO, A.J. Alcohol availability and the ecology of drinking behavior. Alcohol Health & Research
World 17(1):39–45, 1993.
GRUENEWALD, P.J.; MILLAR, A.B.; ANDROEPER, P. Access to alcohol: Geography and prevention for local communities. Alcohol Health & Research
World 20(4):244–251, 1996.
HINDMARCH, I; BHATTI, J.Z.; STARMER, G.A; MASCORD, D.J.; KERR, J.S.; ANDSHERWOOD, N. The effects of alcohol on the cognitive function of males and females and on skills relating to car driving. Human Psychopharmacology: Clinical and
Experimental 7(2):105–114, 1992.
HINGSON, R.; ANDHOWLAND, J. Promoting safety in adolescents. In: Millstein, S.; Peterson, A.; and Nightengale, E. Promoting the Health of
Adolescents: New Directions for the 21stCentury.
New York, NY: Oxford Press, 1993. pp. 305–327.
HINGSON, R.; HEEREN, T.; ANDWINTER, M. Lower legal blood alcohol limits for young drivers. Public Health Reports 109(6):738–744, 1994.
HINGSON, R.; HEEREN, T.; ANDWINTER, M. Lowering state legal blood alcohol limits to 0.08 percent: The effect on fatal motor vehicle crashes.
American Journal of Public Health
86(9):1297–1299, 1996.
HINGSON, R.; HEEREN, T.; ANDWINTER, M.
Effects of Maine’s 0.05 percent legal blood alcohol level for drivers with DWI convictions.
Public Health Reports 113(5):440–446, 1998.
HINGSON, R.; HEEREN, T.; ANDWINTER, M.
Legislative strategies to reduce alcohol impaired driving. In: Fell, J., ed. Risk Taking and Traffic
Safety. Washington, DC: National Highway
Traffic Safety Administration, in press. HOLDER, H.D., ANDWAGENAAR, A.C. Effects of the elimination of a state monopoly on distilled spirits’ retail sales: A time-series analysis of Iowa.
British Journal of Addiction 85(12):1615–1625,
1990.
HOWAT, P.; SLEET, D.; ANDSMITH, I. Alcohol
and driving: Is the 0.05 percent blood alcohol concentration limit justified? Drug and Alcohol
Review 10(2):151–166, 1991.
JOHNSON, D., ANDFELL, J. The Impact of
Lowering the Illegal BAC Limit to 0.08 in Five States in the U.S. The 39 Annual Proceedings, Oct 16–18, 1995, Chicago, IL. Des Plains, IL:
Associa-tion for the Advancement of Automotive Medicine, 1995. pp. 1–20.
JOHNSTON, L.D.; O’MALLEY, P.M.; ANDBACH
-MAN, J.G. National Survey Results on Drug Use
from the Monitoring the Future Study, 1975-1997: Volume I. Secondary School Students. NIH
Publication No. 98–4345. Rockville, MD: National Institute on Drug Abuse, 1998. KENKEL, D., ANDMANNING, W. Perspectives on alcohol taxation. Alcohol Health & Research World 20(4):230–238, 1996.
MARTIN, S.; GRUBE, J.; VOAS, R.; BAKER, J.; AND
HINGSON, R. Zero tolerance laws: Effective public policy? Alcoholism: Clinical and
Experimental Research 20(8):147A–150A, 1996.
MOSKOWITZ, H.; BURNS, M.M.; ANDWILLIAMS,
A.F. Skills performance at low blood alcohol levels.
Journal of Studies on Alcohol 46(6):482–485, 1985.
National Highway Traffic Safety Administration.
The Effects Following Implementation of an 0.08 BAC Limit and Administrative Per Se Law in
What Is Moderate Drinking?
California. DOT HS No. 807– 771. Washington,
DC: National Highway Traffic Safety Adminis-tration, 1991.
National Highway Traffic Safety Administration.
National Survey on Drinking and Driving Attitudes and Behavior 1995. DOT HS No.
808–438, Washington, DC: Department of Transportation, 1996.
National Highway Traffic Safety Administration.
Setting Limits, Saving Lives: The Case for 0.08 BAC Laws. DOT HS No. 808–524, 1997.
National Highway Traffic Safety Administration.
Traffic Safety Facts 1997: A Compilation of Motor Vehicle Crash Data from the Fatality Analysis Reporting System and the General Estimates System.
DOT HS No. 808–806. Washington, DC: Department of Transportation, 1998a. National Highway Traffic Safety Administration.
Traffic Safety Facts 1997: Alcohol. National
Center for Statistics and Analysis. Washington, DC: Department of Transportation, 1998b. National Institute on Alcohol Abuse and Alcoholism. The Physicians’ Guide to Helping
Patients With Alcohol Problems. Bethesda, MD:
the Institute, 1995.
National Institute on Alcohol Abuse and Alcoholism. Alcohol Alert No. 35: “Alcohol Metabolism.” Bethesda, MD: the Institute, 1997. MCKNIGHT, A.J. Server intervention: Accom-plishments and needs. Alcohol Health & Research
World 17(1):76–83, 1993.
MCKNIGHT, A.J., ANDSTREFF, F.M. Effect of enforcement upon service of alcohol to intoxi-cated patrons of bars and restaurants. Accident
Analysis and Prevention 26(1):79–88, 1994.
O’MALLEY, P.M., ANDWAGENAAR, A.C. Effects of minimum drinking age laws on alcohol use, related behaviors, and traffic crash involvement among American youth: 1976–1987. Journal of
Studies on Alcohol 52(5):478–491, 1991.
PREUSSER, D.F.; WILLIAMS, A.F.; ANDWEINSTEIN, H.B. Policing underage alcohol sales. Journal of
Safety Research 25(3):127–133, 1994.
RODGERS, A. Effect of Minnesota’s license plate impoundment law on recidivism of multiple DWI violators. Alcohol Drugs and Driving 10(2):127–134, 1994.
ROGERS, P.N. The General Deterrent Impact of
California’s 0.089 Blood Alcohol Concentration Limit and Administrative Per se License Suspension Laws. Sacramento, CA: California Department of
Motor Vehicles, 1995.
ROSS, H.L. Law, science, and accidents: The
British Road Safety Act of 1967. Journal of Legal
Studies 2(1):1–79,1973.
ROSS, H.L. Confronting Drunk Driving: Social
Policy for Saving Lives. New Haven, CT: Yale
University Press, 1982.
SAFFER, H., ANDGROSSMAN, M. Beer taxes, the
legal drinking age, and youth motor vehicle fatali-ties. Journal of Legal Studies 16(2):351–374, 1987a.
SAFFER, H., ANDGROSSMAN, M. Drinking age laws and highway mortality rates: Cause and effect. Economic Inquiry 25(July):403–417, 1987b.
SCRIBNER, R.A.; MACKINNON, D.P.; AND
DWYER, J.H. Alcohol outlet density and motor
vehicle crashes in Los Angeles County cities.
Journal of Studies on Alcohol 55(4):447–453, 1994.
SLOAN, F.A.; REILLY, B.; ANDSCHENZLER, C.
Effects of prices, civil and criminal sanctions, and law enforcement on alcohol-related mortality.
Journal of Studies on Alcohol 55(4):454–465, 1994.
STARMER, G.A. Effects of low to moderate doses of ethanol on human driving-related perfor-mance. In: Crow, K.E., and Batt, R.D., eds.
Human Metabolism of Alcohol: Vol. I. Pharmaco-kinetics, Medicolegal Aspects, and General Interests.
Boca Raton, FL: CRC Press, 1989. pp. 101–130.
TOOMEY, T.; ROSENFELD, L.; ANDWAGENAAR, A. The minimum legal drinking age: History, effec-tiveness, and on-going debate. Alcohol Health &
Research World 20(4):213–218, 1996.
United States General Accounting Office. Drinking
Age Laws: An Evaluation Synthesis of their Impact on Highway Safety. GAO/PEMD No. 87–100.
Washington, DC: United States General Accounting Office, 1987.
VOAS, R., ANDTIPPETS, A. The Relationship of
Alcohol Safety Laws to Drinking Drivers in Fatal Crashes. Washington, DC: National Highway
Traffic Safety Administration, 1999.
VOAS, R.B.; TIPPETS, A.S.; ANDTAYLOR, E.
Temporary vehicle immobilization: Evaluation of a program in Ohio. Accident Analysis and
Prevention 29(5):635–642, 1997.
VOAS, R.B.; TIPPETS, A.S.; ANDTAYLOR, E.
Temporary vehicle impoundment in Ohio: A replication and confirmation. Accident Analysis
and Prevention 30(5):651–655, 1998.
WAGENAAR, A.C., ANDHOLDER, H.D. Change
from public to private sale of wine: Results from natural experiments in Iowa and West Virginia.
Journal of Studies on Alcohol 52(2):162–173,
1991a.
WAGENAAR, A.C., ANDHOLDER, H.D. Effects of alcoholic beverage server liability on traffic crash injuries. Alcoholism: Clinical and Experimental
Research 15(6):942–947, 1991b.
WELLS-PARKER, E.; BANGERT-DOWNS, R.; MCMILLEN, R.; ANDWILLIAMS, M. Final results from a meta-analysis of remedial interventions with drink/drive offenders. Addiction 90(7):907– 926, 1995.
ZADOR, P.L. Alcohol related relative risk of fatal
driver injuries in relation to driver age and sex.
Journal of Studies on Alcohol 52(4):302–310,
1991.
ZADOR, P.L.; LUND, A.K.; FIELDSM.; AND
WEINBERG, K. Fatal crash involvement and laws