Utah State University Utah State University
DigitalCommons@USU
DigitalCommons@USU
All Graduate Theses and Dissertations Graduate Studies
12-2011
Seasonal Influenza Vaccination Disparities Between U.S.
Seasonal Influenza Vaccination Disparities Between U.S.
Non-Hispanic Whites and Non-Hispanics, 2000-2009
Hispanic Whites and Hispanics, 2000-2009
Andrew E. BurgerUtah State University
Follow this and additional works at: https://digitalcommons.usu.edu/etd
Part of the Sociology Commons Recommended Citation
Recommended Citation
Burger, Andrew E., "Seasonal Influenza Vaccination Disparities Between U.S. Non-Hispanic Whites and Hispanics, 2000-2009" (2011). All Graduate Theses and Dissertations. 1081.
https://digitalcommons.usu.edu/etd/1081
This Thesis is brought to you for free and open access by the Graduate Studies at DigitalCommons@USU. It has been accepted for inclusion in All Graduate Theses and Dissertations by an authorized administrator of DigitalCommons@USU. For more information, please contact digitalcommons@usu.edu.
SEASONAL INFLUENZA VACCINATION DISPARITIES BETWEEN U.S. NON-HISPANIC WHITES AND HISPANICS, 2000-2009
by
Andrew E. Burger
A thesis submitted in partial fulfillment of the requirements for the degree
of MASTER OF SCIENCE in Sociology Approved: _______________________ _______________________
Dr. Eric Reither Dr. Michael B. Toney
Major Professor Committee Member
______________________ ______________________
Dr. E. Helen Berry Dr. H. Reed Geertsen
Committee Member Committee Member
______________________ Mark R. McLellan
Vice President for Research and Dean of the School of Graduate Studies
UTAH STATE UNIVERSITY Logan Utah
Copyright © Andrew Edward Burger All Rights Reserved
ABSTRACT
Seasonal Influenza Vaccination Disparities Between U.S. Non-Hispanic Whites and Hispanics, 2000-2009
by
Andrew E. Burger, Master of Science Utah State University 2011
Major Professor: Dr. Eric Reither Department: Sociology
Seasonal influenza produces substantial disease within the United States every year. Despite the availability of safe and effective vaccines for influenza, millions of individuals go unvaccinated each flu season, with notable differences across racial/ethnic groups. Using the Behavioral Risk Factor Surveillance System (BRFSS), I examine vaccination rates among non-Hispanic whites and Hispanics during the 2000-2009
influenza seasons. After developing a new method that addresses shortcomings of BRFSS vaccination measures, I find that non-Hispanic whites exhibit higher vaccination rates than Hispanics. Through a series of logistic regression models I show that the disparities between non-Hispanic whites and Hispanics narrow after controlling for healthcare coverage and socioeconomic characteristics. This suggests that seasonal influenza vaccination may be improved among U.S. Hispanics by addressing structural barriers in receiving the vaccine, especially access to health care.
PUBLIC ABSTRACT
Seasonal Influenza Vaccination Disparities Between U.S. Non-Hispanic Whites and Hispanics, 2000-2009
by
Andrew E. Burger, Master of Science Utah State University 2011
The seasonal flu is a deadly disease which infects millions of individuals within the United States annually. One of the leading causes of death in the United States, the seasonal flu claims more lives than liver disease, homicide, or HIV. While most
individuals will not develop life-threatening symptoms due to the seasonal flu, millions of individuals become sick every year. Not only does this produce hundreds of thousands of hospitalizations annually, but also creates a drain on the economy as individuals are not able to attend their daily activities. This burden remains despite the presence of safe and effective seasonal influenza vaccines. Backed by numerous studies, the seasonal flu vaccine has been found to be the most effective means of preventing infection. The Centers for Disease Control and Prevention (CDC) recommends that everyone 6 months of age and older become vaccinated.
However, despite the effectiveness of the seasonal flu vaccine, the disease burden associated with the seasonal flu remains. Part of the reasons for the continuing costs of the seasonal flu is due to the consistent racial and ethnic gaps in the receipt of the
seasonal flu vaccine. Previous studies have found that racial and ethnic minorities receive the influenza vaccine at lower rates than non-Hispanic whites. Since most of these studies look at vaccinations during a particular flu season, little is known about the overall trends in vaccination among the population.
This thesis looks specifically at trends in vaccination uptake among non-white Hispanics and Hispanics in the United States during the 2000-2009 flu seasons. Using data from the Behavioral Risk Factor Surveillance System (BRFSS), I present a new method of
organizing respondents to more accurately track vaccination during a specific flu season. I then examine differences in non-Hispanic whites and Hispanics in their influenza vaccination behavior.
During this time period I find that while both groups experienced upward trends in vaccination uptake, non-Hispanic whites are doing so at a quicker pace than Hispanics leading to an increasing gap between the two groups. I find that Hispanics experience lower odds of receiving a vaccine than non-Hispanic whites. But when controlling for socioeconomic factors, odds of reporting a flu vaccine increase substantially. Having some form of healthcare coverage was found to be a powerful predictor increasing the odds of receiving a flu vaccine. This suggests that by increasing healthcare coverage among the U.S. Hispanic population, gains in influenza vaccination could occur.
ACKNOWLEDGMENTS
I would like to first thank my committee members, Drs. Eric Reither, Michael B. Toney, E. Helen Berry, and H. Reed Geertsen, for all of their insightful comments and recommendations for my thesis. With their help, I feel that I have produced a finished product far better than what would have been possible on my own. I am especially thankful for the assistance of Dr. Eric Reither who has devoted so much time and energy in helping me succeed.
I am grateful for my fellow graduate students who have offered their insights and encouragement in finishing this project. Also, I would like to thank “G” Allred and Dorrie Barnes for all of their assistance (which goes far and beyond making sure I had enough pens, paper, and printer toner!).
I would also like to thank my parents, especially my father, for all of their
assistance in making this endeavor possible and never doubting my capabilities. Finally, I would like to thank my beautiful wife, Nicole, who was not only a source of loving encouragement during this time, but also my full-time editor. Other than myself, I doubt anyone has read my thesis more than her. I would also like to thank my two little
daughters, Emma and Abby, for always smiling at their dad and making him smile in return. Sorry girls, but you will always get your flu shots.
CONTENTS
Page
ABSTRACT ... iii
PUBLIC ABSTRACT. ... iv
ACKNOWLEDGMENTS ... v
LIST OF TABLES ... viii
LIST OF FIGURES ... ix
CHAPTER I. INTRODUCTION ... 1
Racial and Ethnic Disparities in Influenza... 3
The Hispanic Paradox ... 4
Outline of Thesis ... 6
II. DISEASE BURDEN OF SEASONAL INFLUENZA ... 8
Mortality Burden of Seasonal Influenza ... 8
Morbidity Burden of Seasonal Influenza ... 9
Economic Burden of Seasonal Influenza ... 10
Effectiveness of Influenza Vaccination ... 11
Disparities in Receipt of Seasonal Influenza Vaccination ... 12
Influenza Vaccination among U.S. Hispanics ... 14
III. THEORY ... 16
Flexible Resources ... 19
Fundamental Causes of Disease... 20
IV. METHODS AND ANALYSES ... 23
The Behavioral Risk Factor Surveillance System (BRFSS) ... 25
Filtering Respondents by Month of Interview ... 26
Previous Methods ... 28
Comparison using the National Health Interview Survey (NHIS) . 33 Measures ... 37
V. RESULTS ... 42
Seasonal Trends in Influenza Vaccination ... 42
Odds of Reporting Influenza Vaccination: Males ... 51
Odds of Reporting Influenza Vaccination: Females ... 54
VI. DISCUSSION ... 57 Limitations ... 59 VII. CONCLUSION ... 62 Policy Implications ... 64 REFERENCES ... 66
LIST OF TABLES
Table Page
1 Comparison of Methods of Estimating Seasonal Influenza Vaccination Within the 2009Behavioral Risk Factor Surveillance System
(BRFSS) ... 32 2 Comparison of Methods of Estimating Seasonal Influenza Vaccination
Within the 2009Behavioral Risk Factor Surveillance System
(BRFSS) ... 32 3 Reported Seasonal Influenza Vaccination by Flu Season,
2005 National Health Interview Survey (NHIS) ... 34 4 Reported Seasonal Influenza Vaccination by Flu Season,
2006 National Health Interview Survey (NHIS) ... 35 5 Reported Seasonal Influenza Vaccination by Flu Season,
2007 National Health Interview Survey (NHIS) ... 34 6 Reported Seasonal Influenza Vaccination by Flu Season,
2008 National Health Interview Survey (NHIS) ... 35 7 Reported Seasonal Influenza Vaccination by Flu Season,
2009 National Health Interview Survey (NHIS) ... 35 8 Reported Seasonal Influenza Vaccination by Flu Season,
2010 National Health Interview Survey (NHIS) ... 36 9 Influenza Vaccination Coverage for Whites Age ≥18
10 Influenza Vaccination Coverage for Whites Age ≥18
in the United States, 2000-2009 Flu Seasons ... 48 11 Logistic Regression Estimates of the Effect of White and Hispanic
Race/Ethnicity and Sociodemographic Factors on Reported Influenza
Vaccinations for US Males Age ≥ 18, 2000-2009 Flu Seasons ... 51 12 Logistic Regression Estimates of the Effect of White and Hispanic
Race/Ethnicity and Sociodemographic Factors on Reported Influenza
LIST OF FIGURES
Figure Page
1 Causal Diagram Outlining Relationship Between
Socioeconomic Status and Health Outcomes ... 18 2 Estimated Trends in Influenza Vaccination Rates for
White and Hispanic Males Age ≥18 in the United States,
2000-2009 Influenza Seasons ... 41 3 Estimated Trends in Influenza Vaccination Rates for
White and Hispanic Females Age ≥18 in the United States,
CHAPTER I INTRODUCTION
First recorded in 1504, the term influenza is most likely derived from the Italian word meaning ―influence‖ (Quinn 2008). It was believed by the Italians at the time that influenza, or more commonly known as the ―flu,‖ was brought about by the ―malevolent position of the stars at certain times‖ (40). The influenza virus has likely affected humans for our entire known history. As early as the 4th century BC, the famous Greek physician Hippocrates gave an account of perhaps the first recorded influenza epidemic.
Hippocrates (whose oath of medical ethics still impacts physicians today) described a condition where many, especially children, experienced convulsions, fevers, coughs, and great pain (42).
The seasonal flu is dangerous not only in its ability to produce significant
mortality and morbidity burdens within local populations, but also by its ability to mutate into novel (or new) strains of influenza, capable of spreading across the globe. It is generally agreed that the first influenza pandemic occurred in 1580 where, in a period of 6 months, an influenza strain spread through the ―whole of Europe,‖ with infection eventually spreading to the Americas (Potter 2001:574). While seasonal influenza epidemics continued, the next pandemic wave would not occur for almost another 80 years (Quinn 2008). The 1658 pandemic was of such serious proportions that it would be reported by ―many writers and commentators, [and] not just physicians‖ (Quinn
2008:52). Dr. Willis, one such commentator of the time, wrote his account of the 1658 pandemic, describing patients who were ―troubled with burning thirst, waking,
hoarseness, and coughing, almost continual‖ (52–53). Dr. Willis notes that while most of the younger men recovered, among those advanced in age ―not a few died of it‖ (53).
As human mobility increased throughout the world and international trade
stretched across the globe, so did the ability of influenza to spread and infect populations. The influenza pandemic of 1781 is considered by historians to be ―among the greatest manifestations of the disease in all history‖ (Quinn 2008:71). The first outbreak was believed to have begun in China, then spreading through Russia, continued to encompass Europe in the space of 8 months (Potter 2001). It is estimated that at the peak of this pandemic ―30,000 fell ill each day in St. Petersburg [and] two-thirds of the population of Rome became ill‖ (575). It should be noted that even without modern advances in transportation, influenza was able to spread quickly throughout most of the world.
The next serious outbreak of influenza occurred in 1830. Following the same path as the 1781 pandemic, the 1830 pandemic began in China and then spreading through Russia to Europe eventually spread through the Americas (Patterson 1986). Although quantitative data were rare during the pandemic of 1830, contemporary ―observers
consistently reported high morbidity and low case-mortality‖ (Patterson 1986:35). During the 1830 pandemic, medical treatment still relied on archaic medical practices such as bloodletting (Quinn 2008).
While these 18th and 19th century pandemics were devastating and killed millions, they pale in comparison to the damage inflicted by the most severe influenza pandemic recorded to date, the 1918 influenza pandemic commonly known as the ―Spanish Flu.‖ Health records were considerably more accurate during the 1918 pandemic than in past outbreaks, but much remains unknown as to its full effect on mortality. Considered an
example of the possible ―upper bound on the number of deaths caused by [a] future pandemic‖, the 1918 influenza was devastating (Murray et al. 2007). Johnson and Mueller (2002) comment that while ―it would seem unlikely that a truly accurate figure can ever be calculated,‖ the total mortality caused by this pandemic ―may fall in the range of 50 to 100 million‖ (115).
Fortunately, since 1918 the world has not experienced another influenza pandemic of similar magnitude. However, every year in the United States seasonal influenza epidemics cause thousands of deaths, even more hospitalizations, and drain billions of dollars from the economy. Fortunately, medical advances have produced effective treatments to counter the symptoms of seasonal influenza, as well as the means to prevent it altogether through vaccinations. However, because many do not receive seasonal vaccinations, a substantial disease burden attributable to the flu is experienced within the United States every year.
Racial and Ethnic Disparities in Influenza Vaccination
Consistently, racial and ethnic disparities in receipt of the seasonal influenza vaccine have been observed especially among Hispanics (Lu et al. 2008). Reduction in these disparities could provide substantial health benefits not only to racial and ethnic minorities, but to the entire population. This thesis will focus on influenza vaccination disparities between non-Hispanic whites and Hispanics in the United States. Given that Hispanics are now the largest and fastest growing ethnic minority group in the United States (Pew Hispanic Center 2011a), understanding public health challenges in this population is of great importance. However, much attention has been given to the
―Hispanic paradox‖ where Hispanics, even with their average lower socioeconomic status, experience a mortality advantage over other similarly disadvantaged racial/ethnic minority groups (Markides and Coreil 1986).
The Hispanic Paradox
First documented in 1986, the Hispanic Paradox proposed that Hispanics experienced similar health outcomes to non-Hispanic whites despite their lower socioeconomic status (Markides and Coreil 1986). This discovery was viewed as a ―paradox‖ since lower socioeconomic status has traditionally been viewed as a predictor of poorer health, as is often observed among disadvantaged African Americans. Despite research questioning the existence of a ―Hispanic paradox‖ (Smith and Bradshaw 2006), evidence does suggest that a mortality advantage exists at least for some Hispanic groups (Markides and Eschbach 2005). Questioning biological explanations for a mortality advantage among Hispanics, Palloni and Arias (2004) present evidence that the ―Hispanic paradox‖ was not really attributable to all Hispanics, but may rather be a characteristic found only among foreign-born individuals from Mexico. Explaining the paradox among foreign-born Mexican nationals in the United States, Palloni and Arias (2004) emphasize a ―salmon-bias‖ effect where return migration of ill foreign-born Mexicans artificially deflates Hispanic mortality. If the Hispanic mortality advantage is explained through such factors as the return migration of its sick members or the selective emigration of healthy individuals, then future health concerns arise given the shift from migration to natural birth as the main driver in Hispanic population growth (Suro and Passel 2003).
A recent report from the Pew Hispanic Center (2011b) notes 58 percent of the growth experienced by U.S. Hispanics came from natural births rather than immigration. It is likely that this proportion will increase with studies showing rates of migration into the United States slowing from countries such as Mexico (Passel and Cohen 2010). This shift in growth from immigration to natural increase should be noted by public health officials given that ―U.S-born Hispanics tend to be less healthy than Hispanic
immigrants‖ (Livingston, Minushkin, and Cohen 2008:10). Even if a mortality advantage does exist among Hispanics, Markides and Eschabach (2005:74) note that
[…] it would be unfortunate if public health policy overlooked the presence of clear and remediable disparities in health care access and the burden of infectious diseases, diabetes, and disability that clearly do disadvantage Hispanics, even should it prove that some compensating factors create offsetting advantages in other morbidity and mortality processes.
With the growth among U.S. Hispanics changing from immigration to natural increase, the observed ―Hispanic paradox‖ may disappear as a greater number of Hispanics are U.S. born, revealing poorer health among this population. Furthermore, supporting evidence of health disadvantages among Hispanics was found during the 2009 H1N1 influenza pandemic; the CDC noted that even though Hispanics represent 15 percent of the U.S. population, nearly 30 percent of A(H1N1) cases during the early spring wave were among Hispanics (CDC 2010g). Further evidence of a possible Hispanic health disadvantage during the 2009 A(H1N1) pandemic is found in a study which, following a group of infected individuals admitted into an intensive care unit (ICU) in Utah for A(H1N1), found that Hispanics were disproportionally affected by the disease suggesting perhaps a ―genetic predisposition for a more severe manifestation of A(H1N1) infection‖ (Miller et al. 2010:756). These disturbing trends suggests that
Hispanics may actually experience higher risks of infection for certain strains of
influenza. Whether those risks are attributable to biological or sociodemographic factors has yet to be fully determined. Essentially, ―the need to address observed health
disparities concerning Hispanics does not turn on how the Hispanic paradox is finally explained‖ (Markides and Eschabach 2005:74). Given the relative ease with which influenza vaccinations can be produced and administered, it is one such ―clear and remediable‖ health disparity that should be addressed.
Outline of Thesis
To evaluate seasonal influenza vaccination disparities between non-Hispanic whites and Hispanics, it is important to monitor trends in vaccination rates. While previous research has identified disparities within particular flu seasons (Jones et al. 2004; Link et al. 2006), few studies have tracked disparities across multiple influenza seasons (see Lu et al. 2008). In order to emphasize the need for tracking influenza vaccination coverage and the potential health gains vaccination could have on society, a review of the mortality, morbidity, and economic burden of seasonal influenza will be presented in Chapter II. Following, a brief review of the literature detailing the
effectiveness of the seasonal influenza vaccine in preventing disease will be given. To help explain the mechanisms behind racial and ethnic disparities in seasonal influenza vaccinations, this study utilizes the Fundamental Cause Theory (FCT), which proposes a central relationship between socioeconomic status (SES) and health outcomes, as
outlined in Chapter III. A detailed description of the method used to estimate seasonal vaccination rates with the Behavioral Risk Factor Surveillance System (BRFSS) will be
given in Chapter IV with a subsequent comparison utilizing the National Health Interview Study (NHIS). This method, which utilizes the respondent‘s month of interview to more accurately calculate seasonal vaccination, will be compared with previously employed methods. Using this method, seasonal vaccination rates among non-Hispanic whites and non-Hispanics will be estimated. This and other descriptive results will be presented in Chapter V. To test the propositions set forth by FCT, a series of logistic regression analyses will be performed to control for SES and its influence on the odds of reporting receipt of a seasonal influenza vaccination between non-Hispanic whites and Hispanics. Chapter VI presents the results of these analyses, along with my interpretation. Additionally, the academic and policy implications of this research are discussed.
CHAPTER II
DISEASE BURDEN OF SEASONAL INFLUENZA
Given the potential for seasonal influenza to infect large portions of society every year, its burden is often substantial in terms of mortality, morbidity and related economic costs. Influenza is a leading cause of death in the United States with an estimated 263,887 cumulative deaths occurring during the 1999 through 2006 influenza seasons (CDC 2010a). This mortality estimate places influenza above deaths caused by liver disease (245,869), hypertension (192,290), homicide (161,747), and HIV (120,222) during the same time period (CDC 2011b). A brief description of the mortality, morbidity, and economic burden of seasonal influenza is provided to emphasize the destructive nature of this common virus, and to stress the need for more effective seasonal vaccination
programs of the population.
Mortality Burden of Seasonal Influenza
In a recent publication on mortality trends due to seasonal influenza from 1976 to 2007, the Centers for Disease Control and Prevention (CDC) estimates that, on average, seasonal influenza is responsible for 23,607 deaths each flu season (CDC 2010a). However, this average masks variability in the virulence of seasonal influenza and the dramatic variation in mortality that can occur based on virus type (CDC 2010a). Consistently, in flu seasons where the influenza A(H3N2) virus is present, mortality is 2.7 times higher than when that particular virus type is absent (CDC 2010a). It is not surprising, then, to learn that the 2003 influenza season (in which A(H3N2) virus was present) is estimated to have the highest impact on mortality in the 30 year period of
observation, with an estimated 48,614 deaths attributable to the A(H3N2) influenza virus (CDC 2010a). In contrast, the 1986 influenza season was estimated to have the lowest number of influenza related deaths with 3,349 (CDC 2010a). Molinari et al. (2007), in examining mortality from 2001 through 2003 (years dominated by the more virulent type A(H3N2) virus), estimate that 610,660 life-years are lost per annum in the United States due to seasonal influenza.
Morbidity Burden of Seasonal Influenza
Given the substantial mortality burden associated with seasonal influenza, it is not surprising that the morbidity burden is also large. However, unlike mortality associated with seasonal influenza, which is measured by number of deaths, the morbidity burden is more difficult to calculate. A useful gauge to help understand the severity of seasonal influenza in producing morbidity is to approximate the number of hospitalizations attributed to seasonal influenza. While not providing an approximation for the total number of illnesses caused by influenza, calculating the number of hospitalizations attributable to seasonal influenza does provide an insight to its virulence. In Thompson et al. (2004), the annual number of hospitalizations caused by seasonal influenza is
estimated for the 1979 through 2000 flu seasons. During the time period, it was projected that on average 226,000 individuals were hospitalized per flu season (Thompson et al. 2004). However, just as is the case with mortality estimates, this average masks
variability that can exist in the virulence of influenza. For example, during the 1997 flu season (in which an influenza type A(H3N2) virus was dominant) approximately 430,960 hospitalizations were attributed to influenza-related illnesses, while the 1990 flu season
experienced an estimated 157,911 hospitalizations due to seasonal influenza (Thompson et al. 2004). Also, seasonal influenza can aggravate chronic health conditions, such as cardiovascular disease, producing further hospitalizations (Madjid et al. 2007).
Hospitalizations caused by influenza may be a useful way to gauge morbidity burden, but they certainly underrepresent the full effect of seasonal influenza on the health of a population. The vast majority of individuals infected by seasonal influenza will not develop life threatening complications requiring hospitalization, but rather mild symptoms including fever, coughing/sore throat, runny nose, and body aches (U.S. Department of Health 2011). While these symptoms may be minor and the effect on the individual temporary, the sheer number of people infected by seasonal influenza can create disruptions throughout society. Given the large mortality and morbidity burden associated with seasonal influenza, the economic burden of influenza is also substantial.
Economic Burden of Seasonal Influenza
Molinari et al. (2007) calculate that, on average, seasonal influenza is responsible for an annual economic burden of nearly $87.1 billion (in 2003 dollars). Of this estimated economic burden, nearly 88 percent is attributable to indirect costs of illness (e.g., lost wages due to illness or death), while the remaining 12 percent is associated with medical treatments for seasonal influenza. Furthermore, an estimated 44 million days of work are lost each year because of influenza-related illnesses (Molinari et al. 2007). This seasonal absenteeism can have substantial effects in terms of cost for employers and employees resulting in an overall drain on the economy (Akazawa, Sindelar, and Paltiel 2003).
It is interesting to note that the average economic burden of one year of seasonal influenza (when adjusted for inflation to 2011 dollars), as presented in Molinari et al. (2007), is greater than the total economic damage caused by major natural disasters (including floods, hurricanes, fires, droughts, tornados and tropical storms) from 2006 through 2009 (National Climatic Data Center 2011). However, unlike hurricanes, the large mortality, morbidity, and economic burdens of seasonal influenza can easily be reduced through an effective vaccine.
Effectiveness of Influenza Vaccination
In the 2010 flu season, the CDC began recommending that everyone over 6 months of age should receive a seasonal influenza vaccine (CDC 2010a). This change reflects a shift in policy emphasizing the need for universal influenza vaccination coverage. The modification in policy is based in research showing the health benefits individuals, and the population as a whole, can achieve through vaccination (CDC 2010e). The CDC recommends that receiving a seasonal influenza vaccine should be the first step in preventing the flu (CDC 2010d). In fact, substantial efforts have been taken by the United States government to promote general knowledge regarding seasonal influenza and the benefits of vaccination. For instance, the internet website, www.flu.gov, provides information regarding the seasonal flu and where individuals can obtain an influenza vaccination.
The recommendation comes from strong evidence showing the effectiveness of the influenza vaccine in preventing illness (Bridges et al. 2000; Hak et al. 2005). Despite a minority of reports questioning the efficacy of the seasonal influenza vaccine (Jefferson
2006; Simonsen et al. 2005), the majority of studies have found that influenza
vaccination in general is a highly effective means of preventing influenza-related illness. Influenza vaccination has been shown to reduce disease among mothers and young infants (Zaman et al. 2008) and in healthy children (Jefferson et al. 2005; Manzoli et al. 2007). Benefits are also available for healthy working adults, with the influenza vaccine reducing upper respiratory illness by an estimated 25 percent and further reducing work absenteeism due to upper respiratory illness by another 43 percent (Nichol et al. 1995). Seasonal vaccination also provides benefits to the elderly population, who may be more at risk of infection than the general populace (Gross et al. 1995, Nichol et al. 2007). Even when the influenza vaccine, which is prepared before the onset of the flu season, is a poor antigenic match for a particular strain of seasonal influenza, some level of protection can still be acquired through vaccination (Herrera et al. 2007; CDC 2010d).
Yet reaching the new levels of vaccination recommended by the CDC will prove difficult. Prior to the 2010 flu season, the CDC recommended influenza vaccination for those members in the population at particular risk for influenza related complications, such as the elderly or those with chronic health conditions (Lu et al. 2008). However, in a study of vaccination uptake from 1988 through 2004, even for those high-risk groups, estimated vaccinations were lower than their established goals sometimes by as much as an absolute value of 30 percent (Lu et al. 2008).
Disparities in Receipt of Seasonal Influenza Vaccination
An important force in sustaining the large mortality, morbidity, and economic burden of seasonal influenza in the United States is the scope of racial and ethnic
disparities in the receipt of seasonal influenza vaccines. Consistently, lower proportions of racial and ethnic minorities report influenza vaccination relative to non-Hispanic whites (Egede and Zheng 2003; Rangel et al. 2005; Link et al. 2006; Chen et al. 2007; Logan 2009; Linn, Guralnik, and Patel 2010; Burger et al. forthcoming).
Racial and ethnic disparities are so great that Fiscella (2005) suggests that if elderly Hispanic and African Americans were vaccinated at the same rates as elderly non-Hispanic whites, it would result in an additional 1 million elderly racial/ethnic minority persons being vaccinated each year. Furthermore, Fiscella et al. (2007) estimate that an average of 33,000 years of life could be saved each year among elderly racial and ethnic minorities by eliminating disparities in seasonal influenza vaccination.
The reasons for such disparities are likely to be complex. Among the explanations for racial and ethnic differences in influenza vaccination are theories regarding ―attitudes toward vaccination and preventative care‖ (Lu et al. 2008:1791), differences in exposure, susceptibility and treatment (Blumenshine et al. 2008), and structural barriers such as lack of health insurance (Chen et al. 2007). Racial and ethnic minorities may also have less access to information regarding seasonal influenza and the benefits of vaccination (Hebert et al. 2005). In analyzing the reasons cited by racial and ethnic minorities for not receiving an influenza vaccination, Chen et al. (2007) found that one of the most common explanations was lack of concern about contracting the seasonal flu. This lack of concern regarding the receipt of a seasonal influenza vaccine comports with additional research showing racial and ethnic minorities may be less likely to go to a health care facility with the sole intent of receiving an influenza vaccination (Link et al. 2006).
Influenza Vaccination among U.S. Hispanics
Particularly large and persistent disparities in the receipt of seasonal influenza vaccinations have been observed between Hispanics and non-Hispanic whites in the United States (Rangel et al. 2005; Linn, Guralnik, and Patel 2010; Burger et al.
forthcoming). Lu et al. (2008:1791) found that non-Hispanic whites were ―persistently more likely to be vaccinated than […] Hispanics among persons aged ≥65 years, high-risk persons aged 18 through 64 years, health care workers, and household contacts.‖ These observations indicate that this potentially vulnerable population may face significant barriers to acquiring adequate levels of vaccination. In addition to the previously mentioned barriers to vaccination often experienced by racial and ethnic minorities, language barriers can also deter vaccination among Hispanics (Chen et al. 2007). Supporting evidence toward a language barrier in vaccination, Fiscella et al. (2002) finds that English-speaking Hispanics with health insurance did not differ significantly from their non-Hispanic white counterparts in terms of receiving an
influenza vaccination. However, they found that Spanish-speaking Hispanics with health insurance received flu vaccinations at lower rates than non-Hispanic whites with
insurance, emphasizing possible language barriers in vaccination.
In addition, preventive healthcare services, such as the seasonal flu vaccine, are often underutilized by Hispanics (Kang-Kim et al. 2008; Logan 2009). Chen et al. (2007) found that Hispanics often cite structural barriers to flu vaccination, such as insufficient access to healthcare services, lack of transportation, and economic costs. Insurance is also found to be a factor that influences preventive care among Hispanics (Chen et al. 2007; DuBard and Gizlice 2008; Burger et al. forthcoming).
Given the magnitude of the disparity among racial and ethnic minorities
(especially among Hispanics) in receiving a seasonal influenza vaccine, it will be useful to examine these inequalities through a theoretical lens. To help explain the observed disparity in influenza vaccination between Hispanics and non-Hispanic whites in the United States, this study will utilize the concepts and propositions as set forth in the Fundamental Cause Theory (FCT) as presented by Link and Phelan (1995). The FCT not only provides a useful theoretical framework for explaining Hispanic inequalities in influenza vaccination, it also establishes propositions that are easily testable. In the following chapter, a detailed description of FCT is given, as well as an explanation for influenza vaccination patterns among U.S. Hispanics.
CHAPTER III THEORY
In 1995, Link and Phelan presented their seminal theory explaining health disparities in their article entitled, ―Social Conditions as Fundamental Causes of Disease.‖ This article provides the groundwork for what would come to be known as Fundamental Cause Theory (FCT). FCT grew out of a reaction from social
epidemiologists and sociologists alike to the popular ―blame the victim‖ approach of addressing health inequalities in the United States during the 1980s (Link and Phelan 1995). During this time period, medical and social researchers more commonly looked for proximate causes of disease and sought ways to address disease through those causes rather than recognizing the underlying structural issues. For example, with the knowledge that lung cancer was associated with cigarette smoking, public and private campaigns urging individuals to quit smoking emerged. Since smoking was seen as controllable at the individual level, it ―resonates with the value and belief system of Western culture that emphasize[s] both the ability of the individual to control his or her personal fate and the importance of doing so‖ (Link and Phelan 1995:80). However, this approach fails to recognize that behind smoking, a proximate cause of lung cancer, are various
socioeconomic conditions that promote the behavior. Barbeau, Krieger, and Soobader (2004) found that class plays a significant role in rates of smoking and cessation, with higher socioeconomic status individuals being able to utilize more resources to help them quit smoking or avoid it altogether.
Given the focus on personal health behaviors, broader social explanations of health fell out of favor. Link and Phelan (1995) emphasize that societal explanations of health, such as a SES-health association, have been re-contextualized to minimize their importance. First, researchers may disregard societal forces as being merely proxies of disease. Citing evidence of this belief, Phelan et al. (2004:266) note that in the widely read Modern Epidemiology (1986)by Kenneth J. Rothman, socioeconomic status was considered to be ―casually related to few if any diseases but is a correlate of many causes of disease‖ (90). Other times, researchers ignore social forces and rather ―focus on mechanisms that mediate between socioeconomic status and mortality in the hopes of reducing mortality disparities by intervening on those mechanisms‖ (Phelan et al. 2004). Furthermore, the role of socioeconomic status is diminished by researchers considering it merely a ―starting point‖ from which they could pursue the more proximate causes of disease.
As the name of the theory states, FCT posits that social conditions may be the ―fundamental cause‖ of disease (Link and Phelan 1995). By fundamental cause, Link and Phelan refer to the social conditions that influence health outcomes, and ―cannot be eliminated by addressing the mechanisms that appear to link them to disease‖ (86). This point is often demonstrated by using a simple path diagram (Figure 1), which shows the purported relationships between SES, proximate risk factors, and health outcomes.
According to Phelan and Link (2005), traditional epidemiology suggests that if the proximate risk factors were held constant, the association between socioeconomic status and health would be greatly diminished, if nonexistent.
However, as Phelan and Link (2005) describe, history provides examples of when proximate risk factors have been addressed, yet the association between socioeconomic status and health remains. During the 19th century, the major causes of death were primarily related to infectious diseases such as cholera, smallpox, and tuberculosis. Also during this period, intense industrialization and urbanization occurred resulting in population centers which were often overcrowded and lacked sanitary means of providing clean water and disposing of waste. As Szreter (1988) notes, these health hazards were addressed, as adequate housing and clean water were provided. As a
consequence, mortality from infectious diseases diminished. Phelan and Link (2005) note that with the disappearance of those proximate causes of disease (i.e., poor housing and contaminated water), the link between SES and health should have also disappeared. Still, the association between SES and health continued. Phelan and Link (2005) propose that the failure of eliminating poor health outcomes by addressing their proximate causes was due to the fact that
new risk factors (such as chemical pollutants) arose, new knowledge about risk factors (such as smoking) emerged, and new treatment technologies (such as medicines that reduce cholesterol) were developed, and those possessing the most resources were best able to avoid the new risks and take advantage of the new protective factors, resulting in the emergence of a socioeconomic gradient in these factors. (29) Socioeconomic Status Proximate Risk Factors Health Outcomes
FIGURE 1. Causal Diagram Outlining Relationship Between
Indeed, if ―no new diseases emerged (such as AIDS), [and] no new risks developed (such as pollutants), no new knowledge about risks emerged […]‖ then ―the concept of fundamental social causes [of disease] would not apply‖ (Link and Phelan 1995:87). Essentially, fundamental causes of disease ―involve access to resources that can be used to avoid risks or to minimize the consequences of disease once it occurs‖ (87).
Link and Phelan (1995) also make the case that race and ethnicity is often ―so closely tied to resources like money, power, prestige, and/or social connectedness that they should be considered as potential fundamental causes of disease […]‖ (87). According to FCT, because health risks are constantly emerging, economically advantaged individuals, who may be stratified by race/ethnicity, will be better able to utilize resources to experience a more favorable social condition from which to address health risks.
Flexible Resources
The concept of ―flexible resources‖ is important in FCT and is conceptualized broadly as ―money, knowledge, power, prestige, and the kinds of interpersonal resources embodied in the concepts of social support and social network‖ (Link and Phelan
1995:81). These resources include relationships with friends, family, coworkers, and to those whose roles fall within broader societal structures. It is the relationship between such flexible resources and fundamental causes of disease that prevent health disparities from being eliminated by addressing only the proximate causes of disease. In an
knowledge and power will be advantaged in acquiring those resources. Furthermore, FCT also proposes that the use of flexible resources is for the benefit of its members and is done so in a ―purposeful‖ manner (Phelan et al. 2004:268). Examples of such actions or resources used intentionally to promote health among the socioeconomically advantaged include, ―asking for beneficial health procedures; quitting smoking; getting flu shots; wearing seat belts and driving a car with airbags; eating fruits and vegetables; exercising regularly and taking restful vacation‖ (Phelan et al. 2004:267). Since the use of such resources is purposeful, better health outcomes are not merely a ―coincidental side-effect of ‗the good life‘‖ (Phelan et al. 2004:268).
Fundamental Causes of Disease
In summarizing the fundamental social causes of disease, Phelan et al. (2004) describe first the fundamental causes‘ ability to ―influence multiple disease outcomes‖ (280). Indeed, the social causes of morbidity and mortality are not limited to a single disease. For example, Everson et al. (2002) found low SES to be related to higher risk of depression, obesity, and diabetes. Secondly, fundamental causes can also affect disease outcomes through a variety of risk factors. Thirdly, the ―association between the fundamental cause and mortality is reproduced over time via the replacement of intervening mechanisms‖ (Phelan et al. 2004: 268). As mentioned previously, if new risks to human health do not emerge, then the economically advantaged would not be able to use their flexible resources to reduce risks of negative health outcomes.
Finally, the ―essential feature‖ of fundamental causes in disease is that they ―involve access to resources that can be used to avoid risks or to minimize the
consequences of disease once it occurs‖ (Phelan et al. 2004:268). An excellent example of this utilization of resources by the socioeconomically advantaged to offset health risks can be found in Victora et al. (2000). In analyzing differences in infant mortality rates (IMR) among Brazilian children, disparities were observed between the
socioeconomically advantaged and the poor. In two different cities, it was found that the economically advantaged were better able to utilize public-health programs designed to reduce infant mortality. The remarkable decline in infant mortality rates among the economically advantaged led Victora et al. (2000:1098) to conclude that ―an increasing proportion of the rich were making use of newer technologies that were still unavailable to most of the poor.‖
Important in understanding the implications of the fundamental cause perspective in describing racial and ethnic disparities is the ability of a given society to control a disease. Phelan and Link (2005) argue that the ability of a society to control disease and death is just as important for the creation of health disparities as the unequal distribution of resources. This ―core‖ proposition of FCT posits that ―It is our enormously expanded capacity to control disease and death in combination with existing social and economic inequalities that create health disparities by race and SES‖ (29). So, new techniques or knowledge in promoting health are ―distributed according to resources of knowledge, money, power, prestige, and beneficial social connections‖ (29). This means that health ―disparities by SES and race should emerge when new health enhancing information or technology is developed‖ (30).
Following the FCT perspective, disparities in flu vaccinations are likely to be observed between non-Hispanic whites and Hispanics; given that non-Hispanic whites
may be better able to utilize their higher socioeconomic status in applying flexible resources to maximize health benefits. However, controlling for flexible resources that encourage vaccination should attenuate this ethnic disparity in vaccination for seasonal influenza. This is an expected outcome since there is nothing fundamental about race or ethnicity per se that leads to poorer health outcomes; instead, race and ethnicity tend to predict disease because of the flexible resources associated with it. Before analyzing 2001 through 2010 BRFSS data for these possible disparities, I will discuss my strategy to manipulate BRFSS data in a manner that yields accurate seasonal influenza
CHAPTER IV
METHODS AND ANALYSES
The ability to monitor a population‘s health is of critical importance in maintaining a healthy and productive society. Without proper health information,
addressing health issues to reduce mortality and morbidity burdens within a population is extremely difficult – even impossible. In order to properly address public health
concerns, adequate and accurate data are essential. The manner in which a population obtains such information is typically through various health surveillance surveys and public records.
While such information plays a vital role in gauging the health of society, it is important to remember its limitations. Much of the information derived from survey research regarding health behaviors is taken from cross-sectional data. While providing a picture, or ―slice‖ of information regarding the health of society at any particular
moment, cross-sectional research cannot evaluate health trends over time.
The ability to track long-term trends in health behaviors and outcomes is important in adequately addressing concerns to public health. By observing long-term trends in health behaviors, a clearer picture of the nature of health issues and their impact can be assessed. Thacker and Berkelman (1988), in their commentary on the modern day conception of public health research, advise that ―one-time surveys or sporadic studies do not constitute surveillance‖ (164). Rather, for health surveillance research to assess population health adequately, it must be conducted in a manner that tracks health behaviors and/or outcomes over a period of time.
Thacker and Berkelman (1988) also note that surveillance is not enough if health data are not ―integrated into the conduct and evaluation of specific public health
programs [...]‖ (164). Failing to connect the data that are collected through health surveillance surveys to potential or present remedial health policies limits the utility of public health research. Organizations that influence public health policies have a vested interest in tracking health related measures over time in order to evaluate the
effectiveness of public health programs.
Unfortunately, limitations sometimes arise with data that are used to track public health behaviors. A certain question may not be asked a certain year, or measures used to evaluate particular health issues may be ineffective. Certainly, great care and work is involved in creating the surveys which help monitor the public‘s health, but it is essential to detect limitations and devise strategies to overcome them. Many times those
limitations are corrected in subsequent surveys; for instance, health measures may be revised or added. While this may resolve data limitations for future survey waves, it cannot address past limitations, and may also lead to inconsistent measurement between waves, creating difficulties in assessing long-term health trends. If public health
surveillance is dependent on the continual monitoring of public health data, then the inability to utilize past survey waves limits the public health researcher in addressing important health-related issues.
One such issue is the receipt of the seasonal influenza vaccine. Tracking seasonal influenza vaccinations through the BRFSS provides both state and national estimates in vaccination coverage. To reduce the disease burden of the seasonal flu in the United States., it is important to provide accurate seasonal estimates that detect at-risk groups,
possible disparities, and trends in vaccination coverage over time. In order to address such disparities this research will utilize the 2001 through 2010 BRFSS.
The Behavioral Risk Factor Surveillance System (BRFSS)
The BRFSS is the longest ongoing telephone-based health surveillance survey in the world (CDC 2008). Throughout the year, surveys are administered in all 50 states (as well as the District of Columbia, Guam, the U.S Virgin Islands and Puerto Rico),
gathering information on the health status of non-institutionalized adults over the age of 18. The BRFSS is important because of its ability to ―identify emerging health problems, establish and track health objectives, and develop and evaluate public health policies and programs‖ (CDC 2008). Given that the BRFSS is administered by individual states and compiled by the CDC to be nationally representative, it is an important means of monitoring health on a national as well as state level.
Beginning in 2001, the BRFSS included new measures of seasonal influenza vaccination behavior in its core questionnaire. Respondents were asked if they had received a seasonal flu vaccination in the past 12 months. Beginning in 2004, the BRFSS also asked if the respondent received a flu vaccination via nasal spray within the last 12 months. While providing information regarding whether the respondent has recently received an influenza vaccine, the questions fail to specify during which flu season (which typically begin during late October or November of a given year and last through the summer of the next year; see CDC 2010b) the respondent reported his or her
vaccination. Given the retrospective nature of the question and the fact that the BRFSS is administered throughout the year, the respondent could potentially report vaccination for
any of three possible influenza seasons. This limitation means that precise seasonal influenza vaccination estimates are not readily available.
Not until the 2009 BRFSS was a follow-up question introduced, ascertaining the month and year of the respondents‘ most recent reported vaccination. The addition of this question allowed more accurate categorization of vaccinations into particular influenza seasons. Despite this improvement, the question does not identify the appropriate influenza season for respondents who did not receive a vaccination. Without a question asking if the respondent did or did not receive an influenza vaccination specifically during a particular flu season, it is not possible to estimate flu vaccination rates with exact precision. This issue in estimating seasonal flu vaccinations has been observed by other researchers (Lu, Euler, and Callahan. 2009; Linn et al. 2010; Setse et al. 2011), who have articulated various methods to account for the problem. This thesis presents a
summary of those methods and utilizes an alternative method, first presented in Burger et al. (forthcoming), which allows for an accurate estimation of seasonal influenza
vaccinations while retaining as many respondents as possible. After describing the method to be employed in this research, a brief comparison of these alternative approaches will be presented.
Filtering Respondents by Month of Interview
The 2009 and 2010 waves of the BRFSS were the first to report when the
respondent received his or her seasonal influenza vaccination; data from these waves can be used to examine the distribution of reported influenza vaccinations for each flu season. As shown in Table 1, the 2009 BRFSS contains influenza vaccination data (either
through the traditional flu shot or nasal spray) for the 2007, 2008, and 2009 flu seasons. Similarly, in Table 2 it is observed that the 2010 BRFSS contains vaccination data for the 2008, 2009, and 2010 flu seasons. Of those reporting a flu vaccination in the 2009
BRFSS, most reported that their vaccination was for the 2008 flu season (77.3 percent). However, more than a fifth these respondents (22.7 percent) reported that their
vaccination was for either the 2007 or 2009 flu seasons. Similarly, of those reporting vaccination in the 2010 BRFSS, a majority reported vaccination for the 2009 flu season (75.8 percent) and about a quarter (24.2 percent) reported vaccination for either the 2008 or 2010 flu seasons.
Given the seasonal nature of influenza epidemics and the regularity at which they occur, Burger et al. (forthcoming) propose that restricting respondents by month of interview will yield substantial improvements in the accuracy of estimates for seasonal vaccination rates. The logic used in restricting respondents by month of interview is illustrated through the following example. If a respondent is interviewed during January of any particular survey year, that individual cannot report receipt of a flu vaccination for the upcoming flu season since it would not begin until later, in the fall of that year. Given this fact and considering that vaccination for seasonal influenza typically begins in the last quarter of the year, respondents interviewed from January through September should be more likely to report the receipt of an influenza vaccination for the previous year‘s flu season.
Since the 2009 and 2010 BRFSS include information regarding the month and year of the respondent‘s last reported flu vaccination, these data are ideal for testing the method I have just outlined. As shown in Tables 1 and 2, significant gains in accuracy are
achieved by restricting respondents by interview months January through September. Restricting respondents in such a manner produced samples within the 2009 and 2010 BRFSS where 97.9 percent and 97.4 percent of reported flu vaccinations correspond to the 2008 and 2009 influenza seasons, respectively. It is expected that the application of this method would produce similar gains in accuracy for previous years of the BRFSS, which would allow public health researchers to estimate past vaccination rates more accurately; this in turn facilitates better depictions of population trends in influenza vaccination (Burger et al. forthcoming).
Previous Methods
While the method presented in Burger et al. (forthcoming) produces samples that are more representative of the prior year‘s flu season than is possible by utilizing the survey wave as a whole, other methods have also been proposed to address the issue of estimating seasonal influenza vaccinations within the BRFSS. Three of these approaches will be discussed in regard to their strengths and weaknesses and how they compare to the method that I advocate in this study.
Linn et al 2010. In Linn et al. (2010) an analysis of disparities in seasonal
influenza vaccinations is presented for the 2007 flu season using data from the 2008 BRFSS. In their estimates, Linn et al. (2010) include all vaccination responses from the 2008 BRFSS. While recognizing that this method is likely to include responses from flu seasons other than the season of interest, Linn et al. (2010) justify their methodology since ―when the sample was restricted to the first quarter of 2008 to avoid respondents
referencing different influenza seasons, the overall prevalence and disparities were essentially the same‖ (1339).
However, just as mortality rates can differ depending on the flu season, so can vaccination uptake among the population. For example, increased media coverage of the flu and the importance of vaccination could increase vaccination rates (Ma et al. 2006). Also, problems in producing or administering influenza vaccines could result in lower seasonal estimates. For example, during the 2004 flu season a contamination problem led to the temporary shutdown of one of the two major pharmaceutical plants that produced influenza vaccines for the United States, causing a massive shortage in vaccinations (Schleicher 2004). This shortage resulted in a 50 percent reduction of vaccination supplies for the 2004 flu season (Zimmerman et al. 2006), which led to sharply lower rates of vaccination coverage.
Therefore, the approach advocated by Linn et al. (2010) may be susceptible to inaccurate estimation of influenza vaccination rates. When applying the Linn et al. (2010) methodology to the 2009 and 2010 BRFSS (i.e., the entire survey wave is used to
estimate the prior year‘s influenza season), some problems are observed. As shown in Table 1 and Table 2 nearly a quarter of the respondents during each survey year reported receipt of a vaccine for a flu season other than the one of interest. Including such a large proportion of respondents reporting vaccination for other flu seasons is likely to produce inaccuracies in subsequent analyses.
Lu et al. 2009. Lu et al. (2009) estimate seasonal influenza vaccination rates for
individuals 18 through 64 with asthma during the 2006 influenza season using data from the 2007 BRFSS. To produce their estimates, Lu et al. (2009) use respondents
interviewed from February through August of 2007. This method recognizes that many respondents within the BRFSS report influenza vaccinations for flu seasons other than the one of interest, and that limiting respondents by time of interview improves the accuracy of seasonal vaccination estimates. While this does indeed improve accuracy, the choice of survey months is somewhat restricted, limiting sample size and potentially compromising statistical power. Limiting respondents by interview months February through August of the 2009 and 2010 BRFSS retains only 77.1 percent and 73.1 percent of the original respondents who reported a vaccination during the 2008 and 2009 influenza seasons, respectively.
Adopting the technique introduced in Burger et al. (forthcoming) (i.e., including BRFSS respondents interviewed from January through September) improves retention to 94.6 percent and 91.7 percent of the respondents who received a vaccine for the 2008 and 2009 flu seasons. This maximizes the number of respondents included in each wave of the BRFSS, ensuring that a representative sample is obtained and that statistical power is optimized.
Setse et al. 2011.In Setse et al. (2011) seasonal vaccination estimates are
provided for the United States for the 2000 through 2009 influenza seasons. Using the 2001 through 2010 survey waves of the BRFSS, Setse et al. (2011) examine racial/ethnic disparities in influenza vaccination within the United States. Following a similar
approach as found in Lu et al. (2009), Setse et al. (2011) instead limit respondents in each wave of the BRFSS by interview months March through August to estimate seasonal. When applying the method as proposed in Setse et al. (2011) to the 2009 and 2010 BRFSS, samples are produced where 98.5 percent and 98.2 percent of those interviewed
represent the 2008 and 2009 influenza seasons. While miniscule gains in accuracy can be achieved by restricting the sample to these interview months, they are overshadowed by the fact that this method excludes more than a third of the original respondents who reported a flu vaccination for either the 2008 or the 2009 influenza seasons.
Comparison using the National Health Interview Survey (NHIS)
In order to ensure that the benefits of using interview months January through September are not anomalous to the 2009 and 2010 waves of the BRFSS, similar
analyses are performed using data from the 2005 through 2010 National Health Interview Survey (NHIS) sample adult file. Sponsored by the CDC, the NHIS has been conducted annually since 1957. Similar to the BRFSS, the NHIS provides health information on non-institutionalized adults in the United States. The NHIS is considered the ―principle source of information‖ for that population (CDC 2011a). However, the NHIS differs significantly from the BRFSS in that data are collected using a completely different collection procedure. While the BRFSS provides data acquired through telephone based surveys, the NHIS data are gathered via face-to-face interviews.
Since the logic which allows gains in accuracy to be made within the BRFSS can also apply to the NHIS (i.e., that individuals interviewed prior to October of the survey year generally cannot report a flu vaccination for the upcoming flu season), it should be possible to improve the accuracy of NHIS estimates of seasonal influenza vaccination rates, as it was for the BRFSS. It should be noted that instead of month of interview (as in the BRFSS) the NHIS records when the respondent was interviewed into four interview quarters (January through March, April through June, July through September, and
TABLE 1. Comparison of Methods of Estimating Seasonal Influenza Vaccination Within the 2009 Behavioral Risk Factor Surveillance System (BRFSS).
Entire Sample Interview Month: January ´09 – January ´10 Linn et al. 2010 Restricting Vaccinations by Interview Month: January ´09 – September ´09 Burger et al.(forthcoming) Restricting Vaccinations by Interview Month: October ´09 – January ´10 Lu et al. 2009 Restricting vaccination by Interview Month: March ´09 – August ´10 Setse et al. 2011 Flu Season n % Flu Season n % Flu Season n % Flu Season n % 2007a 2,341 1.24% 2007a 2,341 1.64% 2007a 1,909 1.66% 2007a 1,448 1.50% 2008b 146,263 77.32% 2008b 138,337 97.13% 2008b 112,720 98.30% 2008b 95,162 98.46% 2009c 40,568 21.45% 2009c 1,743 1.22% 2009c 45 0.04% 2009c 44 0.05%
Total 189,172 100% Total 142,421 100% Total 114,674 100% Total 96,654 100%
a. Received flu vaccination from 01/07–08/07. b. Received flu vaccination from 09/07–08/08. c. Received flu vaccination from 09/08–12/09.
TABLE 2. Comparison of Methods of Estimating Seasonal Influenza Vaccination Within the 2010 Behavioral Risk Factor Surveillance System (BRFSS).
Entire Sample Interview Month: January ´09 – January ´10 Linn et al. 2010 Restricting Vaccinations by Interview Month: January ´09 – September ´09
Burger et al. (forthcoming)
Restricting Vaccinations by Interview Month: October ´09 – January ´10 Lu et al. 2009 Restricting vaccination by Interview Month: March ´09 – August ´10 Setse et al. 2011 Flu Season n % Flu Season n % Flu Season n % Flu Season n % 2008a 2,752 1.36% 2007a 2,752 1.91% 2007a 2,276 2.00% 2007a 1,763 1.81% 2009b 152,988 75.75% 2008b 140,246 97.42% 2008b 111,791 97.99% 2008b 95,427 98.17% 2010c 46,212 22.88% 2009c 965 0.67% 2009c 17 0.01% 2009c 16 0.02%
Total 201,952 100% Total 143,963 100% Total 114,084 100% Total 97,206 100%
a. Received flu vaccination from 01/08–08/08. b. Received flu vaccination from 09/08–08/09. c. Received flu vaccination from 09/09–12/10.
October through December). This allows a convenient comparison of the effectiveness of restricting respondents by interview months January through September in the BRFSS to the first three quarters (January through September) of the NHIS. Tables 3 through 8 shows during which flu season the respondent reported the influenza vaccination (either through the traditional flu shot or nasal spray) for the 2005 through 2010 waves of the NHIS. First, all reported vaccinations are placed in their respective flu seasons, and then vaccinations are shown while restricting respondents to the first three quarters of the survey wave.
For each wave of the NHIS from 2005 to 2010, gains in the accuracy of estimates for seasonal flu vaccination rates can be achieved by limiting respondents to the first three quarters of the survey wave. Compared to using the entire survey wave, restricting respondents in this manner improved my ability to isolate a specific flu season among respondents who received an influenza vaccine; specifically, the percentage of
respondents who received their flu shot in the previous flu season increased from 77.4 percent to 97.4 percent, on average. This improvement in the ability of the NHIS to represent a specific flu season is accomplished while still retaining, on average, 91.3 percent of all respondents who reported receiving a flu vaccine in the year prior to the NHIS interview. The improved ability to isolate vaccinations to specific flu seasons means that providing seasonal influenza vaccination estimates or performing seasonal analyses can be performed with greater confidence.
The approach advocated in Burger et al. (forthcoming) of filtering respondents by interview months January through September works equally well for two
usefulness of this method. Even in flu seasons where dramatic disruptions occurred in the distribution of flu vaccinations throughout society, such as during the shortage
experienced during the 2004 influenza season, restricting respondents by interview months January through September produces samples which allow for a more accurate estimation of seasonal influenza vaccinations.
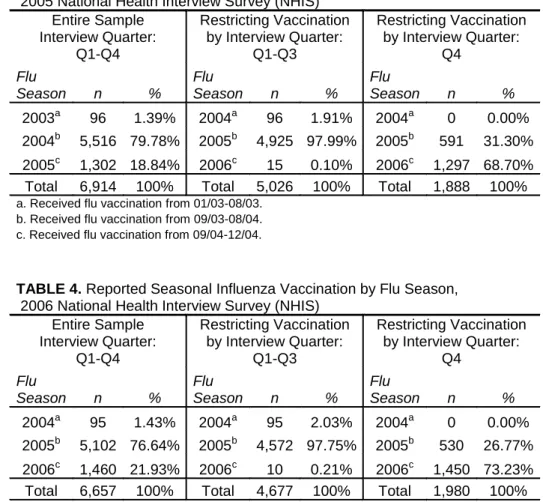
TABLE 3. Reported Seasonal Influenza Vaccination by Flu Season, 2005 National Health Interview Survey (NHIS)
Entire Sample Interview Quarter: Q1-Q4 Restricting Vaccination by Interview Quarter: Q1-Q3 Restricting Vaccination by Interview Quarter: Q4 Flu Season n % Flu Season n % Flu Season n % 2003a 96 1.39% 2004a 96 1.91% 2004a 0 0.00% 2004b 5,516 79.78% 2005b 4,925 97.99% 2005b 591 31.30% 2005c 1,302 18.84% 2006c 15 0.10% 2006c 1,297 68.70%
Total 6,914 100% Total 5,026 100% Total 1,888 100%
a. Received flu vaccination from 01/03-08/03. b. Received flu vaccination from 09/03-08/04. c. Received flu vaccination from 09/04-12/04.
TABLE 4. Reported Seasonal Influenza Vaccination by Flu Season, 2006 National Health Interview Survey (NHIS)
Entire Sample Interview Quarter: Q1-Q4 Restricting Vaccination by Interview Quarter: Q1-Q3 Restricting Vaccination by Interview Quarter: Q4 Flu Season n % Flu Season n % Flu Season n % 2004a 95 1.43% 2004a 95 2.03% 2004a 0 0.00% 2005b 5,102 76.64% 2005b 4,572 97.75% 2005b 530 26.77% 2006c 1,460 21.93% 2006c 10 0.21% 2006c 1,450 73.23%
Total 6,657 100% Total 4,677 100% Total 1,980 100%
a. Received flu vaccination from 01/04-08/04. b. Received flu vaccination from 09/04-08/05. c. Received flu vaccination from 09/05-12/05.
TABLE 5. Reported Seasonal Influenza Vaccination by Flu Season, 2007 National Health Interview Survey (NHIS)
Entire Sample Interview Quarter: Q1-Q4 Restricting Vaccination by Interview Quarter: Q1-Q3 Restricting Vaccination by Interview Quarter: Q4 Flu Season n % Flu Season n % Flu Season n % 2005a 68 0.97% 2005a 68 1.37% 2005a 0 0.00% 2006b 5,361 76.44% 2006b 4,887 98.45% 2006b 474 23.13% 2007c 1,584 22.59% 2007c 9 0.18% 2007c 1,575 76.87%
Total 7,013 100% Total 4,964 100% Total 2,049 100%
a. Received flu vaccination from 01/06-08/06. b. Received flu vaccination from 09/06-08/07. c. Received flu vaccination from 09/07-12/07.
TABLE 6. Reported Seasonal Influenza Vaccination by Flu Season, 2008 National Health Interview Survey (NHIS)
Entire Sample Interview Quarter: Q1-Q4 Restricting Vaccination by Interview Quarter: Q1-Q3 Restricting Vaccination by Interview Quarter: Q4 Flu Season n % Flu Season n % Flu Season n % 2006a 101 1.40% 2006a 101 1.64% 2006a 0 0.00% 2007b 6,326 87.46% 2007b 6,032 97.99% 2007b 294 27.30% 2008c 806 11.14% 2008c 23 0.37% 2008c 783 72.70%
Total 7,233 100% Total 6,156 100% Total 1,077 100%
a. Received flu vaccination from 01/07-08/07. b. Received flu vaccination from 09/07-08/08. c. Received flu vaccination from 09/08-12/08.
TABLE 7. Reported Seasonal Influenza Vaccination by Flu Season, 2009 National Health Interview Survey (NHIS)
Entire Sample Interview Quarter: Q1-Q4 Restricting Vaccination by Interview Quarter: Q1-Q3 Restricting Vaccination by Interview Quarter: Q4 Flu Season n % Flu Season n % Flu Season n % 2007a 102 1.08% 2007a 102 1.73% 2007a 6 0.20% 2008b 6,147 64.87% 2008b 5,586 94.77% 2008b 561 15.64% 2009c 3,227 34.05% 2009c 206 3.50% 2009c 3,021 84.20%
Total 9,476 100% Total 5,894 100% Total 3,588 100%
a. Received flu vaccination from 01/08-08/08. b. Received flu vaccination from 09/08-08/09. c. Received flu vaccination from 09/09-12/09.