Water Behind Capacity
Pål Henrik Roti
Master of Energy and Environmental Engineering Supervisor: Magnus Korpås, ELKRAFT Co-supervisor: Ellen Krohn Aasgård, IØT
Department of Electric Power Engineering Submission date: June 2016
Preface
This master’s thesis is the result of the final project carried out as part of the Master of Science degree in Energy Planning and Environmental Analysis at the Norwegian University of Science and Technology, Department of Electric Power Engineering. The project has been completed during the spring semester of 2016, and has been part of the scientific cooperation between the university and SINTEF Energy Research.
During the work of this project, I have had excellent guidance from my supervisors Magnus Ko-rpås and Ellen Krohn Aasgård, of which I am very grateful. In addition to his excellent guidance and contribution to the work, I am very thankful and impressed by Korpås’ wish to guide as many students as possible. Of equal importance, Aasgård has been very helpful in assisting me with the problems I have met. She has made a great contribution to the work, with her expertise in the subject, as well as bringing up the idea to the project. Additionally, I am very grateful for the data Statkraft and Hydro Energi has provided me, and I would especially like to thank Ole Løseth Elvetun at Hydro Energi for helping me with his industrial points of views. I would also like to thank Finn Erik Ljåstad Pettersen, Eivind Lindeberg, Erik Alexander Jansson and Gerard Doorman at Statnett for providing me helpful information about the balancing markets.
Trondheim, 2016-06-17 Pål Henrik Roti
Executive Summary
When the power system becomes more dependent on intermittent renewable energy, the need for ancillary services becomes larger. Therefore, the power producers’ ability to deliver reserves has been analysed in this thesis. Additionally, the costs of delivering such services have been evaluated, as these costs determine if it is profitable for hydro power producers to supply bal-ancing power instead of energy. Since hydro power is a well suited source for delivering balanc-ing power, and a major part of the Nordic power system, the amounts of reserves which can be delivered from hydro power units have been the main topic of this thesis.
The thesis is based on the decision support tool SHOP, which is a short term optimization model for hydro power producers developed at SINTEF Energy Research, in addition to its newly de-veloped simulation funcionality. The model is one of the industry’s most used tools for finding the optimal amount of energy to be sold in the power market in every hour for the days to come. However, the model is not adequate for deciding the amount of reserves to be be delivered, and does not consider hydrological constraints when the reserves are activated. Therefore, the first objective in this thesis has been to develop a methodology for assessing the amounts of reserves which can be delivered. In order to do this, the methodology has been based on the excising models, and the model functionalities have been utilized in innovative and non-standard ways. Next, the second objective in this work has been to validate the methodology on illustrative and realistic case studies.
From the results in the analysis, it has been shown that the developed methodology successfully assesses the amounts of reserves which can be delivered, and produces realistic results. Hence, the results are not only verifying the methodology, but are also illustrating concepts which are very valuable for market participants who are delivering ancillary services. Furthermore, it has been shown that the costs and amounts of reserves which can be delivered from a hydro system in the regulating power option market are strongly related to the amount of available water in the system’s reservoirs. Additionally, the hydro system’s flexibility also plays an important role, as more reserves can be delivered from a less constrained system. As more flexibility is avail-able when reserves are delivered from a hydro system which consists of several cascaded plants,
more reserves can typically be delivered from such systems, and at lower costs.
The analysis has been carried out in several steps. First, the expected number of hours which the reserved capacity is activated has been found. This estimate is based on available historical data of the Nordic power system, and statistical methods have been used to find the expected number. Next, the maximum amount of capacity which can be activated from a hydro system during the expected time period without emptying the system’s reservoirs has been found. Fi-nally, the costs of delivering different amounts of reserves have been found. The analysis has been carried out on two different hydro systems, where different amounts of generation capac-ity have been reserved for the regulating power option market, and the amounts of available water in the reservoirs have been varied.
At last, it has been shown that the amounts of reserves which actually can be delivered are lim-ited, even though the system easily can withhold more generation capacity from the generating units. This is both due to water unavailability and violation of hydrological constraints when the reserved capacity is activated. Hence, in order to obtain decision support tools which are well suited for production scheduling in several markets, the excising models should be extended to include algorithms which assess the volumes that can be delivered in the balancing markets while considering the risk of violating relevant constraints.
Samandrag
Når kraftsystemet vert avhengig av meir uregulerbar og fornybar energi, aukar behovet for bal-ansetenester. Derfor har kraftprodusentar si evne til å levere reserver til kraftsystemet blitt anal-ysert i denne oppgåva. Dessutan har kostnaden knytt til å levere reserver også blitt evaluert, et-tersom desse kostnadane avgjer om det er lønsamt å levere reservekraft i tillegg til ordinær kraft. Sidan vasskraft er veldig godt egna til å levere balansekraft, og er ein stor del av det nordiske kraftsystemet, har mengda reserver som kan leverast frå vasskraft vore hovudtemaet i denne oppgåva.
Oppgåva er basert på beslutningsstøtteverktøyet SHOP, som er ein korttids optimaliseringsmod-ell for kraftprodusentar utvikla av SINTEF Energi, i tillegg til dens nylig utvikla simulerings-funksjonalitet. Denne modellen er ein av industriens mest brukte verktøy for å finne optimal produksjon av vasskraft for kvar time dei påfølgande dagane. Modellen kan derimot ikkje ta slutning til mengda reserver som kan leverast, og tek heller ikkje hensyn til hydrologiske re-striksjonar når reserver vert aktivert. Difor har det første føremålet med denne oppgåve vore å utvikle ein metodikk for å vurdere mengda reserver som kan leverast. Denne metodikken har blitt basert på eksisterande modellar, og funksjonaliteten til modellane har blitt utnytta på innovative og kreative måtar. Det andre føremålet med denne oppgåva har vore å validere metodikken på illustrative og realistiske eksempler.
Frå resultata i denne oppgåva har det blitt vist at den utvikla metodikken vellykka finn mengda reserver som kan leverast, og produserer realistiske resultat. Resultata frå analysen er derfor verdifulle i seg sjølv, sidan dei illustrerer viktige konsept for marknadsaktørar som leverer bal-ansetenester. Det har blitt vist at kostnaden og mengda reserver som kan leverast frå eit vasskraft-system i regulerkraftopsjonsmarknaden er sterkt knytt til mengda vatn som er tilgjengelig i sys-temet sine magasin. I tillegg speler syssys-temet sin fleksibilitet ei viktig rolle, då meir reserver kan leverast frå eit system med færre restriksjonar knytt til vassvegar og magasin. Sidan meir flek-sibilitet er tilgjengeleg om reserver vert levert frå eit system som består av fleire kraftstasjonar, kan meir reserver typisk leverast frå denne typen system, til ein lågare kostnad.
Analysen har blitt gjennomført i fleire steg. Først har det forventa talet timar der den reserverte kapasiteten blir aktivert i ei veke blitt funne. Dette er estimert basert på tilgjengelig historisk data for det nordiske kraftsystemet, og statistiske metodar har blitt brukt til å finne det forventa talet. Vidare har den maksimale mengda kapasitet som kan bli aktivert gjennom den forventa tidsperioden utan å tømme magasina i systemet blitt funne. Til slutt har kostnaden av å levere ulike mengder reserver blitt funne. Analysen har blitt utført på to ulike vasskraftsystem, der ulike mengder produksjonskapasitet har blitt reservert til regulerkraftopsjonsmarknaden, og mengda tilgjengelig vatn i magasina til systema har blitt variert.
Til slutt har det blitt vist at mengda reserver som faktisk kan leverast er avgrensa, sjølv om sys-temet lett kan holde av meir produksjonskapasitet frå generatorane. Dette er både på grunn av mangel på tilgjengelig vatn til å aktivere meir reserver, i tillegg til brot på hydrologiske re-striksjonar. Derfor må dei eksisterande modellane utvidast med metodikkar av typen som er presentert i denne oppgåva for å få verktøy til beslutningsstøtte som er godt egna til å delta i fleire marknader.
Contents
Preface . . . i
Executive Summary . . . iii
Samandrag . . . v Acronyms . . . xi 1 Introduction 1 1.1 Background . . . 1 1.2 Problem Formulation . . . 3 1.3 Literature Survey . . . 5 2 Theoretical concepts 7 2.1 The Frequency in a Power System . . . 7
2.2 The Power Markets . . . 8
2.3 Balancing Markets . . . 10
2.4 Planning Hierarchy and Models . . . 16
3 Methodology 23 3.1 Analysis Approach . . . 23
3.2 Case Study . . . 32
4 Results and Discussion 41 4.1 Power System Statistics . . . 41
4.2 Kvistforsen . . . 43
4.3 Røldal-Suldal . . . 48
4.4 Limitations of Assumptions . . . 63
5 Conclusions 65
CONTENTS CONTENTS
List of Figures
2.1 Supply and demand intersection point, taken from NordPoolSpot [1]. . . 9
2.2 Reserves activation scheme, modified from Statnett [2]. . . 11
2.3 Primary reserves’ control system, taken from Bevrani [3]. . . 12
2.4 Hydro power scheduling stages, taken from Doorman [4]. . . 16
3.1 Illustration of risk level . . . 25
3.2 Finding max delivery process . . . 30
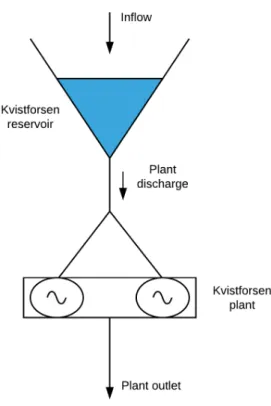
3.3 Kvistforsen hydro system . . . 34
3.4 The spot price for the planning period. . . 35
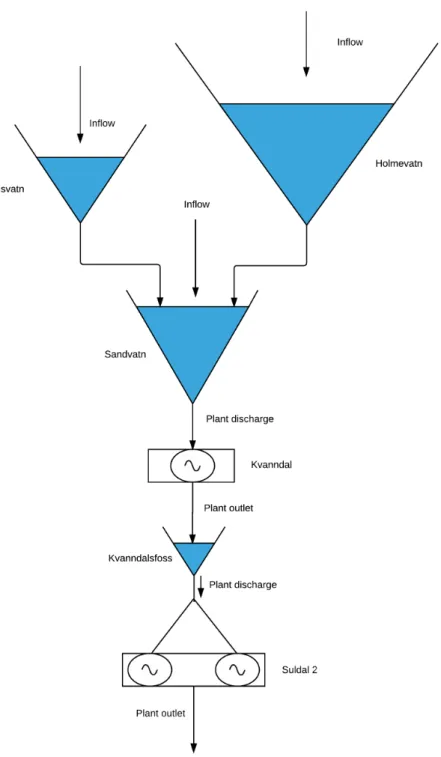
3.5 Røldal-Suldal hydro system . . . 38
3.6 The spot price for the planning period. . . 39
4.1 Corresponding risk levels . . . 42
4.2 Delivered reserves from Kvistforsen . . . 44
4.3 Costs of delivering reserves from Kvistforsen . . . 46
4.4 Delivered reserves from Suldal 2 . . . 49
4.5 Costs of delivering reserves from Suldal 2 . . . 50
4.6 Delivered reserves from Kvanndal . . . 52
4.7 Costs of delivering reserves from Kvanndal . . . 53
4.8 Delivered reserves from both plants . . . 56
4.9 Costs of delivering reserves from both stations. . . 57
4.10 Activating reserves with different amounts of capacity withheld . . . 59
4.11 Delivering reserves using the two different strategies . . . 60
List of Tables
4.1 Mean values and standard deviations . . . 41 4.2 Maximum activation at different risk levels . . . 42
LIST OF TABLES LIST OF TABLES
Acronyms
TSO Transmission System Operator
DAM Day-ahead Market
IDM Intra-day Market
FRC-N Frequency Controlled Reserves for Normal Operation
FRR-A Automatic Frequency Restoration Reserves
FRR-M Manual Frequency Restoration Reserves
RK Regulating Power Market
Chapter 1
Introduction
This chapter will present some background material and define the scope of the problem ad-dressed in this thesis.
1.1 Background
Traditionally, a lot of the electrical power generation in Europe has come from thermal genera-tion. In a power system based on thermal generation, the energy is stored in the fuel and can be converted to electrical energy whenever needed. However, as there are a lot of emissions asso-ciated with a power system based on fossil fuels, this solution is not very sustainable. Therefore, an ambition of a power system based on renewable resources is being implemented worldwide. Among these policies, the 20-20-20 energy and climate targets have been set by the European Union[5].
Although renewable energy can be both clean and cost effective, one of its main drawbacks is that the power output is very weather dependent. Wind and solar power extract energy from natural forces in order to produce electrical power, which can be unreliable. Since the amount of power produced is dependent on the intensity of the weather dependent sources, the ability to regulate the power output is limited. Also, storing the energy from these sources is very costly, so the energy has to be used when it is produced. Because the power production from these sources may not always be sufficient, some kind of backup source is needed in order to provide enough energy to cover the demand at all times. Since the weather is changing swiftly, this backup source needs to be able to adapt quickly to deviations. Additionally, forecasting the exact time of the weather changes is close to impossible, adding a lot of uncertainty to when the
1.1. BACKGROUND CHAPTER 1. INTRODUCTION
backup source is needed.
A very well suited, renewable source for balancing power is hydro power. Since water is being stored in reservoirs, the energy can be produced whenever needed. Also, the power output can be adjusted very fast, and the most efficient operation point is usually around 90% of the units’ maximum capacity. Hence, reserve capacity is already available when power is being produced at the best efficiency. Additionally, both the start up time and cost of hydro power are very low, easily making more capacity available whenever needed.
As stated by the Norwegian TSO, among others, more intermittent renewable energy such as wind and solar power is expected to enter the European power system. Additionally, climate change contributes to more extreme weather conditions, increasing the frequency of transmis-sion and generation outages. Hence, the power supply becomes less reliable, and the need of balancing power is growing. As the Nordic power system is based on a lot of hydro power, it is well suited for delivering balancing services to the rest of the European power system. This solution would be beneficial for the hydro power producers, which could receive a higher price for the produced power through the balancing markets, as well as being a good alternative for the European system’s need of balancing power[2].
1.2. PROBLEM FORMULATION CHAPTER 1. INTRODUCTION
1.2 Problem Formulation
The main task in the day-to-day scheduling for a hydro power producer is to decide how much the production of electrical energy should be in the coming hours. If the hydro system has the possibility to store water in reservoirs, the producer might gain higher profits by saving the water for later. But then there is also a chance of the reservoir filling up, causing the water to spill. As this water could have been used to produce electricity, the producer could have utilized the water better by producing more energy at lower prices. Therefore, finding the balance between producing now versus saving water is the key question in hydro power scheduling.
Most of the produced energy in the Nordic power system is sold in the day-ahead market, Elspot. As several markets has been developed for balancing the power supply and demand, selling power has become a more complex problem. Producers can choose to set aside capacity for the TSO to restore imbalances between supply and demand for a given period. This commitment can be made before the amount of energy which is sold in the day-ahead market is specified, but also after the energy is sold in the market. As many of these markets are relatively new and still under development, no commonly used method for finding the optimal volumes to offer in the different markets are established.
For the power producers to be able to maximize their profit, an optimization model is often used to find the volumes of sold energy in the power market which generates the most income. The short term optimization model SHOP is a well known model by Nordic hydro power producers. However, the model is only optimizing the volume to be sold in the spot market, and are not optimizing the amount of power to be sold in the reserve markets as well. As selling power in these markets generates income to producers in the same order as the day-ahead market, a higher combined revenue may be received when participating in several markets. Therefore, finding the volumes in the balancing markets which makes the highest total revenue from both the day-ahead market and the balancing markets is vital for the producers.
1.2. PROBLEM FORMULATION CHAPTER 1. INTRODUCTION
In SHOP, it is possible to allocate a specified amount of capacity to each of the different balanc-ing markets, and then optimize the volume of energy sold in the spot market. By specifybalanc-ing an amount of capacity for the balancing markets, this capacity will then be unavailable in the spot market. Consequently, there are opportunity costs related to participating in the balancing mar-kets, since the capacity held off for these markets could have been used to generate income in the spot market. As the opportunity costs of reserving capacity in the reserve markets decide the price of which the producer is willing to deliver balancing services at, finding these opportunity costs are essential when planning in several markets.
When making commitments in the balancing markets, the producer has to set her production plans in order to meet these obligations. "Water behind capacity" is a term that describes a specific challenge for hydro power producers who provides ancillary services to the power sys-tem through the balancing markets. When reserving capacity in these markets, the hydro power producer has to be sure that the reserved capacity can be activated without violating techni-cal, hydrological or environmental constraints. Current decision support tools like SHOP, which provides optimal production plans for Nordic power producers, does not ensure that all con-straints are held when reserves are activated in real-time. Hence, an important challenge is to verify the production plan so that the head dependent power output always can be adjusted in order to meet the commitments made in these markets. Therefore, the main objective in this thesis has been to address the limitations in the existing models, and to develop a methodol-ogy specifically to determine the amounts of reserves which can be delivered without violating any relevant constraints. This has been done using SHOP, with its newly developed simulation functionality. The second objective in this work has been to validate the methodology on illus-trative and realistic case studies. Finally, the results have been further analysed in order to find strategies when planning in several markets.
1.3. LITERATURE SURVEY CHAPTER 1. INTRODUCTION
1.3 Literature Survey
Several studies have been carried out for finding optimal strategies in both the day-ahead mar-ket and the balancing marmar-kets, using both deterministic and stochastic models. This thesis is based on the deterministic model which optimizes the profits in the day-ahead market de-scribed in [6]. Finding optimal strategies in the day-ahead market have also been done using stochastic optimization in [7], [8], and [9]. However, these studies do not include the balanc-ing markets. In [10], [11] and [12] the opportunity costs of participating in the reserve energy market have been found, which make the basis of the bids in both the up regulating and down regulating markets. These studies use a similar approach for finding the opportunity costs as the approach presented in this project. Furthermore, [13] and [14] use a stochastic model to optimize the total revenues from both the day-ahead market and the reserve energy market. However, the change in water availability when reserves are activated are not included in any of these studies, neither is ramping constraints. These challenges are addressed in [15], and in [16] a stochastic model has been used to optimize the total revenue when participating in several markets, including the possibility of running out of water when reserves are activated.
Except of [13], all of these studies have only analysed the reserve energy market. In this market, the commitment is set for the next hour, and the volume can vary in each hour. Additionally, the power producer can decide which hours to bid in, as opposed to the regulating power option market where the commitments are made for all the hours during the day for a whole week. Hence, the power producer has a lower risk of running out of water when participating in the reserve energy market rather than the regulating power option market. Additionally, reserves can be delivered in both directions in the reserve energy market, which also lowers the risk of emptying the reservoir.
As stated earlier, the main objective in this work has been to address the problems regarding water availability and other hydrological constraints when activating reserves, and develop a methodology to find the amounts of reserves which can be delivered without violating these constraints. In order to avoid distortion from uncertainty and give clear and intuitive results, the methodology has been developed using deterministic optimization.
1.3. LITERATURE SURVEY CHAPTER 1. INTRODUCTION
Finally, the thesis is partially based on the specialization project carried out by the author as part of the Master of Science degree, and repeats some of the theoretical concepts used the previous thesis. In the specialization project, the opportunity costs of withholding generation capacity for different types of reserves were found without considering activation.
Chapter 2
Theoretical concepts
This chapter will present some of the main concepts and market mechanisms of which the thesis is based on.
2.1 The Frequency in a Power System
In an electrical power system, it is required that the amount of produced and consumed electri-cal power is equal. Excess or lack of power in the system may result in unstable operations and undesired values of the voltages in the system[3]. For this reason, it is important that there is a balance between power production and consumption at all times. To mirror the state of the sys-tem, the system’s electrical frequency is used as an indicator of whether the system is in balance or not. When the produced power equals the consumed power, no excess power is stored in the motors or generators in the system, resulting in a constant rotational speed. However, if there is a mismatch between electrical production and consumption, the difference in electrical power will be compensated through a change in the mechanical rotating energy. This change acceler-ates the generators and motors in the system, making them rotate at a different speed. Since the system frequency is dependent on the rotating speed of the generators, a change in the rotating speed will change the system frequency. On this basis, the system frequency is a measure of the power balance in the electrical system. From [17],the relation between the electrical frequency
fse and the rotor speednm for a single synchronous generator withPnumber of poles is given
in equation (2.1).
fse=nmP
120 (2.1)
2.2. THE POWER MARKETS CHAPTER 2. THEORETICAL CONCEPTS
TSO to make sure that the production and consumption of electrical power are the same at all times. To be able to do this, accurate forecasts of the power consumption are needed, and the consumption then has to be matched with the planned power generation. An efficient way to handle this is through a power market.
2.2 The Power Markets
In a power market with high liquidity, most of the power consumed is bought in the market. In the same matter, most of the power generated is sold in the market. The intention is that a balance in the market will lead to a physical balance in the power system. Thus, the participants in the market are planning their electrical power consumption and production based on their position in the market.
Elspot and Elbas
The spot market, also called Elspot or the day-ahead market is the main market for trading phys-ical power. This is the market which makes the basis of the planned future power production and consumption[1]. The market is cleared for every hour for the next day, meaning that the market participants are trading power for every hour for the next day. Thus, the market partic-ipants will know the day ahead the price and volume of their power production and consump-tion for each hour of the next day. The producers are preparing bids of how much power they want to sell, and at what price. This gives the supply curve for each individual producer. All the selling bids are accumulated to one curve, giving the supply curve for the system[18]. The same goes for the consumers, which are preparing bids of how much power they want to buy to cover their needs, and at what price. As for the selling bids, the buying bids gives the relation between consumption and price, and are accumulated to the demand curve. The intersection point of these two curves gives the system price and volume. Given the system price, all the consumers and producers get an obligation to produce or consume a volume of power based on their bids. In this way, the produced and consumed power for every hour for the next day is planned in balance. Figure2.1gives a graphical view of the intersection of the supply and demand curves.
2.2. THE POWER MARKETS CHAPTER 2. THEORETICAL CONCEPTS
Figure 2.1: Supply and demand intersection point, taken from NordPoolSpot [1].
After the Elspot market is closed, the participants may not be able to deliver the committed vol-ume or need a higher volvol-ume for consumption, due to reasons as unforeseen events, outages, unexpected weather conditions among others. Through the Elbas market, the market players get the opportunity to trade volumes after the Elspot market is closed. Thus, imbalances be-tween the planned volume traded the day-ahead in the Elspot market, and the actual volume consumed or produced real-time can be corrected. This market opens after the Elspot market is cleared, and trades can be made up to one hour before real time. Hence, the Elbas market is often referred to as the intra-day market.
2.3. BALANCING MARKETS CHAPTER 2. THEORETICAL CONCEPTS
2.3 Balancing Markets
The need of reserves
Although the major part of balancing production and consumption is handled through the Elspot and Elbas markets, deviations still occur. Because these markets have a time resolution of one hour, production and consumption would have to be constant within a given hour to keep the system balance. In practice, this is not possible. The power consumption is varying continuously depending on the consumers’ use of electricity. For power generation, the pro-duction from thermal- and hydropower can be set relatively constant. However, the power gen-eration from renewable sources as solar and wind power depends on the intensity of wind and solar radiation. These intensities are varying within the hour, and forecasting these variations accurately is hard. In addition, the loss off major components such as generators and trans-mission lines results in deviations from the planned production and consumption[18]. These are all factors which may lead to system imbalance within the operation hour. To handle these imbalances, balancing services are needed to correct the mismatches.
For the Norwegian power system, there are three types of reserves: primary reserves, secondary reserves and tertiary reserves. Both the primary and the secondary reserves consist of capacity reserved from operating generators, and can therefore be activated quickly. This types of re-serves are referred to as spinning rere-serves. The activation is done automatically, in contrast to tertiary reserves which are activated manually. In addition, the tertiary reserves do not have to be spinning, which results in a longer activation time[19].
When an imbalance takes place, the primary reserves will be activated instantly to correct the mismatch in power. To be able to handle new imbalances, the secondary reserve is activated in order to release the activated primary reserve. In the same manner, the tertiary reserve is activated in order to release the activated secondary reserve. Figure2.2gives an illustration of the power system’s restoration scheme.
2.3. BALANCING MARKETS CHAPTER 2. THEORETICAL CONCEPTS
Figure 2.2: Reserves activation scheme, modified from Statnett [2].
Primary reserves
When an imbalance between production and consumption first happens, the synchronous fre-quency will change. To restore the imbalance, the primary reserves are firstly activated. These reserves consist of units already operating, so the response time is very short. The speed gover-nor1of a generating unit senses the change in system frequency, and automatically changes the mechanical power input to the turbine through the main valve[3]. Hence, the electrical power output from the generator is adjusted to correct the system imbalance. Figure2.3illustrates a block-diagram of the control system related to the primary reserves. How much the speed gover-nor should react to a disturbance is dependent on the droop setting2of the speed governor[20]. A high droop setting means that the output power is changed less for a given frequency devia-tion. Hence, the delivery of primary reserves for a certain deviation in frequency, for one specific generator, is set by the droop setting. In this way, all the generators participating in the primary reserves’ market are contributing to restoring the system balance. For normal operation, the frequency band is set to 0.1 Hz, meaning the capacity reserved in the market is based on a
dis-1"The function of the speed governor is to monitor continuously the turbine-generator speed and to control
the gate position which adjust flow into the turbine in response to changes in system frequency" [3]
2The droop setting of a generator gives the relation between the change in output power from the generator
2.3. BALANCING MARKETS CHAPTER 2. THEORETICAL CONCEPTS
turbance of 0.1 Hz. This capacity has to be available for both up and down regulation[21]. There is also a market for larger disturbances, but this will not be covered in this thesis. The market players get paid for the capacity reserved per hour. Extra energy delivered is also being compen-sated for. Reservation of capacity can both be made through the weekly or the daily market.
Figure 2.3: Primary reserves’ control system, taken from Bevrani [3].
Secondary reserves
If the imbalance lasts for more than a few minutes, the secondary reserves are activated, releas-ing the primary reserves for new imbalances. The activation is done through the TSO’s control system, adjusting the set points of the regulating generators. Hence, a direct connection be-tween the TSO’s control system and the regulating generators’ control systems are necessary[18]. As with the primary reserves, the secondary reserves have to be spinning in order to be able to react quickly, and they are also activated automatically through the control system. The volume of reserved capacity is the amount of adjustments in the set points available for the TSO, and in contrast to the primary reserve markets, the capacity is either reserved for up or down regula-tion. The market players get paid for the capacity reserved for each hour, and the procurement is done through a weekly market. Extra energy delivered is also being compensated for. Which hours the weekly procurement is done for is varying, but the hours during the mornings and evenings are the most common[22]. This is the time of the day when the power production and consumption are the most variable, and the need for reserves is higher.
2.3. BALANCING MARKETS CHAPTER 2. THEORETICAL CONCEPTS
Tertiary reserves
If the imbalance still remains after the primary and secondary reserves have been activated for 15 minutes, the tertiary reserves are activated. Since the primary and secondary reserves are responding before the tertiary reserves, the response of the tertiary reserves do not have to be as fast as for the other types of reserves. Therefore, the tertiary reserves do not have to be spinning. The activation is done manually by the TSO, also in contrast to the other types of reserves which are activated automatically through the control systems.
The market participants place bids for letting the TSO change their planned production for given hours with the volume of the bids. Thus, the tertiary market is in fact an energy market, as the participants get paid for the extra energy produced per hour. Bids can be placed for both up and down regulation, and can be sent to the TSO up to 45 minutes before real-time. In Nor-way, this market is referred to as the reserve energy market, RK. Each of the market participants place their bids based on available volumes and costs, and the TSO activates the bids needed to regulate the power system according to merit order. Hence, the cheapest reserves are activated first, unless there are transmission bottlenecks between the area where the reserves are needed and the areas with the cheapest reserves. If there is insufficient transmission capacity, bids with higher prices are activated instead, in areas where there are sufficient transmission capacity to deliver the reserves to the areas where the reserves are needed [18].
Capacity can also be reserved in the tertiary market through the regulating power option mar-ket, RKOM. This market helps supply the system operator with sufficient capacity in the reserve energy market, and is at the time being mostly active during the high load winter season. How-ever, the need for reserve capacity is expected increase in an integrated European power market with a higher share of intermittent renewable energy[12]. When reserving capacity in the RKOM market, the participants are obligated to place bids in the RK market at least the size of the re-served volume for all the respective hours. The market players gain a premium for reserving capacity in the RKOM market per hour. The procurement is done both through a weekly and a seasonal market. When reserving capacity in the weekly RKOM market, the capacity has to be available every day between 06.00 to 00.00 for the whole week [23]. At the time being, only
2.3. BALANCING MARKETS CHAPTER 2. THEORETICAL CONCEPTS
reservation of capacity for up regulation can be made in the Norwegian RKOM market[23].
If a power producer has reserved more capacity than she can deliver based on the available water resources, actions has to be made in order to hold the balancing commitments made in the markets. First of all, when reserving capacity in the RKOM market, the participants are obligated to place bids in the RK market for every hour at least the size of the volume reserved in the RKOM market. It is through the RK market the capacity reserved in the RKOM market is activated, and the activation is done based on the merit order. The marginal costs of activating reserves from hydro systems, and thus the prices of the bids in the market, are dependent on the available water in the systems’ reservoirs, or the filling ratio. If less water is available, the marginal cost of activation increases. As does the price of the bids in the RK market, and the reserves from the system are less likely to be activated, if other systems have lower marginal costs of activation. Therefore, if there are more available water at other hydro systems which deliver reserves, water unavailability may be avoided when the bid prices increase.
However, as both the energy produced in the spot market and in the RK market is produced from the hydro systems with the lowest marginal costs, and the marginal cost from a system is based on the water level in its reservoirs, it is likely that the reservoirs in different hydro systems some-what have the same filling ratio. If a system’s reservoirs have a higher filling ratio, the marginal cost of producing energy from this hydro system is lower. Due to the merit order, the hydro system will probably produce more energy than other systems with higher marginal costs, until the marginal costs at all the systems are equal. Therefore, if the marginal cost of activation is high at one hydro system, it is likely that the marginal costs of activation are high at other sys-tems also. Hence, the chance of activation does not necessarily decrease as the marginal cost of activation increases, and there is still a chance of water unavailability. Additionally, the market participants are not allowed to price the obligated bids in the RK market high in order to avoid activation, when capacity is reserved in the RKOM market.
When capacity is reserved in the weekly RKOM market, a production plan for the whole week is typically made, and the obligations in the RKOM market are set. However, the obligation in
2.3. BALANCING MARKETS CHAPTER 2. THEORETICAL CONCEPTS
spot market, which are made when planning the RKOM commitments, can be seen as a strat-egy in the spot market the power producers try to follow in order to hold the reserves commit-ments. Hence, the weekly production plan in the spot market is not a committed production plan. Therefore, if there is a chance of water unavailability due to activation of reserves, less energy can be sold in the spot market than planned, in order to save more water for later ac-tivations. However, this restriction may force the producers to generate less energy in the spot market when the prices are high. Hence, too high commitments in the RKOM market may re-sult in a lower total income. For these reasons, it is of much interest for the power producers to verify the amounts of reserves which can be delivered when making commitments in the RKOM market.
2.4. PLANNING HIERARCHY AND MODELS CHAPTER 2. THEORETICAL CONCEPTS
2.4 Planning Hierarchy and Models
As stated earlier, the main objective for a hydro power producer is to utilize the water in a way that maximizes her total profits. In order to do so, a production plan for the day-ahead has to be made, stating how much power that is to be produced in every hour for the next day. However, deciding the power production in a given hour is a very complex problem. On the one hand, producing power generates income by selling electricity. On the other hand, by not producing power, the water is available for power production in the future when the price may be higher. By calculating the value of storing water in the reservoir, a basis of deciding the production in a given hour can be made. However, since this value depends on many factors, with a long time horizon and much uncertainty, this calculation is not straightforward. To be able to solve the problem, the process has to be divided in different stages with different levels of detail, uncer-tainty and time resolution. The different stages are shown in figure2.4.
2.4. PLANNING HIERARCHY AND MODELS CHAPTER 2. THEORETICAL CONCEPTS
Long term scheduling
Because some of the largest reservoirs may take years to fill up once empty, short term decisions may have an impact several years ahead. It is therefore necessary to have a long term strategy based on load, market prices and inflow. These are all stochastic variables, and a long time hori-zon means more uncertainty. In addition, the modeled hydro system often consists of several hydraulically coupled reservoirs, where the water level in one of the reservoirs is dependent on the use of water in the other reservoirs. To be able to solve these models, taking the uncertainty into account, a significant aggregation of the hydro system has to be made. All the reservoirs and power stations in the system are aggregated into one reservoir and one power station, to be able to compute the expected value of having water stored in the aggregated reservoir. This expected value is known as the water value, and is describing the long term strategy[4].
Seasonal scheduling
The main objective of the seasonal scheduling is to make a coupling between the long and short term scheduling. As the long term scheduling has to account for a lot of uncertainty, the level of detail has to be limited in order to be able to solve the model. However, in order do make short term decisions on whether to produce or not, the specific water values for each reservoir have to be known. These values are found in the seasonal scheduling, where the aggregated water values from the long term scheduling are used as input, and the individual water values for every reservoir are being calculated. Since the time horizon for the seasonal scheduling is shorter than for the long term scheduling, a more simplified description of the uncertainty can be made, making it possible to have a more detailed description of the hydro system topology. Besides, the seasonal scheduling models should have similar topology descriptions as the short term models in order to obtain proper boundary conditions for the short term scheduling[11].
2.4. PLANNING HIERARCHY AND MODELS CHAPTER 2. THEORETICAL CONCEPTS
Short term scheduling
In the short term scheduling, the actual hydro power production plan for the next hours and days is established. As the level of detail is very high when finding the optimal production plan, the time horizon and the level of uncertainty has to be limited in order to be able to solve the problem efficiently.
For the power producers to be able to know how much energy to sell in the power markets, the price of electricity has to be compared with the water value. Additionally, if reserves are to be delivered, this makes a great impact on the profit in the spot market. This is because less capacity is available for producing energy in the spot market when the capacity is reserved for balancing services. Besides, the generating units may have to be started mored frequently in order to deliver reserves, which results in higher start up costs. Hence, it may be profitable to produce energy for a few hours at low prices, instead of stopping and starting the generators. As the power production has to be planned for every hour of the day, planning the short term power production is a challenging task.
As already mentioned, SINTEF Energy Research has developed the short term optimization model SHOP to support power producers in preparing bids in the power market and estab-lishing optimal production plans[24]. It is based on deterministic optimization, meaning that the input values are given as one scenario, without uncertainty. This is a simplification made in order to solve the problem more efficiently. Since the uncertainties in the price and inflow predictions are moderate in the short term horizon, the deterministic model is reasonable in spite of this simplification. Besides, scenario analysis can be carried out in order to determine the solution space for a longer time horizon[4].
Because the amount of energy which can be produced from a given amount of water is de-pendent on a large amount of physical factors, a very detailed description of the hydro system is needed in order to find the optimal production plan[11]. These factors consist of non-linearities such as turbine and generator efficiency curves and head losses, in addition to state dependen-cies, environmental constraints and more. Solving problems with state- or non-linear
depen-2.4. PLANNING HIERARCHY AND MODELS CHAPTER 2. THEORETICAL CONCEPTS
dencies are difficult in terms of computation time for practical sized models[6]. Hence, for the model to be able to take into account all of the relevant physical factors and constraints when establishing the optimal production plan in the day-ahead market, successive linear program-ming is used to solve the problem efficiently. Hence, non-linearities are represented using step-wise linear curves. Additionally, the model uses the water values from the long and seasonal scheduling in order to determine the costs on the use of resources, and hence the amount of water stored in the reservoirs at the end of the period[25].
A simplified model describing some of the main concepts and complexities related to deter-ministic short term optimization models of hydro power production, including SHOP, has been made for this thesis in equations (2.2) - (2.2). It is partly based on the area optimization model presented in Doorman [4], in addition to Fosso and Belnes [6]. In this model, only one reservoir and generator are included, and the model is not considering all the physical relations which are accounted for in a more detailed model like SHOP.
max X n∈N pn·En+α·V|N|−cst ar t·βst ar tn (2.2) s.t En=ρ·g·(Hn−Hnl oss)·ηt ur bi nen ·η g ener at or n ·QnD, n∈N (2.3) Vn=Vn−1+QnI −QDn−QnE n∈N (2.4) |QDn −Qn−1D | ≤Rmax (2.5) Vmi n≤Vn≤Vmax n∈N (2.6) En≤βr unn ·Emax (2.7) βr un n ·Emi n≤En≤Emax n∈N (2.8) βr un n −βr unn−1≤βnst ar t (2.9) βr un n ·QD,mi n≤QDn ≤DD,max n∈N (2.10)
2.4. PLANNING HIERARCHY AND MODELS CHAPTER 2. THEORETICAL CONCEPTS
QE,mi n≤QnE n∈N (2.11)
Emax−En≥Bn n∈N (2.12)
A summary of the notation used is given below:
N number of hours in the planning period
pn spot price in hourn
En produced energy in hourn
α water value, which is dependent on the reservoir levelV|N|at the end of the period Vn reservoir level in hourn
cst ar t start up cost βst ar t
n decision variable if the plant is starting or not in hourn
βr un
n decision variable if the plant is running or not in hourn
ρ density of water
g gravitational acceleration
Hn plant head in hourn, dependent onVn
Hnl oss head loss in hourn, which is dependent on the dischargeQDn
ηt ur bi ne
n turbine efficiency in hourn, which is dependent on the dischargeQDn
ηg ener at orn generator efficiency in hourn, which is dependent on the produced energyEn QDn discharge to turbine in hourn
QD,mi n min discharge to the turbine
QD,max max discharge to the turbine
QIn inflow to the reservoir in hourn QEn environmental bypass in hourn QE,mi n min environmental bypass
2.4. PLANNING HIERARCHY AND MODELS CHAPTER 2. THEORETICAL CONCEPTS
Emax max generation capacity
Rmax max ramping
Bn reserve requirement in hourn
The objective function given in equation (2.2) is to maximize the income from power generated and the value of the water left in the reservoir, less the start-up costs. Restriction (2.3) couples the turbine discharge to the energy output, and the restrictions (2.5) and (2.10) set the limits for the turbine discharge and ramping. A binary variable is set to one if the generator is run-ning in restriction (2.7). Equation (2.4) handles the reservoir balance, and (2.11) sets the lower limit for environmental bypass. The restrictions (2.6) constrains the reservoir levels, and (2.8) covers the upper and lower generation capacity limits if the unit is running. When reserves is delivered from the generators, the upper and lower generation capacity is constrained by restric-tion (2.12). Note that only non-spinning reserves are included in the model. Additionally, the start up costs are added to the objective function using a binary variable when the generators are started in restriction (2.9). In a complete model, the dependencies of the variablesHnl oss, ηt ur bi ne
n ,η
g ener at or
2.4. PLANNING HIERARCHY AND MODELS CHAPTER 2. THEORETICAL CONCEPTS
Simulation
Even though the optimal solution has been found in the short term scheduling, it is not certain that the solution is in fact feasible. Even as a high level of detail has been used, the solution may not be within the acceptable limits. This is because the optimization model searches for the best decision in all of the time steps, based on the decisions in all of the other time steps. In order to do this efficiently, the optimization model uses successive linear programming where the non-linear dependencies are estimated using step-vice linear functions, which may not be precise. Furthermore, the optimization model focuses on finding the optimal decisions on the amount of power to be produced, but it may not find the corresponding water consumption and the hydro systems’ reservoir levels in all of the time steps precisely. However, when all of the decisions have been made, accurate calculations of all the physical relations based on the decisions can be made, and the solution found in the optimization model can be verified. This can be done with a simulation model, where the true non-linear functions can be used in the calculations. Additionally, the decisions made by the optimization model can easily be modified and re-verified by the user in the simulation model[4].
In order to be able to verify and modify the solution found in SHOP, SINTEF Energy research has developed a simulation functionality for the model. The purpose of this functionality is "to return the physical response of the system given all user-controllable decisions as input"[26]. Hence, the SHOP simulator takes all the decisions made by SHOP as input, and finds if any of the decisions lead to situations that are physically infeasible. As this functionality was imple-mented very recently, there are very few references available which describes the mathematical modeling of the simulation functionality in SHOP.
Chapter 3
Methodology
This chapter will present how the analysis has been carried out, and includes the assumptions and simplifications that are made. Also, the hydro systems used in the case studies are pre-sented.
3.1 Analysis Approach
When a power producer reserves capacity in the primary or secondary reserves’ markets, the re-served capacity is usually activated for only a few minutes at a time. Consequently, the change in the plant discharge in order to regulate the power output is not present for a long enough period of time to significantly change the plants’ reservoir level. Additionally, the reserved capacity is available for both up and down regulation, and the expected mean values of regulation in both directions are equal. Hence, water unavailability is usually not a problem when the reserved capacity are needed for activation. However, constraints regarding ramping or flow can still be violated during a short lasting activation.
In the tertiary reserves’ markets, the reserved capacity is activated for a longer period of time. Of-ten, the reserved capacity is activated for several hours at a time. Additionally, if the capacity re-served in the markets is only used for regulation in one direction, the change in plant discharge could be present long enough to significantly change the reservoir levels from the original plans. Hence, high amounts of reserved capacity from hydro systems with small reservoirs could lead to water unavailability in periods when the power system needs more regulation. Additionally, the ramping and flow constraints are present to the same extent as with the other balancing markets. Therefore, the methodology presented covers all the different balancing markets,
al-3.1. ANALYSIS APPROACH CHAPTER 3. METHODOLOGY
though the methodology is only applied on case studies regarding the regulating power option market in this thesis.
In order to easily address the limitations in the existing models, the very same models have been used in the methodology. Therefore, the methodology is based on SHOP, with its newly devel-oped simulation functionality. In order to obtain adequate decisions in the balancing markets, the usage of the model functionalities have been modified in innovative ways to verify suffi-cient water availability and feasible decisions in the balancing markets. The methodology both utilizes the optimization functionality in SHOP, as well as the simulation functionality in verify-ing the production plans obtained. Furthermore, the analysis has been carried out with a price taking hydro power producer’s point of view, both in the spot market and the RK market. Ad-ditionally, the balancing products that are assessed correspond to the current definitions set by the Norwegian TSO.
3.1. ANALYSIS APPROACH CHAPTER 3. METHODOLOGY
Step One: Finding the Expected Amount of Time With Activation
The first step in the methodology is to find the expected number of hours the power system needs up regulation. In order to do this, available historical data of the Nordic power system is collected, and the number of hours with up regulation is counted for every week in the available data. Based on this count, the mean value and standard deviation of the number of hours with up regulation within a week is found. When the mean value and standard deviation is found, a normal distribution is assumed in order to find the probability of a given number of hours with up regulation within a week. Even though the number of hours with activation is not normally distributed in reality, this assumption is made in order to generate illustrative and intuitive re-sults. With the normal distribution, different risk levels are set for the maximum number of hours’ regulation is needed. Using the risk levels, from now on denotedr, the number of hours corresponding to the probability of having a higher number of hours with activation is found using the normal distribution. This is illustrated in figure3.1below.
Figure 3.1: Illustration of risk level
Furthermore, it is unlikely that the reserved capacity from a certain hydro system is activated every time the power system is in unbalance. This is because there is usually more reserved power than what is needed, and the cheapest hydro systems to activate are used by the TSO. As the price of the bids in the RK market are dependent on many factors, for instance water val-ues, production plans and reservoir levels, it is variable which hydro systems are the cheapest. Therefore, different rates of how often the reserved capacity from a hydro system contributes to
3.1. ANALYSIS APPROACH CHAPTER 3. METHODOLOGY
up regulation when the power system is in unbalance are used in the analysis. For each of these rates, from now on denotedn, the maximum number of hours’ which up regulation is needed, for different risk levelsr, is found. Furthermore, the rate of activation is very dependent on the marginal cost of activating reserves from a hydro system, as more capacity is typically activated from systems with lower costs. The rate of activation is also depending on the transmission ca-pacity in the area the hydro system is located in, as the reserved caca-pacity is not activated if there is a grid bottleneck between the hydro system and the area where the reserves are needed. As it is hard to estimate the rate of activation without statistical data on how often a specific plant is activated, the analysis has been carried out using two different rates, 50% and 100%. Even as these values are probably too high, the analysis would be carried out in the same way using the real rates of activation. Besides, the limitations regarding water unavailability are addressed more clearly using higher rates.
In this work, a simplification has also been made so that the reserved capacity is only activated in the same price zone as the hydro system is located in. In reality, the reserves can also be used in other price zones, when there is sufficient transmission capacity between the zones. If there are bottlenecks in the grid, more expensive reserves could be activated by the TSO in order to supply the reserves where it is needed. As this may result in some areas being more favorable than others for delivering reserves, the rate of activation n may be different based on transmission capacity. To overcome this problem, power system data from only one price zone is used in the analysis, and the same rates of activation are used for all the hydro systems analysed. If the transmission capacity where to be included, the data would be collected from the entire Nordic power system, and different rates of activation would have to be estimated.
As the amount of activated reserves which is needed in two areas are dependent on each other, and a normal distribution requires independent stochastic variables, the data has to be either collected from only one zone or from the entire power system. Therefore, data from the same price zone has been used on all the hydro systems analysed, although the hydro systems are in reality located in different price zones. This is in order to compare the costs of delivering reserves from hydro systems with different features in terms of system characteristics, not from
3.1. ANALYSIS APPROACH CHAPTER 3. METHODOLOGY
Step Two: Finding the Maximum Amount of Delivered Reserves
The next step in the methodology is to find the maximum amount of reserves which can be delivered for a given number of hours with activation during the planning period. This is done for various amounts of reserved capacity, up to the point where more reserved capacity would lower the total production in the spot market significantly, and change the water availability.
When only participating in the day-ahead market, the reservoirs’ flexibility is often maximally utilized, and the reservoirs may be emptied during the planning period before a large inflow or when the prices are high. Thus, there are no water available for activating reserves at this time. Additionally, the time of activation is unknown during operation, so it is not known when the extra water is needed. Besides, time delays in the water ways could make it hard to route extra water from one reservoir in the hydro system to another. In order to have water available for activating reserves, various constraints on water levels are therefore added. On the one side, a restriction on the water level limits the flexibility in the spot market, increasing the total op-portunity costs. On the other side, a constrained water level makes more water available for activating reserves, and more reserves can be delivered. Thus, the total opportunity costs of de-livering reserves are divided by a higher amount of capacity when finding the cost per MW of delivering reserves. In order to study this balance, various restrictions on the water levels in the reservoirs have been included in the analysis, and the volumes and costs of delivering reserves have been found for each amount of available water.
If a hydro system contains ramping restrictions, the system may not be able to activate all of the capacity which is reserved from the hydro system’s generators without violating the ramping constraints. Additionally, the system may not be able to activate all the reserved capacity in all of the given hours, if the system’s reservoirs are emptied while producing the extra amount of energy. The first step in finding the maximum amount of capacity which can be delivered for a given number of hours with activation, is to withhold a certain amount of capacity from the hydro system’s generators in SHOP. If there are several generators in the hydro system, the reserved capacity is distributed over the different generators at the lowest total costs in SHOP. In order to do this, the sum of all the reserved capacity from each generator in the hydro system is
3.1. ANALYSIS APPROACH CHAPTER 3. METHODOLOGY
set equal to the total amount of withheld capacity, and the optimal production plan in the spot market is then found in SHOP.
After the reserved capacity is distributed, the amount of capacity which actually can be acti-vated for the given number of hours is found, using the same production plan. First, a very small amount of capacity is activated. If there are several generators in the hydro system, a load is added in the given hours the size of the amount of activated reserves greater than the original production. In this way, SHOP optimizes how the activated capacity should be distributed over the different generators in order to avoid penalties in the objective function. As violating con-straints results in large penalties, SHOP tries to distribute the activation in every possible way in order to not violate any constraints. Hence, if a constraint is violated, there are no other possible way to activate the given amount of capacity without violating the constraint.
After the activation is distributed using SHOP, the solution is verified using the SHOP simulator. In the verification, accurate calculations are done using the simulation functionality in order to check if the solution empties the reservoir or violates the other constraints regarding ramping or flow. If the solution does not violate any of these constraints, the process is repeated with a larger amount of activated capacity until any of the constraints are violated. When the capac-ity is increased up to the point where a constraint is violated, the previous amount of capaccapac-ity which did not violate the constraints represents the maximum amount of capacity which can be delivered for the given number of hours. This is done for every expected number of hours with activation, in order to obtain the relation between maximum activated capacity and the number of hours with activation. As stated earlier, the relation is found for different amounts of reserved capacity, and the hours with activation within the planning period is picked randomly. A flow chart illustrating the whole process is given in figure3.2.
Additionally, applying different strategies for the distribution of the reserved capacity over the hydro system’s generators has been investigated. For a simple hydro system with only one plant, all the capacity has to be reserved from this plant, and there is no need for distributing the reserves over other plants. If the system consists of several plants, the capacity is distributed
3.1. ANALYSIS APPROACH CHAPTER 3. METHODOLOGY
between each of the plants’ share of the total capacity. In doing this, the effect of having more water available in certain parts of the hydro system has been studied. The costs and amounts of reserves which can be delivered have then been compared for the different strategies.
3.1. ANALYSIS APPROACH CHAPTER 3. METHODOLOGY
Step three: Finding the Costs of Delivering Reserves
When combining the results from the first and the second step, the maximum amount of ca-pacity which can be delivered in a week at given risk levels of violating the constraints is found in the final step. Additionally, given the maximum amount of capacity which can be delivered, the costs of delivering various amounts of capacity up to this level have been found. In order to do this, SHOP is firstly run without allocating any capacity to the RKOM market. This is in order to create a base case for the opportunity cost of participating in the balancing market. The objective function from SHOP gives the total revenue from the spot market and the value of the stored water in the reservoirs. When running SHOP with the reserve requirements, the in-come from the balancing markets are not included. Thus, when the objective function from the production plan which includes reserves is being compared with the objective function from the base-case, the total opportunity costs of delivering the given amount of reserves are found. For finding the cost of delivering the reserves per hour per MW, the total opportunity costs are divided by the number of hours the capacity is reserved for, as well as the amount of capacity which is delivered.
The costs of activating the reserves are assumed to be fully reflected through the mandatory bids in the RK market when participating in the RKOM market. Thus, the income from the RK market compensates for the start up costs, the potentially lower efficiency and the extra water which is being used when reserves are activated. Consequently, the costs of delivering capacity in the RKOM market are assumed to be solely based on the opportunity costs of having less available production capacity for the spot market.
3.2. CASE STUDY CHAPTER 3. METHODOLOGY
3.2 Case Study
In this project, two different reservoir topologies with corresponding data have been used. These descriptions are based on real hydro systems, where only small modifications have been made in order to obtain case studies which suits the analysis well. These modifications are made as moderate as possible, in order to maintain authentic system descriptions. The two hydro sys-tems are separated in terms of size, structure and complexity, and are located in two different regions in the Nordics. Even though the data of the two cases are collected from different re-gions, in two different years, the hydrological conditions and power demand is expected to be similar in both cases as they are both collected from the winter season. Hence, comparable market conditions are assumed. The zonal spot prices for the planning period in each of the cases are provided by the plant operator. These are presented using the historical spot prices from Nordpool[27], as the historical prices are public information. Since both cases are taking place during the winter, low temperatures contribute to a high demand for electricity. Besides, much of the precipitation falls as snow during the winter, resulting in a generally moderate in-flow. Hence, the spot prices are commonly higher during the winter. Since the prices and inflow are deterministic when carrying out the analysis, perfect information about future inflow and prices is assumed. The inflow and water values are also provided by the plant operator, and the planning period is set to one week, since it is the resolution of the weekly RKOM market.
The first hydro system analysed is the Kvistforsen system, which is located in price zone SE2 in Skellefteå in Sweeden. This system is owned and operated by Statkraft, who has provided the data and authorised the system description used in SHOP. The main motive for studying this system is to address and consider the effects and limitations of delivering reserves from a sys-tem with ramping constraints. Consequently, the reservoir in this syssys-tem contains a ramping constraint. The second hydro system analysed is part of the Røldal-Suldal system, which con-sists of the plants Kvanndal and Suldal 2, and is located in price zone NO2 in South-Western Norway. This system is owned and operated by Hydro Energy, who has provided the data and authorised the system description. This system does not contain ramping restrictions, but is a much more dynamic system than Kvistforsen. Hence, the main motive for studying this system
3.2. CASE STUDY CHAPTER 3. METHODOLOGY
is to investigate the possibility of water unavailability in different parts of a large cascaded sys-tem when participating in the balancing markets. Additionally, the effects of delivering reserves from several stations in the same hydro system have been compared with delivering reserves from only one station, with respect to the costs and amounts of reserves which can be delivered.
3.2. CASE STUDY CHAPTER 3. METHODOLOGY
Kvistforsen
The Kvistforsen hydro system, which is illustrated in figure 3.3, consists of one power plant where the plant has two identical generating units. Each of the generating units has a produc-tion capacity between 16 and 72 MW. With two units, the total generaproduc-tion capacity of the plant is therefore between 16 and 144 MW, excluding losses. There is only one reservoir connected to the plant, where the reservoir head is regulated between 50.5 and 52 meters, giving a difference between maximum and minimum head of 1.5 meters. Maximum reservoir ramping is set to 5 cm per hour for this study. With maximum plant discharge and no inflow, the reservoir can be emptied from maximum level in about 10 hours. This means that the energy production in a week is very dependent on the inflow.
3.2. CASE STUDY CHAPTER 3. METHODOLOGY
Additionally, the volume of the reservoir has been increased from the real system description up to 12 millionm3, in order to have a larger amount of water available for activating reserves. As the reservoir in the real system description is much smaller, water unavailability is in reality an even greater limitation when delivering reserves from the Kvistforsen hydro system than ad-dressed in this thesis. The reason for the increase is to obtain a wider spread in the amounts of delivered reserves, which can be obtained when the maximum amount of reserves delivered is increased. When the amounts of verified reserves have a wider spread, the factors which affect the costs of delivering reserves are easier addressed.
As the plant generators have a wide operating range, the units are able to reserve a great amount of capacity in the RKOM market. However, both water availability and the ramping restriction greatly limit the amount of reserves which can be activated. Therefore, capacity from 20 to 40 MW, using a step of 5 MW has been reserved from the generators, and the amount of capacity which can be delivered at certain risk levels with the corresponding costs have been found. Fur-thermore, the planning period used for the Kvistforsen case takes place in the end of February, from the 21th to the 28th, 2016. The historical spot prices in SE2 are given in3.4. The spot prices in the planning period are typical for the winter season, with a low inflow, and a steady price with some variations within a day. In two of the days, the price is substantially higher. This may be caused by a low temperature in these days, resulting in a higher demand of power used for heating.
3.2. CASE STUDY CHAPTER 3. METHODOLOGY
As water unavailability is a possibility when delivering reserves from Kvistforsen, the analysis has been carried out setting different restrictions on minimum reservoir levels in the produc-tion plans. Based on these minimum levels, different amounts of water are available for activat-ing more reserves at different costs. Additionally, the maximum rampactivat-ing restriction limits the amount of capacity which can be activated, and the analysis has been carried out while reserv-ing different amounts of capacity from the generators at Kvistforsen plant.
![Figure 2.1: Supply and demand intersection point, taken from NordPoolSpot [1].](https://thumb-us.123doks.com/thumbv2/123dok_us/10229102.2926783/23.918.250.664.110.427/figure-supply-demand-intersection-point-taken-nordpoolspot.webp)
![Figure 2.2: Reserves activation scheme, modified from Statnett [2].](https://thumb-us.123doks.com/thumbv2/123dok_us/10229102.2926783/25.918.274.669.144.469/figure-reserves-activation-scheme-modified-statnett.webp)
![Figure 2.3: Primary reserves’ control system, taken from Bevrani [3].](https://thumb-us.123doks.com/thumbv2/123dok_us/10229102.2926783/26.918.183.748.264.484/figure-primary-reserves-control-taken-bevrani.webp)
![Figure 2.4: Hydro power scheduling stages, taken from Doorman [4].](https://thumb-us.123doks.com/thumbv2/123dok_us/10229102.2926783/30.918.342.593.574.967/figure-hydro-power-scheduling-stages-taken-from-doorman.webp)