CENTER FOR MACHINE PERCEPTION CZECH TECHNICAL UNIVERSITY IN PRAGUE
MASTER’S
THESIS
Emotive Facial Expression
Detection
Petr Hus´ak
CTU–CMP–2017–01
January 9, 2017
Thesis Advisor: Jan ˇCech
The research was supported by CTU student grant SGS15/155/OHK3/2T/13.
Published by
Center for Machine Perception, Department of Cybernetics Faculty of Electrical Engineering, Czech Technical University
Czech Technical University in Prague Faculty of Electrical Engineering
Department of Cybernetics
DIPLOMA THESIS ASSIGNMENT
Student: Bc. Petr H u s á k
Study programme: Open Informatics
Specialisation: Computer Vision and Image Processing Title of Diploma Thesis: Emotive Facial Expression Detection
Guidelines:
1. Familiarize yourself with the literature on facial expressions in both:
a. Psychology, in order to understand types and mechanism of facial expressions. Concentrate on micro-expressions, fast facial expressions appearing involuntarily without a conscious control of a subject.
b. Computer vision literature, in order to get familiar with various approaches to facial expressions detection/recognition developed in recent years.
2. Collect an annotated dataset for training and testing. (Download published datasets or prepare your own datasets by labeling movies, or other TV content, or acquire a dataset in a controlled laboratory experiment).
3. Propose an algorithm to detect non-neutral facial expressions, preferably the micro- expressions, from videos. Consider to classify instantaneous basic facial expressions types.
4. Evaluate the proposed algorithms and compare quantitatively on a dataset with the ground-truth annotation.
Bibliography/Sources:
[1] Paul Ekman, Wallace F. Friesen. Unmasking The Face: A Guide to Recognize Emotions from Facial Clues. Mallor Books, Los Altos, CA, 2003.
[2] A. Dhall, R. Goecke, S. Lucey and T. Gedeon. Collecting Large, Richly Annotated Facial-Expression Databases from Movies. IEEE MultiMedia 19 (2012) 34-41.
[3] X. Li, X. Hong, A. Moilanen, X. Huang, T. Pfister, G. Zhao and M. Pietikäinen. Reading Hidden Emotions: Spontaneous Micro-expression Spotting and Recognition, in arXiv 1511.00423, 2015. [4] Jan Čech, Vojtěch Franc, Michal Uřičář, Jiří Matas. Multi-view facial landmark detection by using a 3D shape model. Image and Vision Computing 47, pp. 60-70, March 2016.
Diploma Thesis Supervisor: Ing. Jan Čech, Ph.D.
Valid until: the end of the winter semester of academic year 2017/2018
L.S.
prof. Dr. Ing. Jan Kybic Head of Department
prof. Ing. Pavel Ripka, CSc. Dean
Acknowledgement
I would like to express my gratitude to my advisor Ing. Jan ˇCech, Ph.D. for his valuable advice, guidance and willingness during my study. Furthermore I would like to thank prof. Ing. Jiˇr´ı Matas, Ph.D. for his advice. My thanks also go to my family for their support.
Author statement
I declare that the presented work was developed independently and that I have listed all sources of information used within it in accordance with the methodical instructions for observing the ethical principles in the preparation of university thesis.
Prague, ... ... signature
Abstract
Facial expressions are important cues to observe human emotions. The thesis studies the in-voluntary type of facial expressions called micro-expressions. Micro-expressions are quick facial motions, appearing in high stake and stressful situations, typically when a subject tries to hide his or her emotions. Two attributes are present - fast duration and low intensity. A sim-ple detection method is proposed, which determines instants of micro-expressions in a video. The method is based on analyzing image intensity differences over a registered face sequence. The specific pattern is detected by an SVM classifier. The results are evaluated on standard micro-expression datasets SMIC and CASMEII. The proposed method outperformed the com-peting method in detection accuracy. Further, we collected a new real-world micro-expression dataset consisting mostly of poker game videos downloaded from YouTube. We achieved av-erage cross-validation AUC 0.88 for the SMIC, and 0.81 on the new challenging “in the Wild” database called MEVIEW.
Keywords: face, expressions, micro-expressions, emotions, computer vision, image pro-cessing, SVM
Abstrakt
V´yrazy v lidsk´e tv´aˇri jsou d˚uleˇzit´ym kl´ıˇcem k rozpozn´an´ı lidsk´ych emoc´ı. Tato pr´ace se zab´yv´a typem obliˇcejov´ych v´yraz˚u, kter´e vznikaj´ı spont´annˇe, bez vˇedom´ı ˇclovˇeka. Naz´yvaj´ı se mikro-v´yrazy a jsou typick´e svou rychlost´ı. Objevuj´ı se ve vyhrocen´ych a stresov´ych situac´ıch, kdy osoba je nucena sv´e emoce skr´yvat. Obvykl´e rysy mikro-v´yraz˚u jsou rychl´y pr˚ubˇeh a n´ızk´a in-tenzita zmˇeny. Navrhujeme metodu, kter´a detekuje mikro-v´yrazy ve videu. Metoda je zaloˇzena na anal´yze rozd´ılu intenzit v registrovan´em obrazu obliˇceje. Specifick´y vzor mikro-v´yrazu je detekov´an SVM klasifik´atorem. V´ysledky jsou vyhodnoceny na standardn´ıch datab´az´ıch (CASME2 a SMIC). Navrˇzen´a metoda je lepˇs´ı neˇz konkurenˇcn´ı metoda v detekci mikro-v´yraz˚u. D´ale jsme shrom´aˇzdili re´aln´e pˇr´ıklady, a to pˇredevˇs´ım z pokerov´ych turnaj˚u na YouTube. Dos´ahli jsme pr˚umˇern´e cross-validaˇcn´ı AUC 0,88 pro datab´azi SMIC a 0,81 pro naˇs´ı novou datab´azi MEVIEW.
Kl´ıˇcov´a slova:obliˇcej, v´yrazy, mikro-v´yrazy, emoce, poˇc´ıtaˇcov´e vidˇen´ı, zpracov´an´ı digit´aln´ıho obrazu, SVM
Contents
1 Introduction 4
1.1 Facial Expressions . . . 5
1.1.1 Physiology of facial expressions . . . 5
1.2 Psychology of emotions - basic categories . . . 7
1.2.1 Anger . . . 7 1.2.2 Disgust . . . 8 1.2.3 Fear . . . 8 1.2.4 Happiness . . . 8 1.2.5 Sadness . . . 9 1.2.6 Surprise . . . 9 2 Micro-expressions 10 3 Related work 12 3.1 Micro-expression detection . . . 12 3.2 Micro-expression recognition. . . 13 4 Proposed method 14 4.1 Face rectification . . . 14 4.1.1 Landmarks . . . 15 4.1.2 Transformation . . . 15 Similarity . . . 15
Rotation & translation . . . 16
4.2 Regions of Interest . . . 16
4.2.1 Image stabilization by phase correlation . . . 18
4.3 Face description . . . 18 4.3.1 Feature smoothing . . . 19 4.4 Micro-expression detection . . . 20 4.4.1 Baseline method . . . 20 4.4.2 SVM classifier . . . 20 5 Implementation details 22 5.1 Annotation tool . . . 23
6 Datasets 26 6.1 Published datasets . . . 26 6.1.1 SMIC . . . 27 6.1.2 CASME. . . 28 6.1.3 SAMM . . . 29 6.1.4 Others. . . 29
6.2 Collection of “In the Wild” videos . . . 30
7 Experiments 32 7.1 Evaluation protocol . . . 32
7.2 Cross-validation on SMIC dataset . . . 32
7.3 Cross-database experiment . . . 33
7.4 Introspection experiments. . . 36
7.4.1 Landmark selection. . . 36
7.4.2 Impact of facial rectification . . . 36
7.4.3 Feature smoothing . . . 40
8 Conclusion 44
Abbreviations
AU Action unit
FACS Facial action coding system ME Micro-expression
MEVIEW Micro-expressions videos “in the Wild” ROI Region of interest
1 Introduction
The thesis studies the detection of spontaneous facial expressions appearing in stressful or emotional situations when a subject is attempting to conceal his/her true emotions. Such facial expressions are called micro-expressions. Their appearance features are similar to usual facial expressions. However, micro-expressions are distinct in time periods and quick changes on one or more particular locations in the face. Those micro-expression properties make the detection and recognition problem difficult for inexperienced people.
A motivation of the micro-expression detection in computer vision is an automatic recog-nition of suspicious behavior. A large variety of disciplines may benefit from revealing the phenomenon, e.g. security services, psychologists, teachers, etc.
We propose a pipeline to detect facial micro-expressions based on intensity difference analy-sis of consecutive registered face images. Specific facial regions are tracked using facial feature points. The micro-expression phenomenon results in a characteristic change in the difference signal. Two methods are proposed. The baseline method stands on thresholding the highest in-tensity change in the most emotive frame and the second proposed method uses SVM classifier trained on particular micro-expression patterns from the signal.
All published databases are filmed under stable laboratory conditions. As micro-expressions are difficult to evoke, collecting enough representative data is challenging especially from real-world situations. Therefore, we searched for high-stake or emotional videos on YouTube and annotated micro-expressions in poker games and TV interviews, where the underlying assump-tions are satisfied. The occurrence of MEs was annotated in the videos. We call the dataset MEVIEW – Micro-Expressions VIdEos in the Wild.
The thesis is structured as follows. Chapter1introduces the facial expressions from a phys-iological and psychological points of view. Chapter2describes micro-expressions. Chapter3
reviews the micro-expression detection and recognition in literature. Chapter 4 presents the proposed pipeline for the micro-expression detection. Chapter 5 details the implementation. Chapter 6 summarizes the published databases and describes the novel database MEVIEW. Chapter7evaluates the performance of the proposed pipeline and finally Chapter8concludes the thesis.
1.1 Facial Expressions
1.1 Facial Expressions
The human face is a complex structure deserving a lot of attention. The muscle structure and cooperation makes a face the most emotional part of the human body. It is hard to understand the person’s inner state of mind without seeing his/her face. Therefore, facial expressions play an irreplaceable part of non-verbal communication.
The Universality Hypothesis claims that perceiving and emitting facial expressions as emo-tions are identical regardless the person’s origin or cultural background. The original work studying facial expressions and their consequences is written by Charles Darwin [5]. Dar-win claimed that facial expressions are innate, i.e. cannot be learned and have an evolutionary meaning for survival. Paul Ekman made an observational study to find out whether humans, worldwide, have a similar appearance of emotions in the face and discovered a certain level of universality [16,15]. Moreover, he studied an isolated tribe in New Guinea and observed the same signs of facial expressions as reported about civilized people. Additionally, showing them “our” universal expressions, they were able to recognize the emotions as well.
Psychology distinguishes feelings and emotions. While feelings can last for hours, the du-ration of emotions is limited up to 5s. The emotions are further distinguished to voluntary and spontaneous expressions. Voluntary expressions are all under the subject control. They are easily faked and usually last for longer time. On the other hand, spontaneous expressions are brief.
1.1.1 Physiology of facial expressions
From the physiological point of view, the facial expression is a consequence of facial muscle activity. Those muscles are also called mimetic muscles or muscles of facial expressions. They are part of the group of head muscles, which additionally contain muscles of the scalp, muscles of mastication responsible for moving the jaw, and the tongue. Facial muscles are innervated by the Facial nerve, that branches in the face and its activation causes contractions, which results is various observable movements. The usually visible muscle actions are blocks of skin motion, e.g. eyebrows, lips, cheek, and wrinkles, e.g. on the forehead, between eyebrows, or on the nose.
In more detail, the human face consists of about 20 flat skeletal muscles [1], depicted in Fig.1.1. The muscles are located under the skin, attached to the skull bone and inserting the fa-cial skin, but not the bones or joints as other muscles responsible for body movements do. The muscles are located near the facial orifices, i.e. mouth, nose, and eyes [18]. However, unlike other facial muscles, they do not move with joints and bones, but mainly with the skin. Con-sequently, they cause facial surface deformations, which result in a variable facial expression representing emotions [18,26]. Note that the muscles move in groups rather than alone and control the orifices. According to the location, the taxonomy is partitioned into three groups: oral, nasal and orbital [1].
The oral muscles alter the shape of the oral orifice. This group is responsible for complex mouth motions and allows sophisticated shaping of the mouth, e.g. encircle the mouth, control
1 Introduction
Figure 1.1 Muscles of facial expressions, taken from [18].
angle of the mouth, elevate or depress the lower and upper lip separately or lift and depress the left and right corner or move with cheeks [1,3,18].
The nasal group is responsible for the compression and opening of the nostrils. One of the muscles, critical for facial expressions, is located between the eyebrows and pulls the eyebrows downwards and causes wrinkles over the nose [1,3,18].
The orbital group of three muscles is primarily responsible for the motion of the eyelid and protecting eyes. All the muscles are inserting the skin around the eyebrows and form vertical wrinkles between the eyebrows [1,3,18].
An interesting educational tool showing the particular muscles moves together with emotions can be found in [4]. The tool familiarizes the user with the anatomical and biomechanical foundation of facial expression morphology and offers lots of interactive examples showing the muscle cooperation during the facial expression.
Facial Action Coding System
The Facial Action Coding System (FACS), developed by Ekman et al. [13], is a tool describing every facial muscle activity motion by a set of Action Units (AUs). A particular AU represents
1.2 Psychology of emotions - basic categories
Table 1.1 Description of several AUs together with the muscle name [13]. AU Description Facial muscle
1 Inner Brow Raiser Frontalis 2 Outer Brow Raiser Frontalis
6 Cheek Raiser Orbicularis oculi 7 Lid Tightener Orbicularis oculi 9 Nose Wrinkler Levator labii superioris 10 Upper Lip Raiser Levator labii superioris 11 Nasolabial Deepener Zygomaticus minor 12 Lip Corner Puller Zygomaticus major 13 Cheek Puffer Levator anguli oris 14 Dimpler Buccinator
15 Lip Corner Depressor Depressor anguli oris 16 Lower Lip Depressor Depressor labii inferioris 17 Chin Raiser Mentalis
20 Lip stretcher Risorius w/ platysma
Table 1.2 Basic AUs connected with emotions [21]. Emotion AU Anger 4,5,7 Disgust 9,15,16 Fear 1,2,7,20 Happiness 6,12 Sadness 1,15 Surprise 1,2
a certain component of facial muscles movement, see Tab.1.1. Each emotion in the face can be described by a set of AUs, see Fig.1.2.
1.2 Psychology of emotions - basic categories
Ekman describes the six basic emotions [14]. The following section reviews the emotions and concludes their important features. The basic AUs for a specific emotion are listed in Tab.1.2. Mixing basic expressions creates more different expressions, e.g. angrily surprised.
1.2.1 Anger
Anger is a strong emotional reaction and can also be a dangerous emotion as it might provoke violence. The source of anger has many reasons. Considering the frustration, one can feel anger against an obstacle on the way to success. A different source of anger is a physical threat. When someone wants to hurt us, we naturally feel anger. As well as physical violence, verbal threats or claims also cause the emotion of anger. Other examples are false accusations in uncommitted crimes or someone breaking our personal values.
1 Introduction
face, and tension in the muscles are usually reflected. The physiological response induces the following signals.
• The eyebrows are lowered and squeezing together. There are vertical wrinkles between the eyebrows.
• The eyelids are tight and straight.
• The eyes are tight, focusing on the source of anger. Pupils are narrowed, focusing on the source of anger.
• The lips are either closed tight or gently opened (preparing for yelling).
Together, those characteristics apparently prepare the body for a possible physical or verbal attack.
1.2.2 Disgust
Disgust is a negative emotion usually evoked by smell, taste or vision. Unlike the other emo-tions, objects evoking disgust are not universal, but cultural or personal, e.g. food. The extreme physiological response is vomiting. The most significant features of the face are in the mouth and nose area.
• The upper lip is lifted.
• There are wrinkles on the nose. • The cheeks are lifted.
• The eyelids are lifted but are not tight. There are wrinkles under the eyes. • The eyebrows are pulled down.
1.2.3 Fear
Fear is induced by dangerous or stressful situations. One can feel fear from future events, e.g. fear of loosing money. The reaction to an outbreak of violence may be fear, which can stay or turn in anger. While experiencing fear the person’s body is preparing for an escape or a defense against any possible attack, i.e. the heart rate and blood pressure increases, the eyes are open, and the pupils are wide, so the eyes can absorb the maximum amount of the light. In extreme situations fear might induce the muscle function loss, i.e. paralysis.
• The eyebrows are lifted and pulled inward. • There are wrinkles on the forehead. • The upper eyelids are lifted.
• The mouth is open, and the lips are tight according to the intensity of the emotion.
1.2.4 Happiness
Happiness or joy is a positive emotion often associated with a smile on the face. The happiness emotion appears when achieving goals. The typical characteristics on the face are:
• The lips corners are pulled back and up.
1.2 Psychology of emotions - basic categories
• The cheeks can be raised.
• The wrinkles under the lower eyelid might appear. • The wrinkles appear outside the eye corners.
1.2.5 Sadness
Sadness appears when a person suffer. The origin of sadness is typically a loss of something. This emotion is calm, not impulsive and often accompanied by tears. During the emotion, the facial muscles lose the tension which may result in typical physiological features
• The inner parts of the eyebrows are pulled down. • Lips corners pull down, and lips shake.
1.2.6 Surprise
Surprise is a sudden emotion. It comes without thinking and only lasts for a short time. The beginning is an unexpected or wrongly expected situation. Therefore, surprising emotion is either positive or negative. Surprise cannot be anticipated. If there is time to think about the situation, the subsequent reaction will not be the surprise. Surprise often proceeds into another emotion, usually happiness or sadness.
The typical features of surprise are lifted eyebrows, which additionally cause wrinkles on the forehead, widely open eyes, and a dropped jaw.
• The eyebrows are lifted and pulled inward. • Horizontal wrinkles appear on the forehead. • The eyes are open wide.
2 Micro-expressions
Micro-expressions are defined as very brief, involuntary facial expressions, see Fig.2.2. MEs tend to occur in high-stake and stressful situations, especially when something valuable can be gained or lost and the emotions are either deliberately or unconsciously concealed [12,8, 11,17]. Therefore, the MEs are a promising cue in catching liars and their detection could be important for police inquiring [32], airport security [20,41] or psychological examinations. An observer can benefit from the fact, that very subtle facial expressions often leak, even if the subject attempts to conceal unwanted emotions [8,19]. Compared to a polygraph, revealing a liar using a camera is not invasive and could be applied even without awareness of the subject.
Figure 2.1 Histogram for the ME duration ob-tained from 109 elicited MEs and four different distributions fit the data. Taken from [46].
Various reasons exist to hide emotions [30], e.g. cultural conventions, social be-havior or even deception. People begin to learn controlling their emotions in their childhood, e.g. to smile when it is appro-priate, not to express anger openly, to fake an emotion to deceive an opponent [14]. Ekman studied MEs in context of lies and showed MEs promising in revealing de-ception [11]. However, MEs do not pro-vide any proof of lying and the context is always important, since MEs only reflect the current emotional state, e.g. an inno-cent person naturally feels anger in case of false accusation.
Recognizing ME can be helpful in many disciplines. Teachers could teach their students more efficiently. Business courses are promoted to improve the communication skills by read-ing facial expressions and thus increasread-ing the emotional intelligence.
The definition of ME, however, is not very strict. The time duration is usually the key feature to distinguish MEs from a normal facial expressions [37]. An experimental study [46] discussing the duration of MEs considered the maximum time limit of MEs less than 500ms and showed the mean value 314ms, see Fig.2.1. According to psychologists, the ME lasts between 1/25s and 1/3s [11,29]. Due to a short duration and subtle changes on the face surface, noticing MEs is challenging even for people. Haggard and Isaacs, the first ME discoverers, claimed that spotting MEs for people in real time is not even possible [25]. Later Ekman published a study [8] showing the ability can be trained and improved by practicing. The techniques is developed in [9,29].
Figure 2.2 Example of a micro-expression in a real situation, source YouTube1.
The MEs, similarly as common facial expressions, can be divided into six basics categories [10] - anger, disgust, fear, happiness, sadness and surprise. Each of them has a specific appear-ance in the face which can be described using Facial Action Coding System (FACS) [13], see Tab.1.2.
1
3 Related work
Most of the related work is focused on the recognition problem; not many papers deal with the detection although a fast detection is necessary in real situations due to a rare occurrence of MEs. Especially in real videos, it is challenging to distinguish brief facial motions from neutral expressions and to avoid false alarms caused by normal expressions, global facial movements, speaking, occlusions, etc.
3.1 Micro-expression detection
ME detection or spotting refers to a problem of automatically searching a temporal location of ME occurrences. While this problem is common in other topics like eye-blinking detection, the ME detection problem is still largely undiscovered.
Polikovski et al. [35,36] first described the problem in the computer vision area investigating both the detection and the recognition problem using 3D histogram of gradients. The obtained descriptors were clustered using k-means algorithm to obtain a particular AU. The results were presented only on a small database which is not available online and the MEs were not real but posed by non-professional volunteers.
Wu et al. [42] extracted the features using Gabor filters and detected MEs using GentleSVM. It is a combination of feature selection by GentleBoost and the best nfeatures were used to train the SVM classier. The work deals with both the spotting and the recognition problem. The method was evaluated on METT training examples [9] determined for training people. See
Sec.6.1.4for description of the METT examples.
Shreve et al. [38] made another research on the ME detection problem using optical flow and estimated the spatio-temporal strains. The results were evaluated on an unpublished database.
Moilanen et al. [31] proposed a method based on feature difference analysis. Features were obtained dividing the face into a6×6grid and each box described by LBP. They reported results on SMIC [28] and CASME database [47]. Further, Li et al. [27] integrated works of [31] and [34,28] and proposed a system for an automatic ME analysis consisting of both spotting and recognition (MESR). They evaluated the results on CASMEII [45] and SMIC E databases as longer clips. Read more details about the databases in Chap.6.
Davidson et al. [7] proposed a method based on Histogram oriented Gradients features, the chi-squared dissimilarity measure and evaluated on their in-house dataset. This dataset was recently published as SAMM [6].
Patel et al. [33] used optical flow motion vectors and focused on detection onset, apex and offset frame of a micro-expression.
3.2 Micro-expression recognition
3.2 Micro-expression recognition
ME recognition problem refers to the classification of a pre-segmented video sequences into two or more classes, i.e. the isolated recognition problem. The pre-segmented sequence might be given by the detection algorithm. The classes can be either emotional states (anger, happi-ness, disgust, etc.), Action Units or ME classes. The problem of detection ME/non-ME classes is possible to apply on the spotting problem together with sliding window. To our knowledge, nobody tried it on longer video sequences.
Polikovski et al. [35,36] used the 3D gradient descriptor for the classification of AUs. For detection, see Sec.3.1.
Phister et al. [34] proposed a Temporal Interpolation Model to handle the different video length, the spatio-temporal descriptor LBP-TOP to handle dynamic features and as a classifiers SVM, Multiple Kernel Learning, Random Forests were used.
Guo et al. [24] proposed a combination of LBP-TOP feature extraction and nearest neighbor classifier. The recognition problem was performed on the SMIC database.
Wang et al. [40] proposed a Tensor Independent Color Space (TICS) model and extracted LBP-TOP features and compared the novel TICS, RGB and gray color space. In extended version [39] more color spaces were compared (CIELab and CIELuv) and showed that the performance of TICS, CIELab and CIELuv are better then RGB or gray. Further, in another paper [40] the facial movements were described by Robust PCA and used for recognition.
Xu et al. [44] estimated a movement between consecutive frames using the optical flow estimation, located the local motion, i.e. filtered the global motion, and the principal direction of the residual motion was described by facial dynamic maps. SVM classifier was trained to recognize both the ME/non-ME and the emotion label.
4 Proposed method
A method which spots facial MEs is proposed in this chapter. We expect the input is a video acquired by a standard camera, i.e. at a frame rate 25fps. The source of the video is realistic, non-laboratory and the subject do not have to cooperate, but he/she moves freely. The viewpoint of the camera is not always frontal or stable. The illumination of the scene may change.
Our algorithm is based on the assumption that (usually a small) muscle contraction during the ME results in a sudden measurable change of intensity in a particular region inside the face image. Two effects are possible: (1) texture changes, e.g. wrinkles may appear, or (2) surface normal changes, when a larger textureless region is moved. Either of the effects or both of them are present. Since the magnitude is small, and the phenomenon can easily be confused with a global head/camera motion, speaking, eye-blinks, or presenting a normal (controlled) expression, we proposed an algorithm that first register face to undo the global motion, and then use a classifier to detect typical patterns of the ME from registered intensity difference signal over time.
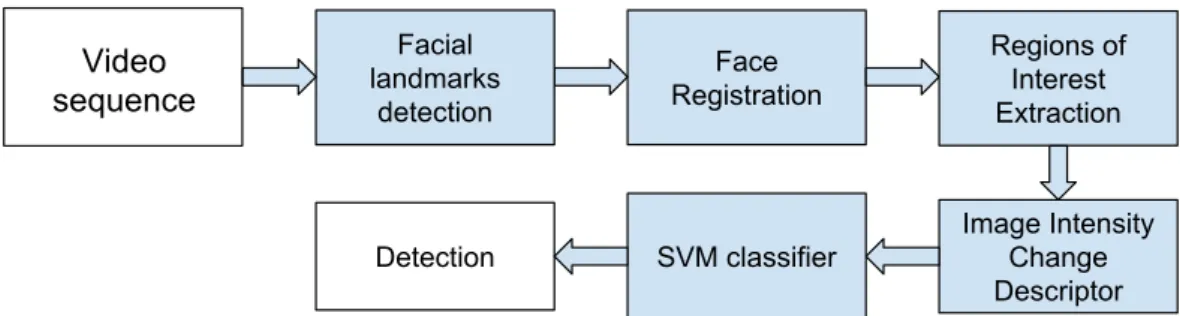
The pipeline is depicted in Fig.4.1. The face is first found and landmarks are detected in the video sequence. Then the face image is warped into a canonical coordinate system and split into ROIs describing the facial parts, where a motion caused by MEs is expected. Each ROI measures image intensity changes within a temporal sliding window. The SVM classifier was trained to distinguish the ME from false intensity changes caused by other motions and illumination changes.
4.1 Face rectification
To compensate the global motion, a transformation into a canonical coordinate system (of the generic frontal landmark configuration) is estimated, and the face image is warped accordingly. Facial regions are thus registered. Pixels are as much as possible corresponding over the time.
Face Registration Facial landmarks detection Image Intensity Change Descriptor Regions of Interest Extraction SVM classifier Video sequence Detection
4.1 Face rectification
Figure 4.2 Examples of facial landmarks detected by the Intraface detector [43].
4.1.1 Landmarks
Two algorithms for the facial landmarks detection were tested - Chehra [2] and Intraface [43]. Both methods are state-of-the-art implementation of a cascade of linear regressors. The differ-ence is that Chehra fits a 3D model of a cannonical facial shape and Intraface 2D model. The detectors output a set of 49 facial feature points in every video sequence framet
xt= [(xt1, y1t),(xt2, yt2), . . .(xt49, yt49)]. (4.1) This is a standard set of landmarks defined on a contour of the eyes, eyebrows, nose and mouth, see Fig.4.2.
4.1.2 Transformation
Similarity
Every face image in timetis transformed by similarity into the generic canonical shape model
¯
x= [(¯x1,y¯1),(¯x2,y¯2), . . .(¯x49,y¯49)], (4.2)
which is an average shape of the landmarks. The generic shape is distributed with Intraface detector.
The similarity transformation is given by scales, rotation angleϕand translation vectorx0
by S(x;s, ϕ,x0) = scosϕ −sinϕ sinϕ scosϕ ! x+x0. (4.3)
4 Proposed method
The estimate is formulated in the least squares sense over all landmark points
S∗ =arg min s,ϕ,x0 49 X i=1 ||S(xi;s, ϕ,x0)−¯xi||22. (4.4)
Minimizing the objective is solved by Procrustes analysis [22]. Finally, the image is trans-formed into grayscale, smoothed by Gaussian filter with σ = 1 (to remove high-frequency noise of the camera), and warped by the estimated transformationS∗and cropped into 300×300 pixels image.
Note that the generic mean shape model may differ from the person specific landmark con-figuration. The shapes cannot be fully registered by the similarity transformation that captures only in-the-plane head/camera rotation, translation motion, and camera zooming. Neverthe-less, in theory, this is not a major problem, since due to a fast nature of the ME, we compare intensities between nearby frames. Their landmark configurations are not very different. Al-though the rectified image is not perfectly frontal for off-the-plane rotations, nearby frames are transformed similarly. More complex transformation, e.g. using a piece-wise planar 3D model, or elastic registration might result in artifacts caused by landmark fluctuations. However, small landmark estimation errors are filtered out by the simple transformation of four parameters.
Rotation & translation
In situations, when the camera is not zooming, it is redundant to estimate the scale. Removing a single degree of freedom of the similarity from equation4.3, the transformation is
R(x;ϕ,x0) =
cosϕ −sinϕ sinϕ cosϕ
!
x+x0. (4.5)
The estimation problem is formulated in the least square sense as well as the similarity estima-tion in equaestima-tion4.4and solved by Procrustes analysis [22].
4.2 Regions of Interest
The structure of facial muscles produces various facial expressions. It is observed that certain emotions always activate a subset of muscles and these motions are described by facial action units [13]. Polikovski et al. [35] came up with the idea dividing the face into regions to capture the specific facial muscles. As the occurrence of MEs is local, i.e. region-dependent, and manifests only in a small part of the face.
Following [35], twelve Regions of Interests (ROIs) were defined from the landmark positions on the face, see Fig.4.3. Each ROI wraps a group of muscles, their contraction causes a specific facial motion (AU) and thus a change of expression. Additionally, each ROI can detect specific AUs, see Tab.4.1.
4.2 Regions of Interest
Figure 4.3 Rectified face with twelve regions of interests depicted. Regions of Interests are designed to wrap important facial muscles to determine the location of the ME.
Table 4.1 ROIs and corresponding AUs. [35]
ROI AUs Forehead 1,2,4 Left eyebrow 1,2 Right eyebrow 1,2 Between eyebrows 4 Left eye 7 Right eye 7 Nose 9 Left cheek 6,10 Right cheek 6,10 Mouth 16,17,20
Left mouth corner 11,12,13,14,15 Right mouth corner 11,12,13,14,15
4 Proposed method
4.2.1 Image stabilization by phase correlation
Due to a fluctuation of the landmarks, the displacement between a small residual gitter is ob-servable in a registered video sequence. We model the instability by translation. The best displacement between subsequent ROIs having the maxima correlation measured between raw image intensities.
Having the location of ROIRtat timet, the Pearson similarity statistics [23] was calculate to find the best displacement in extended ROIRˆt+1 at time t+ 1. The extended ROI Rˆt+1
was chosen to be 10% larger than Rt to allow only limited displacement. To speed up the computation of the correlation coefficients, the advantage of the Fast Fourier Transform (FFT) was used. Let F andG be the Fourier image of Rt and Rˆt+1 respectively. Note that the
extendedRˆt+1 had to be padded with zeros to the same size asRt. The phase correlation is obtained by H(x, y) =F−1 F(u, v)·G∗(u, v) |F(u, v)·G∗(u, v)| , (4.6)
where∗denotes complex conjugate number, and the optional displacement by
(x∗, y∗) =argmax
x,y H(x, y). (4.7) The location of maxima ofHgives the optimal displacement.
4.3 Face description
Facial ROI k ∈ {1, . . . ,12} with an image frame at timetand a sub-window of sizem×n
were vectorized
Itk∈Rmn. (4.8)
As the regions are processed independently, the region index kis dropped in the subsequent text.
For each frame, every regionIt is photometrically normalized to suppress possible global illumination changes, e.g. intensity blinking due to fluorescent illumination that interferes with camera frame rate The normalization is done such that the mean is mapped to 0 and standard deviation to 1. The result is divided by total number of pixels in the ROI to balance the different size of ROIs ˆ It= 1 mn It−µ1 σ . (4.9)
The squared Euclidean difference between image regions at framet1and framet2is used as
dissimilarity measure and is given by
dt1,t2 =||Iˆt1 −Iˆt2||
2
2 (4.10)
4.3 Face description
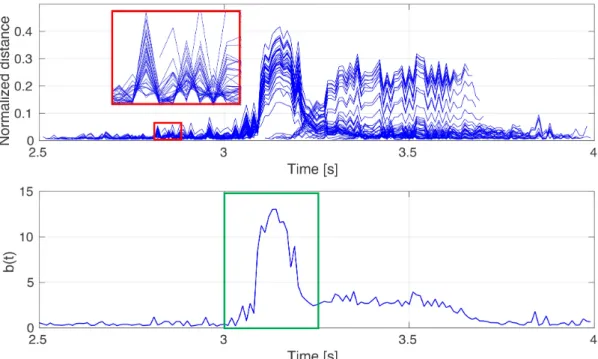
Figure 4.4 The micro-expression (a surprise emotion) after the poker gamer uncovered his cards. The ME starts with the neutral expression and returns after (12 frames) back to the neutral expression. In the middle frame, a raised eyebrow and wrinkles on the forehead can be noticed. The plot shows elements of the descriptorΦtfor the forehead ROI.
the sliding windowt1∈ {1, . . . , T}
Φt= [dt,t+1, dt,t+2, . . . , dt,t+T]. (4.11) The ME is observed for a short period. According to the maximum considered ME duration, the sliding window of lengthT = 0.5s is used. The temporal descriptor measures the changes of image intensities within the sliding window for every ROI, see Fig.4.4.
4.3.1 Feature smoothing
Components of the featuresΦt, further consider as signals, are differences between registered ROIs and the ROIs are not always stable. Thus signals suffer from noise, see Fig. 4.5. To reduce The noise signals are smoothed.
Moving average
The signal Φis smoothed using moving average with a uniform filter of sizewequal to one-quarter of the dimension of the dimension ofΦ.
ˆ Φ=Φ∗[ w−times z }| { 1 w, ..., 1 w] (4.12)
4 Proposed method
Convolution of the signal with the uniform filter gives the new descriptor vector. Polynomial function
The polynomial function of degree four is chosen to fit the signal using linear regression. The solution of the problem leads to an overdetermined system of linear equations. The solution is in the least square sense. The signals replaced by the approximated function.
4.4 Micro-expression detection
Two methods are proposed. The first one, described in Sec.4.4.1, does not involve any training and is based only on the fact that the highest image intensity changes are in the apex frame of the ME Sec. 4.4.1. The other one is supervised and is trained to capture the pattern of MEs
Sec.4.4.2.
4.4.1 Baseline method
Consider an example of the ME in Fig.4.4 and the corresponding shape of Φt. In the most emotional ME frame (the apex frame), there is supposed to be the largest difference between the apex frame and the preceding frame. Therefore, a score is obtained by aggregating the differences b(t) = t−1 X j=t−T ||Iˆt−Iˆj||22. (4.13)
Note that the signalb(t)is possible to obtain by summing theΦat the time.
The signalb(t)is thresholded. The maxima usually coincide with the ME apex frames. The idea behind is that in the case of the ME,Φtsignals over reference framesttend to be coherent and produce strong responseb(t)as demonstrated in Fig.4.5.
However, the drawback is that other local maxima are generated by other events causing rapid changes in the image, e.g. a global motion or blinking. This weakness is partially mitigated by training a classifier as described in the following section.
4.4.2 SVM classifier
The classifier is trained to distinguish MEs from other false intensity changes. The SVM clas-sifier with RBF kernel was trained on the SMIC E HS database. Videos in SMIC have 100fps frame rate. Therefore the feature vectors Φtwere sub-sampled by taking every 4-th element since our test videos are only 25fps.
The positive samples were collected from the training sequences. Lettibe all onset frames of the annotated MEs for every region,i= 1, . . . , N. Then positive sample set is defined as
P =
N
[
i=1
4.4 Micro-expression detection
Figure 4.5 The upper plot shows the expanded intensity descriptorsΦtover reference framest. The
coherence of the signals and the largest difference in the apex frame results in a peak of the aggregated responseb(t).
The data augmentation, where 15 frames before and 5 frames after the onset frame of the original 100fps video, ensures that the apex frame of the ME is always present within the feature vectors. An equal number of negative samples were collected from the rest of the video sequences randomly.
Note that a specific SVM classifier was trained for every region of interestk = 1, . . . ,12. The reason of independent processing is that the intensity pattern may be different due to e.g. amount of texture within the region. Finally, SVMs were trained from 800–2000 samples depending on the occurrence of the ME in a particular ROI in the training data.
5 Implementation details
A few tricks to improve the detection were implemented. The regions of eyes were finally removed from the set of detectors as eye blinking is a rapid movement of approximately same duration as MEs. However, filtering the eye blinks is not possible since the spontaneous blink-ing is often partially overlappblink-ing with the MEs.
For “in the Wild” videos, the participants were not always recorded from the frontal pose. Then a subset of ROIs became fully or partially occluded due to a head yaw, see Fig. 5.1. Therefore, we detected a non-frontal head pose and the features from the occluded parts of the face were not considered in further processing. The head pose was estimated simply by computing the natural logarithm of the ratio between the inner eye landmarks and the top nose landmark distances. In the frontal pose, the log-ratio was approximately 0, while the non-frontal pose was detected when the magnitude of the log-ratio exceeds empirically set threshold
0.5.
Finally, the detector response was modified by non-maximal suppression with 20 frames window to avoid multiple responses for the same event in the data.
The entire pipeline was implemented in MATLAB and was not optimized. However, we believe a real-time performance for standard 25fps videos would be easily achieved, since the landmark detection algorithm is real-time. The transformation estimation and the face area warping are cheap operations. Moreover, the differences among the registered ROIs are computed independently, therefore, can be computed and evaluated parallel.
Figure 5.1 The occlusion caused by a head yaw. The ROI does not envelope the facial region and is excluded from the classification.
5.1 Annotation tool
5.1 Annotation tool
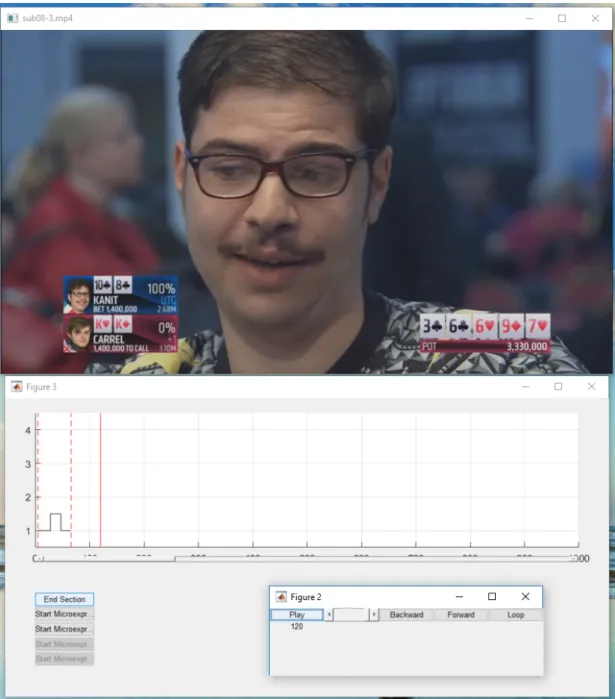
A simple annotation tool was developed to improve the effectiveness of catching MEs. The tool allows playing videos using an external player (VLC player based mex) and controlling the player from MATLAB. It offers simple commands, i.e. play/pause, normal speed or modified speed playing and passing the video frame by frame forward and backward. Additionally, a certain clip of the video can be played repeatedly.
The annotation tool is designed to add multiple labels to events in the video sequence and allows creating video sections, which can be used to distinguish different TV show or poker game parts, e.g. camera switching cards and faces.
The interface, see Fig.5.2, consists of four windows. The initial window let the user choose the video file. In the other window, the player is controlled. It contains buttons PLAY/PAUSE, frame FORWARD,BACKWARD, play a 1s LOOPand a slider to control the video player speed. The third window is meant for annotations. After starting a section, a user chooses a number of annotation tracks. The tracks are used for different people or different motions in the face. In the current clip, a user clicks the button STARTMICROEXPRESSIONto add the initial label or END MICROEXPRESSION to finish the interval. The section is finalized by clicking the End Section. The last window is the video player. After closing the program, the results are saved in MATLAB data filemat.
The annotation tool was useful to spot MEs effectively. The MEVIEW database, described in Chap.6.2, was annotated using the tool.
5 Implementation details
Figure 5.2 Screenshot of the annotation tool developed for the micro-expression spotting. Three main windows are showed in the figure - the video control panel, the annotation panel and the player.
6 Datasets
Obtaining a good database of MEs is highly challenging due to the non-trivial process of evok-ing MEs. Especially in laboratory conditions, high-stake situations can be hardly evoked as well as to force participants to hide the true emotions. An example for good ME occurrence situations might be criminal interrogations. When the suspect pretends to be innocent and tries to conceal his/her true emotions, the leaked MEs on his/her face would reveal the lie. How-ever, obtaining such database would involve close cooperation with police and either way those confidential data would be surely impossible to publish.
Therefore, the current databases are made either by posing faked MEs, i.e. the participants tried to simulate normal expressions very fast, or, the other approach, which is used in all recent published databases, was inducing MEs by watching emotive videos and trying to suppress any emotions, i.e. the normal expressions.
Games are an another idea based on the stress factor and the need to hide emotions. We collected videos of poker games from YouTube and annotated MEs. The details are described in Sec.6.2.
In literature, there are databases of spontaneous MEs collected by asking participants to watch an emotive video in the laboratory environment, in front of a high-speed camera. Then participants’ task was to conceal any emotions. As a motivation, they either got a money reward CASMEII [47], SAMM [6] or were punished by filling a long form in SMIC [28] in the case of apparent failure. Those databases are described in Sec.6.1.
Besides the spontaneous databases, other databases have been collected. The problem was that most of them were not published or often contained faked MEs, which is in contradiction with Ekman theory that MEs cannot be controlled [12]. They are discussed in Sec.6.1.4. All known datasets are summarized in Tab.6.1.
6.1 Published datasets
In this section, the most important standard databases are described.
Table 6.1 Micro-expressions databases summary
Polikovski USF-HS SMIC CASME CASMEII SAMM MEVIEW Micro-expressions 42 100 164 195 255 159 31
Participants 10 Unknown 16 19 26 32 16
Resolution 640×480 720×1280 640×480 640×480/720×1280 640×480 2040×1188 720×1280
Frame rate 200 29.7 100 60 200 200 25
Spontaneous/posed Posed Posed Spontaneous Spontaneous Spontaneous Spontaneous Spontaneous Environment Laboratory Laboratory Laboratory Laboratory Laboratory Laboratory Real Main purpose Recognition Detection Recognition Recognition Recognition Recognition Detection
6.1 Published datasets
Figure 6.1 Four examples from the SMIC database [28]. The participants were recorded from the frontal poses, while watching an emotive video clip.
6.1.1 SMIC
The original SMIC database [28], see Fig.6.1, consists of 164 MEs with 20 participants. The resolution is640×480px and frame rate 100 Hz. The average facial resolution is190×230. The participants were recorded in a laboratory environment with controlled illumination, en-sured by four lights in the room corners. Participants sat in stable positions in front of the high-speed camera. The emotional videos were played. After each video, they filled a ques-tionnaire about their feelings from the video clip.
The idea of obtaining MEs was based on two conditions. (1) Stimuli strong enough to elicit the emotion on the neutral face, (2) motivation to conceal any emotion. The first requirement was satisfied by watching emotive videos. When the participant failed in keeping the neutral face, e.g. the participant burst out laughing, he/she had to fill a long, annoying questionnaire containing more than 500 questions.
The videos were clipped only to the duration of MEs with no margin before and after the ME. Therefore, it is suitable for the isolated recognition. The detection problem was performed in published paper clipping neutral parts and classifying ME/non-ME. ME clips were annotated by three categories - positive, negative and surprise. The expressions were not FACS coded.
Later few extended version were published. 10 participants were recorded by a standard video camera (VIS) and a near-infrared camera (NIR) with 25 fps. Especially for the detection
6 Datasets
Figure 6.2 The participants from CASME2 database [45] recorded in frontal pose.
problem, longer videos were published (SMIC E). Time margin before and after the ME was preserved in video clips and onset and offset frames were labeled. The average length of the videos is 5.9s.
6.1.2 CASME
The CASME database [47] consists of 195 elicited MEs from 19 participants captured in 60 Hz frame rate. The CASME data were recorded by two cameras. The first with resolution
1280×720(CASME-A) and the other one with640×480(CASME-B). The cameras also differ in the environment. CASME-A was recorded under a natural light and CASME-B in a room equipped with two LED lights.
The environment was controlled and participants were asked to keep a neutral face and do not move to prevent noisy output. The emotional stimuli were induced by watching very emotional videos, see in Tab.6.2. Psychological researchers manually detected MEs. The moving facial parts were annotated by AUs and the emotional labels were added to the spotted ME.
However, recorded videos were clipped such that only a small neutral face video interval was preserved around the ME. Therefore, this database is primarily meant for the isolated recognition problem.
Later the improved database CASMEII [45], see Fig.6.2, was released as an extension of the original dataset. The database contains 255 videos with 26 subjects. CASMEII was recorded
6.1 Published datasets
Table 6.2 Examples of stimuli used to induce emotions in CASMEII database [45]. Video Stimuli Description Emotion Link
Jokes on names Happiness Tooth extraction Disgust A girl killed by car Sadness Dog torturing Anger
by a high-speed camera with 200fps and resolution640×480. Four LED lamps balanced the problem that lights flickering appeared in high-speed videos.
The protocol was the same as for the CASME database. The onset, apex, and offset frames were annotated in the clipped videos; FACS coded, and emotion type annotated. Few examples of the video stimuli is in Tab.6.2
Videos were clipped, and the average length of video clips is 1.25s. The ME was usually in the middle. The database is available for research purposes.
6.1.3 SAMM
A new database called SAMM [6] focused primarily on the resolution of MEs. The participants were recorded with 200fps, video resolution 2040×1088and 400×400 facial resolution. Together 159 micro-movements from 32 university participants were collected. The experiment was in fully controlled laboratory conditions. Each participant sat in front of the camera in the laboratory room. The light conditions were ensured by two lights with an array of LEDs to balance the aliasing. Aliasing makes a problem for high-speed camera recordings as the common frequency of the lights is 50Hz and causes flickering on the captured images.
SAMM used the similar experiment protocol as the SMIC and CASME. Participants were asked to stay in the same position and keep as much neutral expression as possible with a motivation of winning £50. The emotions were induced by a video stimuli downloaded from the Internet, see Tab. 6.3. The full list of used videos can be found in the original database paper [6]. The source of the videos was not mentioned.
The contribution of the collection was to capture details of micro-movements in the face with a high-resolution camera and to annotate the facial motion by FACS coding system, see Tab.1.1. SAMM is not focusing on emotional labels.
The database is available for research purposes, and clipped micro-movements can be down-loaded directly from the Internet. The full version, which would be useful for detection, is also available, however, because of a large amount of data it is not stored online, but can be sent on a disk.
6.1.4 Others
Polikovski et al. [35] created a collection of posed ME, i.e. the MEs were not spontaneous but performed artificially. The participants were ten students, and they were asked to perform seven basic emotion very fast. The camera resolution was640×480and 200fps.
6 Datasets
Table 6.3 Examples of stimuli used to induce emotions in SAMM database [6]. Video Stimuli Description Emotion Link
Snake attacks camera Fear
A dog being kicked Anger/Sadness Twin towers collapsing Sadness Baby laughing Happiness
USF-HD [38] is a collection of 100 posed MEs. The participants saw an example of a particular ME and tried to mimic it as quick as possible. The collection consists of 100 MEs with the resolution of720×1280and with 29.7fps. The database is not available to download.
Micro-Expression Training Tool (METT) [9] is a training tool created by Paul Ekman to teach people recognizing MEs. However, the dataset is not suitable for machine learning as the sequence contains the same neutral expression picture before and after. One frame with a facial expression (often not ME, but the macro-expression) is located in the middle. The principle of teaching people is to train the ability recognize the particular emotion extremely fast. METT is mentioned here as Wu et al. [42] performed experiments on this dataset.
6.2 Collection of “In the Wild” videos
We collected new MEVIEW dataset (Micro-Expressions VIdEos in the Wild), see Fig.6.3. The dataset consists of videos from poker games, and TV interviews downloaded from the Internet. The advantage of poker games is the stress environment and the necessity to hide emotions. Opponents try to conceal or fake their true emotions, which is a scenario where MEs are likely to appear. The MEs are still rare since the TV show post production often cut the most valuable moments such as the detail of a player’s face while the cards are being uncovered or someone raises, calls or folds his/her cards.
MEs were manually explored in videos following the Ekman advice. First, watch the scene frame by frame and gradually increase the speed after. Special attention was paid around key moments of the game in case of poker videos, or while a person was listening to a hard question in the case of the TV interviews. These suspicious events were checked carefully. The annotator participated in the Ekman’s online course1and he was able to detect several MEs in the videos with reasonable confidence. The onset and offset frames of the ME were marked in long videos, and FACS coded, and the emotion types were annotated. In summary, 31 video clips with 16 individuals were collected. The video resolution is 720×1280 and frame rate 25. In the experiments, the videos were clipped such that each video clip contains one camera shot with the face which was being analyzed. Therefore the average duration of the videos is 3s. The facial area differs as the camera is often zooming, changing the angle and the scene.
1
6.2 Collection of “In the Wild” videos
Figure 6.3 Examples from the database MEVIEW contain many different phenomena besides the frontal head pose, e.g. small facial resolution, sunglasses, occlusion, in-the-plane and off-the-plane head rotation.
7 Experiments
The proposed method was tested on both standard SMIC [28] and CASME II [45] datasets, and on our MEVIEW dataset. Another suitable database would be SAMM. However, due to the recent release, we did not get the full version. We performed the validation and cross-dataset experiments with testing the proposed methods in the detection pipeline and evaluated the baseline method with multiple design choices in each block of the pipeline, see Fig. 7.6. The algorithm was tested against competing method of Li et al. [27] with favorable results.
7.1 Evaluation protocol
For evaluation, we strictly follow the evaluation protocol of [27]. Having annotated onset and offset frames of the ME, then a frame is considered to be correctly detected if it is in range [onset-(N/4), offset+(N/4)], whereN is the maximal considered length of a ME,N = 64for CASMEII (200 Hz),N = 32for SMIC (100 Hz), andN = 8for MEVIEW dataset (25 Hz). It means the interval is expanded by a small margin to tolerate a low uncertainty of the annotation in the precise ME interval. All such correctly detected frames are counted as True Positives (TP). If a detection is out of the range, then allN frames are counted as False Positives (FP). The True Positive Rate (TPR) is TP divided by a number of annotated positive frames, and the False Positive Rate (FPR) is FP divided by the total number of frames in a sequence without the number of annotated positive frames. The performance is evaluated by receiver operating characteristic (ROC) curve and the area under the curve (AUC).
For our method, at each frame, we have twelve detectors that are spotting MEs. The detection of the ME is considered if at least one detector fires.
7.2 Cross-validation on SMIC dataset
In the SMIC E HS database, there are 20 participants. Therefore a 20-fold cross-validation, always leaving all videos of one participant out, was performed to train the SVM classifier and to estimate the detection accuracy.
The videos were manually checked, and only ROIs with an observable muscle motion in the annotated ME interval was considered as a valid sample in the training set. Cross-validation ROC curves are shown in Fig. 7.1, together with the mean ROC curve. It is seen, that ROC curves have a relatively high variance for cross-validation runs. The reason is probably that MEs of certain participants are much easier/more difficult detectable than for others. Certain subjects seem almost like having a wax face, spotting their MEs is even difficult for a manual
7.3 Cross-database experiment
False Positive Rate
0 0.2 0.4 0.6 0.8 1
True Positive Rate
0 0.2 0.4 0.6 0.8 1
Figure 7.1 The 20-fold cross-validation on SMIC E HS dataset. The mean ROC curve, highlighted in red, has AUC = 0.88.
inspection of the video played slowly and repeatedly. On the hand, we noticed movements that might be micro-expressions that were not annotated in the dataset.
The mean ROC curve is compared to the baseline method, Sec.4.4.1, and the result of [27] in Fig.7.3. The baseline methods contain choices - Intraface landmarks, similarity transforma-tion and none smoothing of the features. The mean ROC curve outperforms both the baseline thresholding and the method [27]. Nevertheless, average result of the cross-validation is shown.
7.3 Cross-database experiment
The SVM detectors were trained on the entire SMIC E HS database and the resulting classifiers were evaluated on CASMEII, see Fig.7.4and on the MEVIEW database, see Fig.7.5.
The CASMEII contains videos in 200 Hz frame rate. Therefore the videos were sub-sampled taking every 8th frame. The proposed SVM detector outperformed the other methods. For CASMEII, we can see the SVM significantly outperformed the baseline thresholding, and it is slightly more accurate than [27].
Results on our MEVIEW dataset are inferior to the results on CASMEII and SMIC. The reason is that MEVIEW dataset is much more challenging and includes many “in-the-Wild” phenomena that cause false positives. Nevertheless, the strongest detection in both the SVM and baseline methods belongs to true MEs. An example of detection scores of all twelve ROIs for several frames of the poker game video, around an event shown in Fig.4.4, is presented in Fig.7.2. We can see the true ME have the highest score, while several top scoring events false events appear, probably due to improperly compensated motion.
The proposed algorithm produces some false positives. They are often caused by eye blinks. Eye blink duration is similar to MEs. Excluding the eye regions helped to reduce the false alarms. However, we observed that the eye blinks causes a shift of the entire set of landmarks and thus influence the transformation, which may result in false detection in other regions than
7 Experiments
Figure 7.2 The output of the SVM detectors for twelve ROIs. Yellow color refers to higher score of the SVM. The ME is marked by a red rectangle.
False Positive Rate
0 0.2 0.4 0.6 0.8 1
True Positive Rate
0 0.2 0.4 0.6 0.8 1
SVM mean crossval (AUC 0.88) Baseline (AUC 0.85)
LBP Li et al. (AUC 0.83)
Figure 7.3 Comparison among the mean SVM cross-validation ROC, the baseline method the LBP-based method by Li et al. [27] on SMIC E HS.
around the eyes. Completely filtering the eye blink instances would on the other decrease the true positive rate, since the eye blinks often co-occur with MEs or MEs often follow shortly after the eye-blinks.
7.3 Cross-database experiment
False Positive Rate
0 0.2 0.4 0.6 0.8 1
True Positive Rate
0 0.2 0.4 0.6 0.8 1 SVM (AUC 0.97) Baseline (AUC 0.90) LBP Li et al. (AUC 0.93)
Figure 7.4 The ROC curves of the cross-dataset SVM, baseline method and LBP by Li et al. [27] on CASMEII.
False Positive Rate
0 0.2 0.4 0.6 0.8 1
True Positive Rate
0 0.2 0.4 0.6 0.8 1 SVM (AUC 0.81) baseline (AUC 0.83)
Figure 7.5 Comparison of the ROC between the cross-dataset SVM and baseline method on MEVIEW database.
7 Experiments
7.4 Introspection experiments
We measured the impact of particular choices in the pipeline, see Fig.7.6. All the methods are described in Chap.4. Additionally, an option that the face registration was skipped was tested. The ROIs were defined from landmarks independently and were placed based on the location of their landmarks. The size of the regions was derived from the inter-ocular distance and their orientation was defined by the vector connecting the eye centers. This method is further called
withoutRegistration.
A summary of results all tested options is present in Tab.7.1,7.2and7.3. It is observable that the Chehra landmarks [2] are superior to the Intraface landmarks [43] at first sight. We can see that the signal smoothing matters, as the non-smoothed features are inferior. The more detailed introspection follows.
7.4.1 Landmark selection
First, the impact of landmark selection was measured on databases CASME2, see Fig. 7.7
and SMIC E HS, see Fig.7.8. The curves were obtained by fixing either Chehra or Intraface algorithm, and all combination of the rest of the pipeline were depicted on the x-axis. The AUC is compared.
Chehra algorithm outperformed the Intraface algorithm on both databases in almost every case of the rest of the pipeline combinations. The differences are not too significant, especially in situations when the faces were not rectified.
Intraface provides a robust landmark detection for challenging examples, e.g. non-frontal poses, expressions, low facial resolution. Intraface regresses 2D landmark positions directly. While Chehra fits a 3D model doing the estimation of the 3D pose and the output landmarks are the projection of the model. It seems this strategy is more stable for easier frontal poses with neutral expressions. Nevertheless, the differences are rather minor.
7.4.2 Impact of facial rectification
Then, the impact of facial rectification was measured on all three databases, see Fig. 7.9, Fig. 7.10and Fig. 7.11. Four registration methods were fixed and all combinations of land-marks and feature smoothing methods combined. The AUC was compared.
In the laboratory conditions on databases CASME2 and SMIC E HS, the rotation and trans-lation registration method outperformed all other methods, see Fig.7.7and7.8, which confirms
Landmarks ● Intraface ● Chehra Face registratoin ● Without registration ● Rotation and translation ● Similarity ● Phase correlation Feature smoothing ● None ● Moving average ● Polynomial
7.4 Introspection experiments none-withoutRegistration none-rotationAndTranslation none-similarity none-phaseCorrelation moving_avg-withoutRegistration moving_avg-rotationAndTranslation moving_avg-similarity moving_avg-phaseCorrelationpolynomial-withoutRegistration polynomial-rotationAndTranslation polynomial-similarity polynomial-phaseCorrelation 0.86 0.88 0.9 0.92 0.94 0.96 0.98 AUC intraface chehra
Figure 7.7 Comparison of the area under the ROC curve (AUC) between different landmarks for combinations of registration methods and feature smoothing methods in the pipeline for the database CASME2. none-withoutRegistration none-rotationAndTranslation none-similarity none-phaseCorrelation moving_avg-withoutRegistration moving_avg-rotationAndTranslation moving_avg-similarity moving_avg-phaseCorrelationpolynomial-withoutRegistration polynomial-rotationAndTranslation polynomial-similarity polynomial-phaseCorrelation 0.75 0.8 0.85 0.9 AUC intraface chehra
Figure 7.8 Comparison of the area under the ROC curve (AUC) between different landmarks for combinations of registration methods and feature smoothing methods in the pipeline for the database SMIC E HS.
7 Experiments
none-intraface none-chehra
moving_avg-intraface moving_avg-chehra polynomial-intraface
polynomial-chehra 0.86 0.88 0.9 0.92 0.94 0.96 0.98 AUC withoutRegistration rotationAndTranslation similarity phaseCorrelation
Figure 7.9 Comparison of the area under the ROC curve (AUC) among different face registration methods for combinations of smoothing methods and landmark algorithms in the pipeline for the database CASME2.
our expectations. The participants were in stable position. Therefore the scaling factor is re-dundant.
Results of similarity are comparable to rotation and translation. The results on CASME2 and SMIC E HS are slightly worse then rotation and translation. However, on the MEVIEW, similarity outperformed the other two methods more significantly.
The optionwithoutRegistrationsurprisingly outperformed almost all methods on the MEVIEW database, Fig.7.11. The reason might be that participants often change the pose thus the esti-mated transformation (both similarity and rotation and translation) warps a non-frontal facial pose. Placing the landmarks directly to the face can suppress the effect despite the landmark fluctuation. Results of withoutRegistration option on CASME2 database are comparable to similarity described before. The CASME2 videos have the best facial resolution, i.e. the land-marks are supposed to be accurate. Rotation and translation reduce the noise even more. On the other hand, SMIC E HS has a larger margin between the similarity and the registration option
withoutRegistration. The facial resolution is lower and also light conditions are worse than the CASME2 database.
The phase transformation has the worst results on all three datasets. The aim was to compare the template, i.e. each ROI with larger search area in consecutive frames and find the best match within. The expectation was that finding the most correlated match within the ROI nearby area increases the robustness of the method and results in more accurate descriptors. However, the human skin does not contain significant texture. Especially ROIs as forehead or cheeks have the almost featureless surface, and the correlation is not informative.
To provide a more accurate estimate, an improvement could be using a prior displacement that would force the uncertain solution, caused by ambiguity due to the weak texture, to stay close to zero.
7.4 Introspection experiments
none-intraface none-chehra
moving_avg-intraface moving_avg-chehra polynomial-intraface polynomial-chehra 0.75 0.8 0.85 0.9 AUC withoutRegistration rotationAndTranslation similarity phaseCorrelation
Figure 7.10 Comparison of the area under the ROC curve (AUC) among different face registration methods for combinations of smoothing methods and landmark algorithms in the pipeline for the database SMIC E HS. none-intraface moving_avg-intraface polynomial-intraface 0.76 0.78 0.8 0.82 0.84 0.86 AUC withoutRegistration rotationAndTranslation similarity phaseCorrelation
Figure 7.11 Comparison of the area under the ROC curve (AUC) among registration methods for different feature smoothing methods in the pipeline for the database MEVIEW.
7 Experiments withoutRegistration-intrafacewithoutRegistration-chehra rotationAndTranslation-intrafacerotationAndTranslation-chehra similarity-intraface similarity-chehra phaseCorrelation-intrafacephaseCorrelation-chehra 0.86 0.88 0.9 0.92 0.94 0.96 0.98 AUC none moving_avg polynomial
Figure 7.12 Comparison of the area under the ROC curve (AUC) among different feature smoothing methods for combinations of registration methods and landmark algorithms in the pipeline for the database CASME2.
7.4.3 Feature smoothing
In the last experiment, the smoothing methods were compared among each other. The smooth-ing method was fixed and the landmark algorithms and registration method were combined.
The aim was to reduce the noise of the descriptors that might be caused by e.g. inaccurate facial rectification.
On all three plots Fig.7.12,7.13and7.14can be seen that the feature smoothing has positive impact on the accuracy. Moving average and polynomial function fitting have almost the same influence on the AUC measure on all three databases.
7.4 Introspection experiments withoutRegistration-intrafacewithoutRegistration-chehra rotationAndTranslation-intrafacerotationAndTranslation-chehra similarity-intraface similarity-chehra phaseCorrelation-intrafacephaseCorrelation-chehra 0.75 0.8 0.85 0.9 AUC none moving_avg polynomial
Figure 7.13 Comparison of the area under the ROC curve (AUC) among different feature smoothing methods for combinations of registration methods and landmark algorithms in the pipeline for the database SMIC E HS. withoutRegistration-intraface rotationAndTranslation-intraface similarity-intraface phaseCorrelation-intraface 0.76 0.78 0.8 0.82 0.84 0.86 AUC none moving_avg polynomial
Figure 7.14 Comparison of the area under the ROC curve (AUC) among different feature smoothing methods for different registration methods in the pipeline for the database MEVIEW.
7 Experiments
Table 7.1 Results of the pipeline for the CAME2 database of the baseline method.
# Method AUC 1 CASME2-moving avg-rotationandtranslation-chehra 0.96263 2 CASME2-parabolic-rotationandtranslation-chehra 0.96144 3 CASME2-parabolic-similarity-chehra 0.95649 4 CASME2-moving avg-similarity-chehra 0.95592 5 CASME2-parabolic-rotationandtranslation-intraface 0.95371 6 CASME2-moving avg-rotationandtranslation-intraface 0.95049 7 CASME2-parabolic-fft-chehra 0.9504 8 CASME2-moving avg-fft-chehra 0.94777 9 CASME2-parabolic-similarity-intraface 0.9459 10 CASME2-parabolic-withoutRegistration-chehra 0.94356 11 CASME2-parabolic-withoutRegistration-intraface 0.94347 12 CASME2-moving avg-withoutRegistration-chehra 0.94335 13 CASME2-moving avg-withoutRegistration-intraface 0.94279 14 CASME2-moving avg-similarity-intraface 0.94138 15 CASME2-parabolic-fft-intraface 0.93015 16 CASME2-none-rotationandtranslation-chehra 0.9249 17 CASME2-moving avg-fft-intraface 0.92385 18 CASME2-none-similarity-chehra 0.91576 19 CASME2-none-rotationandtranslation-intraface 0.90603 20 CASME2-none-withoutRegistration-intraface 0.90359 21 CASME2-none-withoutRegistration-chehra 0.90189 22 CASME2-none-fft-chehra 0.896 23 CASME2-none-similarity-intraface 0.89047 24 CASME2-none-fft-intraface 0.87381
![Figure 1.1 Muscles of facial expressions, taken from [18].](https://thumb-us.123doks.com/thumbv2/123dok_us/10202224.2923205/14.892.121.730.104.639/figure-muscles-of-facial-expressions-taken-from.webp)
![Table 1.1 Description of several AUs together with the muscle name [13].](https://thumb-us.123doks.com/thumbv2/123dok_us/10202224.2923205/15.892.274.666.136.447/table-description-aus-muscle.webp)

![Figure 4.2 Examples of facial landmarks detected by the Intraface detector [43].](https://thumb-us.123doks.com/thumbv2/123dok_us/10202224.2923205/23.892.163.779.103.404/figure-examples-facial-landmarks-detected-intraface-detector.webp)