LOGGING AND ANALYSIS OF INTERNET OF THINGS (IOT) DEVICE NETWORK TRAFFIC AND POWER CONSUMPTION
A Thesis presented to
the Faculty of California Polytechnic State University, San Luis Obispo
In Partial Fulfillment
of the Requirements for the Degree Master of Science in Electrical Engineering
c 2018 Ryan Frawley
COMMITTEE MEMBERSHIP
TITLE: Logging and Analysis of Internet of Things (IoT) Device Network Traffic and Power
Consumption
AUTHOR: Ryan Frawley
DATE SUBMITTED: June 2018
COMMITTEE CHAIR: Andrew Danowitz, Ph.D.
Assistant Professor of Electrical Engineering
COMMITTEE MEMBER: Foaad Khosmood, Ph.D.
Associate Professor of Computer Science
ABSTRACT
Logging and Analysis of Internet of Things (IoT) Device Network Traffic and Power Consumption
Ryan Frawley
An increasing number of devices, from coffee makers to electric kettles, are becoming connected to the Internet. These are all a part of the Internet of Things, or IoT. Each device generates unique network traffic and power consumption patterns. Until now, there has not been a comprehensive set of data that captures these traffic and power patterns.
This thesis documents how we collected 10 to 15 weeks of network traffic and power consumption data from 15 different IoT devices and provides an analysis of a subset of 6 devices.
Devices including an Amazon Echo Dot, Google Home Mini, and Google Chrome-cast were used on a regular basis and all of their network traffic and power consumption was logged to a MySQL database. The database currently contains 64 million packets and 71 gigabytes of data and is still growing in size as more data is collected 24/7 from each device.
We show that it is possible to see when users are asking their smart speaker a question or whether the lights in their home are on or off based on power consumption and network traffic from the devices. These trends can be seen even if the data being sent is encrypted.
ACKNOWLEDGMENTS
Thanks to:
• My parents for supporting me throughout my academic and professional career. Thanks for being so proud of me.
• Neal Nguyen for helping me set up all of the devices and accounts necessary for each one as well as using them regularly to build up the database. Your real-time graphing tool was a life saver!
• Cal Poly and Cisco for funding this project. We would not have been able to get all of the IoT devices without your help.
• Cal Poly ITS for processing all of our IP addresses and giving us GeoIP infor-mation for each one.
TABLE OF CONTENTS
Page
LIST OF TABLES . . . viii
LIST OF FIGURES . . . ix
LIST OF CODE LISTINGS . . . x
CHAPTER 1 Introduction . . . 1
1.1 Contributions . . . 2
1.2 Thesis Organization . . . 2
2 Background . . . 3
2.1 Privacy Concerns with IoT Devices . . . 3
2.2 Related Work . . . 4
3 Creating an IoT Test Bed . . . 10
3.1 Preparing a Wireless Access Point . . . 10
3.2 Logging Scripts . . . 11
3.2.1 Packet Logging . . . 12
3.2.2 Power Consumption Logging . . . 13
3.2.3 Multiprocessing . . . 16
3.3 Database . . . 17
3.3.1 Network Traffic Table . . . 18
3.3.2 Power Table . . . 21
3.4 IoT Device Selection . . . 22
3.4.1 Smart Speakers . . . 24
3.4.2 Media Players . . . 25
3.4.3 Tablets . . . 25
3.4.4 Video Game Consoles . . . 26
3.4.5 Security Cameras . . . 26
3.5 Device Usage . . . 26
3.5.4 Tablets . . . 28
3.5.5 Security Camera . . . 29
4 Analysis of Logged Device Data . . . 30
4.1 Device Case Studies . . . 34
4.1.1 Google Home Mini . . . 35
4.1.2 Amazon Echo Dot . . . 39
4.1.3 Eufy Genie . . . 40
4.1.4 Eray Security Camera . . . 42
4.1.5 Google Chromecast . . . 46
4.1.6 Amazon Fire TV Stick . . . 50
5 Conclusion . . . 54
5.1 Future Work . . . 55
LIST OF TABLES
Table Page
3.1 Device Name to IP Address Table . . . 18
3.2 Columns in Network Traffic Table . . . 19
3.3 Columns in Power Table . . . 21
3.4 IoT Devices Being Monitored . . . 23
3.5 Event Log Excerpt . . . 27
4.1 Unique IP Addresses Per Country . . . 31
LIST OF FIGURES
Figure Page
3.1 Network Diagram . . . 14
3.2 Smart Speakers Connected to Wemo Insight Switches . . . 15
3.3 Packets Stored in Database . . . 19
3.4 Power Consumption in Database . . . 21
3.5 IoT Devices Under Examination . . . 23
4.1 Map of Countries in Database . . . 32
4.2 Internet and Transport Layer Protocols in Database . . . 34
4.3 SSDP Discovery Request and Presence Announcement . . . 36
4.4 Idle Traffic of Google Home Over 1 Hour Period . . . 37
4.5 Countries Contacted by Google Home Mini . . . 38
4.6 Home Mini Response to News and Weather . . . 39
4.7 Countries Contacted by Echo Dot . . . 39
4.8 Echo Dot Response to Lights . . . 40
4.9 Countries Contacted by Eufy Genie . . . 41
4.10 Eufy Genie Response to Commands . . . 42
4.11 Countries Contacted by Security Camera . . . 43
4.12 Countries Contacted by Security Camera, grouped by amount of data 44 4.13 User Data Sent by NVAS2 Security Camera App . . . 45
4.14 Security Camera Streaming and Pan/Tilt . . . 46 4.15 Chromecast First Time Boot Network Traffic and Power Consumption 47
LIST OF CODE LISTINGS
3.1 Open and Read from a Socket . . . 12
3.2 Reverse DNS Lookup . . . 13
3.3 Wemo Scanning Function . . . 16
3.4 Multiprocessing . . . 17
3.5 Network Table Query . . . 20
Chapter 1 INTRODUCTION
Devices with internet connectivity are becoming increasingly commonplace in homes and businesses. Many of these devices aim to make life more convenient by providing services like voice controlled calendar access or the ability to stream shows and movies directly to a TV [1, 2, 3, 4]. These devices are all part of the Internet of Things (IoT).
IoT devices typically generate much less network traffic than devices like computers or smartphones. The servers that each device communicates with are usually related to the device manufacturer. For instance, Amazon IoT devices primarily talk to Amazon servers and Google devices primarily talk to Google servers. This becomes harder to predict when the device is made by a white label manufacturer.
With so many different IoT devices available today, it is hard to predict what kind of traffic every device is going to generate. Even devices that have a similar purpose can generate wildly different traffic. Devices designed in China tend to send more traffic to China and its surrounding countries than those designed in the United States. The prevalence of IoT devices raises a couple questions: should we be concerned about the data being sent to any servers? Are the IoT devices in our homes spying on us?
All of these connected devices are constantly generating data. A lot of the data generated ends up being sent to a server outside of the local network. On top of
1.1 Contributions
This thesis makes two contributions. The first is the creation of a large database which currently includes 15 weeks of network traffic and power consumption data for 15 different IoT devices. The database will continue to grow after the current 15 week period ends. This database contains 64 million packets totalling 71 gigabytes as well as over 1 million power consumption measurements.
The second contribution is an analysis of the IoT devices in the database. This shows the difference in traffic and power consumption between devices in the same categories. It establishes a baseline for what “normal” traffic and power consumption is for a smart speaker, media player, and more. Part of this analysis includes looking at the amount of data sent and received during normal operations such as asking for the weather or watching TV. Additional metadata including what countries each device sends data to most frequently is also analyzed.
1.2 Thesis Organization
Chapter 2 gives an overview of the Internet of Things, privacy issues that surround the IoT domain, and related work. Chapter 3 details the experimental setup for monitoring IoT devices. In Chapter 4, analysis is performed on the data collected from a subset of the monitored devices. Chapter 5 concludes with a summary of the experiment and analysis and discusses possible future work.
Chapter 2 BACKGROUND
The Internet of Things, or IoT, is the network of a wide variety of devices containing electronics, software, sensors, actuators, and network connectivity. These devices range from simple items like light bulbs that can be controlled over the internet to cars that can be started with a smartphone app. Every IoT device is able to operate within the existing internet infrastructure.
It is becoming increasingly common for devices to connect to the internet. From 2016 to 2017, the number of online capable devices increased from 6.4 billion to 8.4 billion [5]. This is expected to increase to over 20 billion devices by 2020 [5]. The increase in connected devices has the potential to lead to a massive amount of data being collected from the owners of these products. This brings up an important question with regards to privacy: what information is being sent or leaked by each of these devices?
2.1 Privacy Concerns with IoT Devices
Many IoT devices come with a number of sensors including microphones and cameras. This has caused concern over what data is being collected from users without their
While Google and Amazon both state that their speakers do not record any audio unless prompted with the wake word, this may not hold true in the future. Both companies have filed patents for systems that can listen to any conversation without being prompted with the wake word and send targeted advertisements to the users based on their conversation [7, 8]. Smart speakers are not the only devices prone to these kinds of spying. The microphone on a mobile phone could be used for the same purpose.
IoT devices designed in China have been scrutinized closely for potential spying. In 2012, the U.S. General Services Administration removed Hikvision, a Chinese electronics manufacturer, from a list of automatically approved suppliers due to security concerns [9]. The Department of Homeland Security also issued a cybersecurity warning saying that a loophole in certain Hikvision cameras made it easy for hackers to exploit and view the camera’s video stream [10]. Some U.S. security vendors also stopped selling Hikvsion cameras over concerns that they may be being used by China to spy on U.S. citizens [9]. Four years later, the smartphone maker BLU was caught putting spyware on its users’ phones which sent their text messages, real-time location information, and other personal information to a server in China [11].
Many IoT devices are also open to exploits that could let unknown attackers steal data from the owners. A lot of devices, especially generic ones with no brand name, use weak default usernames and passwords like “admin:admin” or “admin:1234” or have no password protection at all. This has lead to many different IoT-centered attacks including Stuxnet [12], Mirai [13], Brickerbot [14], and the botnet barrage [15].
2.2 Related Work
algorithms to accurately identify IoT devices [16]. In the paper, researchers first collected network traffic data from 13 different devices. These devices included both IoT and non-IoT devices. Some of the IoT devices included a refrigerator, a security camera, a thermostat, and a TV. The non-IoT devices included two computers and two smartphones. The devices were connected to a WiFi access point and the network traffic was recorded using Wireshark.
After the traffic data was collected, the researchers performed feature extraction [17] on the data. The first feature extraction was performed on TCP packets. Unique 4-tuples consisting of source and destination IP addresses and port numbers were created for each packet. These 4-tuples are called sessions. The sessions were then represented by a vector of features from the network, transport, and application layers. They were also enriched with data like the Alexa Rank [18] and GeoIP [19] information.
The paper describes a multi-stage process in which a set of machine learning based classifiers are applied to a stream of sessions that originate from a specific device. The goal of this process was to determine whether the traffic belonged to a PC, smartphone, or a specific IoT device. The classifier uses packet metadata and payload data to perform its classification. For instance, smartphones were classified using the “user agent” HTTP property and this yielded a classification accuracy of 100 percent. The classifier had an accuracy of 99.281 percent for identifying specific IoT devices.
This paper briefly described the process of data acquisition for IoT devices, but there was not much hand-done analysis on the data. The paper describes some of the features used to train a model and describes the algorithms used to classify traffic, but there are not any graphs describing the traffic observed. This would have made it easier to understand how the traffic generated by each device differed. Additionally, the paper only describes the logging of network traffic of the devices. There is no mention of power consumption logging.
Later in the year, the authors of [16] published a second paper, Detection of Unauthorized IoT Devices Using Machine Learning Techniques [20]. This paper describes the process of detecting unauthorized IoT devices on a network using machine learning techniques. The data collection portion of this paper is much more detailed than the first. Network traffic data was collected and labeled from 17 different IoT devices covering 9 different categories. In this paper, the network was set up to reflect a common enterprise practice in which devices are connected over WiFi to several access points wire-connected to a switch that is connected to a router. Port mirroring was performed on the switch to sniff the devices’ network traffic which was recorded to a local server using Wireshark [21].
TCP packets were broken down into the same 4-tuples from the first paper [16]. The research was performed in two different countries, so the same setup was mirrored in both labs to evaluate model transportability. The feature extractor from [17] was used to convert the data to vectors. These vectors included 274 different features labeled with the device type. The data was then partitioned into training, testing, and validation sets. A model was trained using similar techniques from [16] using IP streams and the features extracted from TCP packets.
white listed devices were correctly classified by their specific device type. The most important features for identifying an IoT device were the TCP time to live (TTL) minimum, the TCP TTL first quartile, and TCP TTL average. The model presented in the paper is also transportable, meaning that is able to be deployed in different locations and networks and still have a high success rate.
The focus of the paper is machine learning techniques, so many of the finer details of the traffic patterns are lost. Additionally, the paper does not cover any power consumption statistics for the devices.
In the paperA Smart Home is No Castle: Privacy Vulnerabilities of Encrypted IoT Traffic, researchers found that it is possible to identify IoT devices based on network traffic patterns and DNS [22] packets being sent [23]. Furthermore, it is possible to reveal information about a user even if all of the traffic is encrypted. For instance, by plotting the bytes per second being sent or received from a device, it is possible to tell when users are asking their Amazon Echo a question. Examining traffic spikes on a sleep sensor can reveal when the user goes to sleep or wakes up.
The devices covered in this paper were a Sense sleep monitor, a Nest security camera, a Belkin Wemo switch, and an Amazon Echo. Each device had unique traffic patterns that made it possible to both identify what device the traffic was coming from. Beyond looking at network throughput, examining DNS queries showed which device was sending traffic. Almost all of the devices send DNS traffic to servers that no
A Smart Home is No Castle: Privacy Vulnerabilities of Encrypted IoT Traffic goes into more depth in analyzing the traffic captured and using graphs to show the data. Many of the traffic patterns described in the paper also show up in Chapter 4 of this thesis. However, the dataset used in [23] is much smaller than either [16] or [20]. The number and types of IoT devices examined are also more limited and no power consumption is taken into consideration since the goal of the paper was to identify traffic from outside of the network.
The analysis performed inAn Analysis of Home IoT Network Traffic and Behaviour is much closer to what is done in Chapter 4 of this thesis [24]. The primary purpose of the paper is to analyze network traces from a test bed of common IoT devices, describe general methods for fingerprinting their behavior, and assess where privacy and security risks manifest. The test bed contained 14 common IoT devices including an Amazon Echo, Samsung SmartThings Hub, Apple iPad, and more. These devices are also all monitored in this thesis.
The devices were used and monitored for 22 days before the collected packets were analyzed. The paper shows that it is possible to associate specific devices with network traffic even if protection methods like MAC address randomization are used. This can done with something as simple as looking at DNS requests to see what websites the devices are asking for. Some of the devices also used HTTP packets to send or receive all data, so it was possible to extract API keys and hijack devices.
The majority of the traffic transmitted during the 22 day monitoring period was TCP traffic. This was true for all but the Philips Hue Bridge, Amazon Echo, and Ubiquiti Access point, which primarily sent UDP traffic. The paper goes on to break down the traffic sent by all 14 of the monitored devices. Many of the traffic patterns noted in the paper hold true in this thesis.
The analysis performed in [24] shows the breakdown of what normal traffic looked like for 14 different common IoT devices. However, the data collected only covered a period of three weeks. Additionally, the paper did not monitor multiple devices from different manufacturers in the same category. For instance, the only smart speaker being monitored was the Amazon Echo. Additionally, there is no mention of power consumption for the monitored devices.
The device monitoring portions of [16, 20, 23, 24] started to build databases containing network traffic for different IoT devices, but the monitoring periods were not long enough to create a comprehensive database. The experiments performed in these papers did not present a clear comparison between devices in the same category. All of the papers focused only on network traffic behavior, which gives only a partial view of how each device normally behaves. In this thesis, we go beyond the monitoring and analyses performed in these papers by monitoring the network traffic and power consumption of IoT devices for 15 weeks. We include more devices in the same category to provide a comparison between the traffic and power consumption of three different smart speakers and two different streaming devices.
Chapter 3
CREATING AN IOT TEST BED
To create a baseline for network traffic and power consumption for our IoT devices, we set up a database and use-cases to log this data. This chapter documents how we create a Python script that logs all network traffic from our devices. It also documents how we obtain power consumption data by using Belkin Wemo Insight switches [25]. All of this data is stored in a MySQL database that was configured using Amazon Relational Database Service (Amazon RDS) [26].
3.1 Preparing a Wireless Access Point
To log network and power usage, we configured an Intel NUC [27] to act as a wireless access point. This provides a convenient package that is as compact as a wireless router while providing the ability to run almost any software. In its current configuration, our NUC is using Ubuntu as its primary operating system. We chose Ubuntu so we could run the Python scripts used to both capture the data and send it to our MySQL database.
The Intel NUC comes with an internal wireless antenna that can be used to connect to wireless networks. Initially, this antenna was used to broadcast the wireless local area network that all of the IoT devices connect to, but this caused problems. The internal antenna was originally intended to be used to connect to a network and allow the NUC to act as a wireless client. The antenna was not able to handle the load of all of the IoT devices communicating simultaneously. This caused frequent network outages because the antenna was not able to support the amount of data
being transmitted simultaneously between all of the devices on the network. In order to alleviate this problem, an external USB antenna is used instead.
The NUC receives an internet connection through its on-board Ethernet port. The connection is then shared to the external USB antenna using the open source create ap script [28]. The script enables two network interfaces to share an internet connection using network address translation (NAT) [29]. This allows the NUC to act as a wireless access point to which all of the IoT devices can connect to. The access point is configured to use the WPA2 [30] security protocol on an 802.11n [31] network. Using this setup, we are able to achieve consistent download and upload speeds of about 30 megabits per second. We found that this is more than enough to perform day-to-day activities like streaming content from YouTube or downloading games on the consoles.
3.2 Logging Scripts
The NUC is configured to log the network traffic and power consumption of every device that is connected to it. This is accomplished using a Python script. This script connects to the database that it used to store all of the logged information about each device. If the connection to the database is ever lost, the script will automatically attempt to reconnect. We send the data to our database using the mysqlclient [32] package. From there, the program is split into two major sections.
3.2.1 Packet Logging
The first and largest part of the script handles all of the packet logging for any devices on the LAN. This portion of the script makes use of sockets to capture all of the data sent or received on the network. A socket is opened on the wireless interface and all IP packets are read from the socket. This is shown in Listing 3.1.
s e l f . s o c k e t = s o c k e t . s o c k e t ( s o c k e t . A F _ P A C K E T , s o c k e t . S O C K _ R A W , s o c k e t . h t o n s ( E T H _ P _ A L L ) ) s e l f . s o c k e t . s e t s o c k o p t ( s o c k e t . S O L _ S O C K E T , s o c k e t . S O _ R C V B U F , 2 * * 3 0 ) s e l f . s o c k e t . b i n d (( s e l f . i n t e r f a c e _ n a m e , E T H _ P _ A L L ) ) w h i l e T r u e : packet , a d d r e s s = s e l f . s o c k e t . r e c v f r o m ( MTU )
Listing 3.1: Open and Read from a Socket
After a packet is captured from the socket, the data stored in the headers of the packet is extracted for use in the database. This includes information like packet size, source and destination ports, and transport or internet layer protocol. The script is able to handle both IPV4 and IPV6 addresses. Storing packet metadata makes searching for packets in the database much easier. To make finding traffic for specific devices easier, we assign static IP addresses to each device using dnsmasq [33].
Each entry is supplemented with additional data in the form of the hostname of the source and destination IP addresses. The script attempts to perform a reverse DNS lookup to get the hostname of the source and destination IP addresses. The reverse DNS lookup does not work on any of the monitored devices, but it works for most of the external IP addresses. The reverse DNS lookup is accomplished using the gethostbyaddr function as shown in Listing 3.2.
try:
s r c _ h o s t n a m e = s o c k e t . g e t h o s t b y a d d r ( s o c k e t . i n e t _ n t o p ( family , src ) ) [0]
e x c e p t s o c k e t . h e r r o r : s r c _ h o s t n a m e = " N / A "
Listing 3.2: Reverse DNS Lookup
3.2.2 Power Consumption Logging
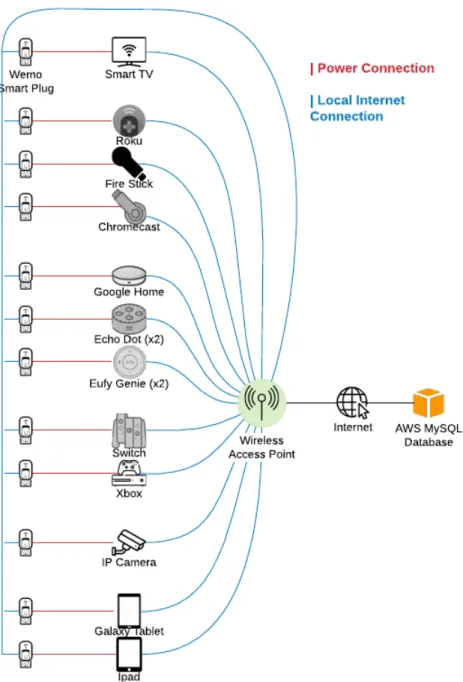
The second half of the logging script records the power usage of every IoT device. This is accomplished using Belkin Wemo Insight switches [25] on each device that is being monitored. Each Insight is plugged into an outlet and then the device that is being monitored is connected to the outlet on the Insight. Each Insight is connected to the wireless LAN that the IoT devices are connected to. The script communicates with all of the Insights using the pyWeMo module [34]. This lets the wireless access point read the current power usage on every Insight once every second. The Insight is capable of reading both the current power in milliwatts as well as the daily energy use in kilowatt hours. This setup is illustrated in Figures 3.1 and 3.2.
Figure 3.2: Smart Speakers Connected to Wemo Insight Switches
If an Insight switch switch becomes unreachable, the script will attempt to reach the Insight three times. If it cannot establish a connection with the Insight after three attempts, the script rescans the network for all Insights and continues logging power usage. Due to limitations with the pywemo library, this scan does not always find all of the Insights on the network. For this reason, the script is configured to scan until it discovers a minimum of 15 different Insight switches. This value was selected based on the number of devices that we are currently monitoring. The scanning functionality is shown below in the scan until all found function in Listing 3.3.
def s c a n _ u n t i l _ a l l _ f o u n d () : p r i n t(" D i s c o v e r i n g W e m o s ") s w i t c h e s = p y w e m o . d i s c o v e r _ d e v i c e s () p r i n t(" D i s c o v e r e d {} s w i t c h e s ".f o r m a t(len( s w i t c h e s ) ) ) p r i n t( s w i t c h e s ) t r y _ n u m = 1 w h i l e len( s w i t c h e s ) < 15: p r i n t(" Did not d i s c o v e r e n o u g h s w i t c h e s , t r y i n g a g a i n { } . . . ".f o r m a t( t r y _ n u m ) ) s w i t c h e s = p y w e m o . d i s c o v e r _ d e v i c e s () t r y _ n u m += 1 p r i n t(" D i s c o v e r e d {} s w i t c h e s ".f o r m a t(len( s w i t c h e s ) ) ) r e t u r n s w i t c h e s
Listing 3.3: Wemo Scanning Function
3.2.3 Multiprocessing
Both halves of the script contain code that will automatically restart logging if it ever stops. Additionally, the logging portions of the script run in two separate processes separate from the main process. The network and power logging sections of the script each run in their own process in order to provide more stability in the case of a crash. This is done to ensure that even if one portion of the logging encounters an issue, the other will be able to continue as normal. In the main process, each logging process is repeatedly polled to check if it is still running and automatically restarted if it has terminated. Multiprocessing is accomplished with the code in Listing 3.4.
p1 = P r o c e s s ( t a r g e t = i p _ s n i f f . recv , a r g s =( cursor ,) ) p1 . s t a r t () p2 = P r o c e s s ( t a r g e t = m o n i t o r _ p o w e r , a r g s =( cursor1 ,) ) p2 . s t a r t () p1 . j o i n () p2 . j o i n () w h i l e T r u e : t i m e . s l e e p ( 0 . 5 ) for p in [ p1 , p2 ]: if not p . i s _ a l i v e () : p r i n t(" R e s t a r t i n g p r o c e s s ... ") p . s t a r t () p . j o i n () Listing 3.4: Multiprocessing 3.3 Database
The data collected by the scripts in section 3.2 is stored in an Amazon RDS [26] MySQL database. There are two tables in the database that are used for logging information from the IoT devices. Limiting the database to two tables makes finding logged data easier. The first table is the network traffic table which is used to store all of the packets sent or received by the devices. This table is where the majority of
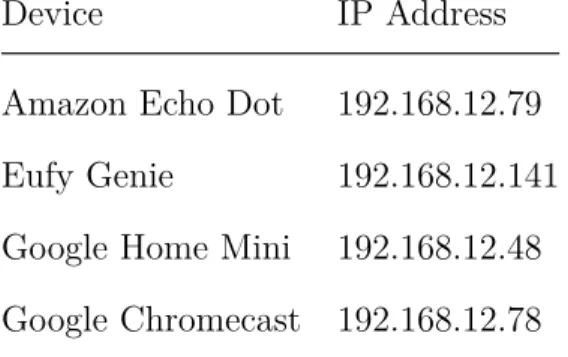
address. This is done in a separate spreadsheet. Table 3.1 shows a portion of this sheet.
Table 3.1: Device Name to IP Address Table
Device IP Address
Amazon Echo Dot 192.168.12.79 Eufy Genie 192.168.12.141 Google Home Mini 192.168.12.48 Google Chromecast 192.168.12.78
3.3.1 Network Traffic Table
Every packet that is sent or received by any device on the network is logged and stored in a MySQL database [35]. MySQL was chosen based on its ease of use and broad support. Hosting the database using Amazon RDS [26] allows for access to any logged information from any location and provides backups and scalability. MySQL is particularly well suited for this dataset because it allows for filtering between specific time ranges and IP addresses.
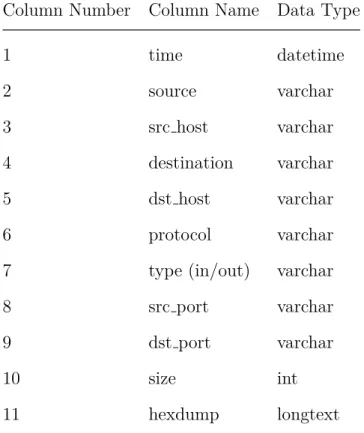
The network traffic table contains multiple columns to allow for easy searches through the database for specific packets. The columns in use are shown in Table 3.2
Table 3.2: Columns in Network Traffic Table
Column Number Column Name Data Type
1 time datetime 2 source varchar 3 src host varchar 4 destination varchar 5 dst host varchar 6 protocol varchar
7 type (in/out) varchar
8 src port varchar
9 dst port varchar
10 size int
11 hexdump longtext
As an example of what a packet looks like when it is stored in the database, refer to Figure 3.3. Each line represents a separate packet that is stored in the database.
The packet logging table contains about 64 million rows, or 64 million packets. These 64 million packets contain about 71 gigabytes worth of data. Due to the table size, searches can be extremely slow. The source IP, destination IP, and time columns are configured as indexes in the table in order to speed up searches. These columns are the most common ones used to find packets. To get all of the traffic generated by the Google Home Mini for 1 hour, the SQL query in Listing 3.5 can be used. Note that the IP address of the Home Mini is 192.168.12.48, so that is what is used in the query. S E L E C T * F R O M i p _ l o g . ip W H E R E t i m e B E T W E E N ’ 2018 -05 -01 1 3 : 0 0 : 0 0 ’ AND ’ 2018 -05 -01 1 4 : 0 0 : 0 0 ’ AND ( s o u r c e =’ 1 9 2 . 1 6 8 . 1 2 . 4 8 ’ OR d e s t i n a t i o n =’ 1 9 2 . 1 6 8 . 1 2 . 4 8 ’) O R D E R BY t i m e ASC
Listing 3.5: Network Table Query
The hexdump column contains a hexdump of every packet that was logged for every device so far. This allows users to import a log of all the network traffic over a specific time window or device into Wireshark for easy parsing. Using this column is useful for monitoring the packets sent during the first time boot-up of a device or any packets sent or received during an update. The majority of the packets in this column are encrypted using TLS/SSL [36], but useful information can still be gathered from the metadata of the packet. The packet metadata can reveal information about an IP address like the owner of the address, the host name, or the geographic location of the IP address.
3.3.2 Power Table
The power usage of each device is logged and stored in a separate table in the database. The power table contains about 15 million measurements and occupies 1 gigabyte of space. This table is much smaller than the network traffic table for two reasons. First, the frequency that data is logged to the table is much lower, at one reading per second. Second, the only data types stored in the table are varchars, integers, and datetime timestamps - there are no large fields like hexdump. The table is comprised of the columns listed in Table 3.3.
Table 3.3: Columns in Power Table
Column Number Column Name Data Type
1 name varchar
2 power mw int
3 time datetime
4 today kwh varchar
5 on for varchar
6 today on time varchar
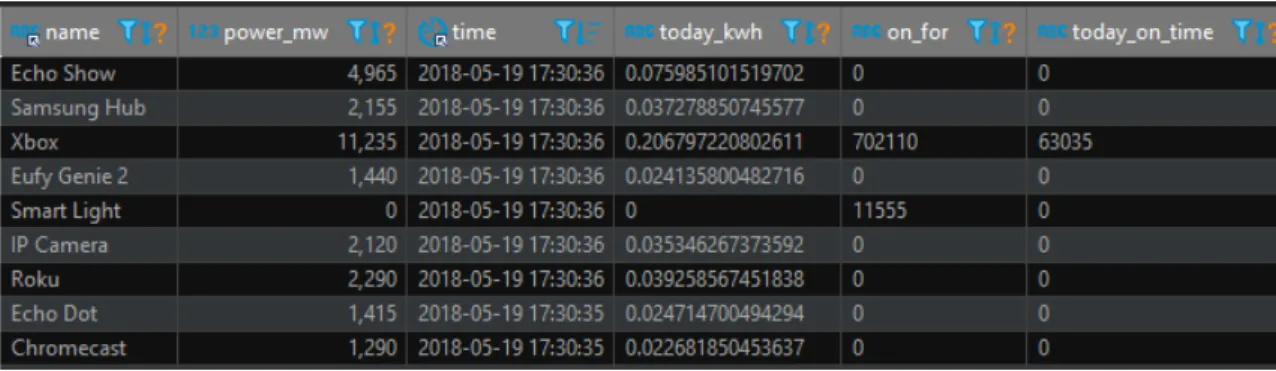
Figure 3.4 shows what the power consumption data looks like when it is stored in the table.
Similar to the packet logging table, the power logging table contains indexes in order to speed up searches. The time and device name columns are configured as indexes because these are the most commonly used features for filtering. Device names come from the Wemo Insight switches which were named by hand when we set them up. This makes it easy to filter out the power usage of a device when it is performing an update or idling to compare the power usage. To get the power consumption for an hour for the Echo Dot, the SQL query in Listing 3.6 can be used.
S E L E C T time, p o w e r _ m w F R O M i p _ l o g . p o w e r
W H E R E t i m e B E T W E E N ’ 2018 -05 -19 2 1 : 1 0 : 0 8 ’ AND ’ 2018 -05 -19
2 2 : 1 0 : 0 8 ’ AND n a m e =’ E c h o Dot ’
O R D E R BY t i m e ASC
Listing 3.6: Power Table Query
3.4 IoT Device Selection
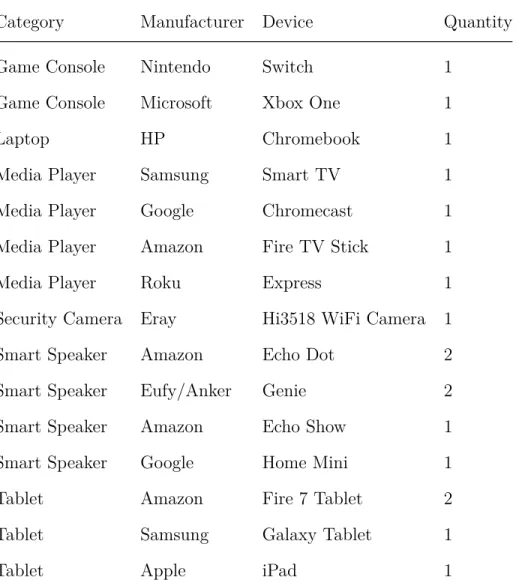
In order to obtain a dataset that encompasses what many home’s IoT network traffic might look like, we have a broad set of devices. We did this to create a superset of consumer devices. The majority of the devices were selected based on the market share they hold in the United States. Using similar devices made by different manufacturers also provides an interesting comparison between multiple IoT devices. A list of all of the devices being monitored can be seen in Table 3.4 and a picture of the devices is shown in Figure 3.5.
Table 3.4: IoT Devices Being Monitored
Category Manufacturer Device Quantity
Game Console Nintendo Switch 1
Game Console Microsoft Xbox One 1
Laptop HP Chromebook 1
Media Player Samsung Smart TV 1
Media Player Google Chromecast 1
Media Player Amazon Fire TV Stick 1
Media Player Roku Express 1
Security Camera Eray Hi3518 WiFi Camera 1
Smart Speaker Amazon Echo Dot 2
Smart Speaker Eufy/Anker Genie 2
Smart Speaker Amazon Echo Show 1
Smart Speaker Google Home Mini 1
Tablet Amazon Fire 7 Tablet 2
Tablet Samsung Galaxy Tablet 1
Every device that is being monitored required an email address to set up the device for the first time. A unique email address was created for each device in order to keep the data as “clean” as possible: if two devices from different manufacturers discover each other and communicate, we want to ensure that this behavior does not occur because the devices are linked to the same account. Most of the devices only made use of the email address for the initial login to associate an account with the device.
3.4.1 Smart Speakers
Smart speakers like the Amazon Echo and Google Home are among the most common IoT devices present in U.S. households. As of January 2018, 39 million Americans, or about 16 percent of the population, owned a smart speaker [37]. This number is expected to grow to 175 million (55 percent of U.S. households) by 2022 [38]. Smart speakers are one of the most common IoT devices present in homes.
Devices from multiple manufacturers are used within the smart speaker category to reflect the U.S. market. One of the smart speakers that is being monitored is the Amazon Echo Dot. Amazon’s smart speakers made up 72 percent of the market share in January 2018 [39]. The Echo is able to tell the weather, set alarms, play music, read the news, set reminders, and more. By default, it downloads updates automatically in the middle of the night.
3.4.2 Media Players
Media Players with the ability to stream content from the internet are quickly becoming a popular way to watch TV. In 2017, 60 percent of young adults in the U.S. primarily used online streaming to watch TV [40]. The most common media players in the U.S. are the Roku, Chromecast, and Fire TV respectively. These have a combined user base of over 110 million users who watch content at least once a month [41]. We selected these three devices based on their popularity and the fact that they are all produced by different companies.
3.4.3 Tablets
The tablets purchased cover the three most popular manufacturers. Samsung tablets, Apple tablets, and Amazon tablets make up about half of the tablet market. Of these brands, Apple is the most popular with 30 percent of the market share [42]. The tablets also provide a convenient method for setting up and controlling the other IoT devices. Many of the devices must be set up with an Android or iOS app, so having at least one tablet was a necessity.
We chose not to monitor any devices running Windows or macOS. We chose to focus on devices running Chrome OS, Android, iOS, and Fire OS. The devices running these operating systems tend to be more dependent on manufacturer specific services and servers: Android devices are closely tied into Google’s servers, and Amazon
3.4.4 Video Game Consoles
In addition to the smaller IoT devices discussed previously, two game consoles are also monitored. These include the Nintendo Switch [43] and the Microsoft Xbox One [44]. These were selected because they are both in the newest generation of consoles and they are two out of the three most popular consoles in 2018. As of January 2018, the Xbox One sold 25-30 million units [45] and the Switch sold 17.8 million units [46].
3.4.5 Security Cameras
Only one security camera is being monitored. The camera is sold by Eray, but it makes use of the same firmware that many generic IP cameras are based on. Cameras that use this firmware have been known to send secure data unencrypted to servers during the setup process [47]. Additionally, IP cameras similar to the Eray camera were one of the main targets of the Mirai malware [13]. We wanted to compare the traffic of a generic device to traffic generated by devices made from well known companies like Google or Amazon. The Eray camera in particular has a default password of “123” which is a very weak password. Cameras with default passwords are often easily accessible to attackers outside of the network. We were interested in seeing if any unauthorized parties accessed the camera.
3.5 Device Usage
One of the main goals of this thesis is to create a dataset that represents a baseline of “normal” network traffic and power usage. For this reason, every device has a fixed set
Performing the same activities every time establishes a baseline of what kind of traffic should be expected. This includes the amount of data being sent or received as well as the IP addresses that the data is going to or coming from.
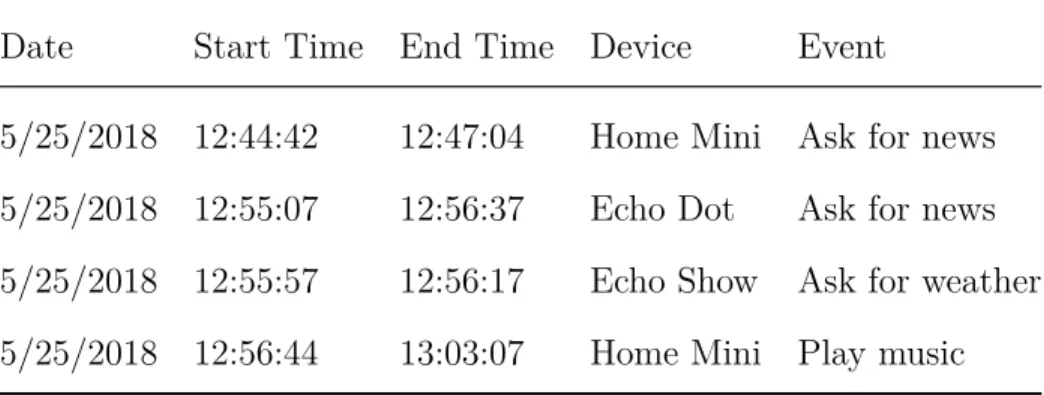
Every time a device is used, we log what we did with the device into a table. This table includes the date that the action was performed on, the start and end times of the action, the device used, what the action was, and any notes on the action. This allows us to easily correlate network traffic and power consumption with events that were logged in the table. An example of four entries in this table is shown in Table 3.5.
Table 3.5: Event Log Excerpt
Date Start Time End Time Device Event
5/25/2018 12:44:42 12:47:04 Home Mini Ask for news 5/25/2018 12:55:07 12:56:37 Echo Dot Ask for news 5/25/2018 12:55:57 12:56:17 Echo Show Ask for weather 5/25/2018 12:56:44 13:03:07 Home Mini Play music
3.5.1 Smart Speakers
Each smart speaker is prompted to read the weather, read the news, and play music every time it is used. Once a week, we ask the speakers to set a reminder for the future. Each speaker is also muted for a few minutes to see if there are any noticeable
demos are available. When we are done using the Switch, we put it into sleep mode. We turn the Xbox One off when we are done using it. The Switch is not turned off because when it is docked, it is only possible to put the console into sleep mode.
3.5.3 Media Players
The Chromecast, Roku, Fire TV, and Samsung TV are all used to watch YouTube videos. The videos watched on each device vary in order to more accurately represent normal viewing patterns. We also control each device using both a tablet to cast a video to the device and the remote that came with each device.
3.5.4 Tablets
Each tablet is used to browse the web, watch YouTube, and use different apps. The tablets are also used to view and control the security camera using the NVAS2 app. All of the tablets were used for the initial setup of the other IoT devices that needed an app to complete the setup. This process involves creating an account for each device and then connecting the device to the wireless access point.
3.5.5 Security Camera
The security camera’s video stream is viewed on the tablets. The tablets also have the ability to move the camera using its built in motors. Each time the camera is used, it is panned and tilted around and the stream is usually viewed for a total of two to three minutes. After this, we disconnect the tablet from the camera by using the “end stream” button in the NVAS2 app on the iPad.
Chapter 4
ANALYSIS OF LOGGED DEVICE DATA
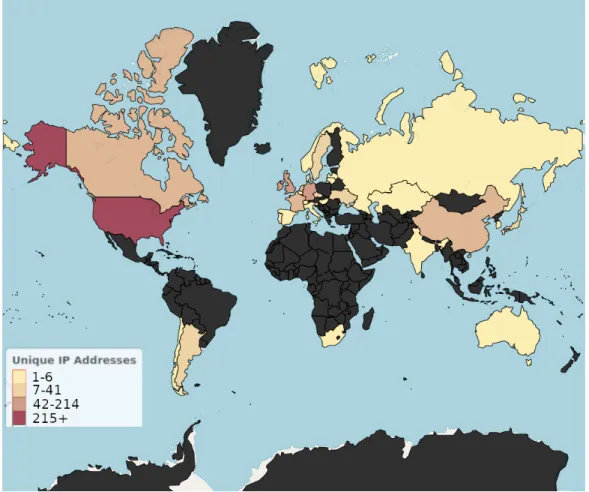
To date, the database contains about 12 weeks worth of data. The complete network traffic table contains 64 million packets and 71 gigabytes worth of data. Looking at the traits of the overall dataset reveals some interesting trends about the data. Using GeoIP data provided by Cal Poly ITS [48], we are able to see where each IP address is located and who owns it. The dataset contains 13,500 unique IP addresses for servers in 36 countries that the devices are communicating with. Out of the 13,500 IP addresses, 12,471 (92 percent) of the addresses are in the United States [48, 19]. The next two countries are Ireland and Germany with 214 and 136 IP addresses respectively. The results for each country can be seen in Table 4.1 and are mapped in Figure 4.1.
Several countries only have a single IP address associated with them. These include Belgium, Chile, Hungary, Italy, Kazakhstan, Latvia, Lithuania, Portugal, and Slovenia. Most of these IP addresses are used to get the current time. This is accomplished using Network Time Protocol (NTP) packets [49]. The IP addresses located in Belgium and Italy are both content distribution network servers owned by Akamai Technologies Inc.
Table 4.1: Unique IP Addresses Per Country Country IP Addresses United States 12471 Ireland 214 Germany 136 United Kingdom 103 Canada 45 China 44 Netherlands 42 France 34 Hong Kong 13 Japan 12 Argentina 12 Singapore 10 Ukraine 9 Czech Republic 8 Sweden 7 Switzerland 4 Australia 4 Russia 4 Country IP Addresses Taiwan 4 Spain 3 Denmark 3 Guam 2 India 2 South Korea 2 Norway 2 Portugal 1 Slovenia 1 Hungary 1 South Africa 1 Belgium 1 Chile 1 Lithuania 1 Italy 1 Kazakhstan 1 Latvia 1
Figure 4.1: Map of Countries in Database
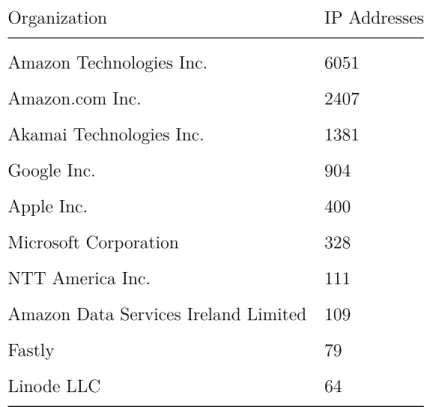
We can also look at which organization owns each IP address in the database. Using information from the GeoIP [19] lookup, we can see which organization owns the autonomous system that each IP as a part of. The database contains IP addresses owned by 374 different organizations. The top 10 are shown in Table 4.2. Amazon owns 65 percent of the IP addresses in the database. This is likely due to the fact that Amazon Web Services (AWS) owns 34 percent of the cloud computing market [50] as well as providing web hosting and content distribution networks. Many of the organizations in Table 4.2 are not far behind Amazon in terms of cloud share. Microsoft, Google, and NTT are all heavily involved in the cloud market.
Table 4.2: Top 10 Organizations by IP Addresses Owned
Organization IP Addresses
Amazon Technologies Inc. 6051
Amazon.com Inc. 2407
Akamai Technologies Inc. 1381
Google Inc. 904
Apple Inc. 400
Microsoft Corporation 328
NTT America Inc. 111
Amazon Data Services Ireland Limited 109
Fastly 79
Linode LLC 64
Using the protocol field of the table, we can also see which internet and transport layer protocols are the most common in the database. Figure 4.2 shows a breakdown of the most common protocols in the database. The majority of the traffic transmitted or received by all of the devices was TCP traffic. Within this TCP traffic, most of the traffic was encrypted TLS/SSL packets. The next most common protocol was UDP. All of the SSDP [51] packets were sent over UDP and most of the video and audio streams also used UDP. All of the ICMP packets were ping requests and replies from
Figure 4.2: Internet and Transport Layer Protocols in Database
4.1 Device Case Studies
The majority of the traffic sent or received by the IoT devices are encrypted TLS/SSL packets. Because of this, most of the analysis performed was on packet metadata including the source and destination IP, port numbers, packet protocol, and packet size. The packet metadata provides information for differentiating between IoT devices. The few packets that are sent unencrypted give an insight into what kind of data each device is sending to both first and third party servers.
In this section, we analyze six different devices covering three different categories. The first three devices are the Google Home Mini, Amazon Echo Dot, and Eufy Genie. These three devices are smart speakers with many of the same capabilities, such as reading the news or playing music, so we wanted to see how their traffic and power
and the Genie since they both use Alexa. Next, we analyze the traffic from the Eray security camera. The camera is one of the only generic devices that we are monitoring and we wanted to see how its traffic differed from name-brand devices. Finally, we analyze the Google Chromecast and the Amazon Fire TV Stick because they are both media streaming devices made by different companies.
4.1.1 Google Home Mini
The Home Mini has a fairly predictable traffic pattern when idling. Once every minute, the Home Mini broadcasts an SSDP (Simple Service Discovery Protocol) [51] discovery request packet to every device on the local network. Every device that supports UPnP (Universal Plug and Play) [52] then responds to the Home Mini with information about the location of the .xml file describing the device, the operating system on the device, and more.
Figure 4.3 shows what the contents of the SSDP packets look like. The first packet, the discovery request packet, is sent from the Home Mini. The second packet, the presence announcement, comes from the Eufy Genie. Each device announces its presences with a packet similar in structure.
Figure 4.3: SSDP Discovery Request and Presence Announcement
This allows the Home Mini to communicate with devices and perform actions like playing music or videos on other devices. In addition to this internal traffic, the Home Mini also sends encrypted TCP traffic to Google servers every 10 minutes. This can be seen in Figure 4.4. The small periodic spikes in the figure are the SSDP packets being sent to the Home Mini while the larger spikes are the TCP traffic being sent to Google. It is the only device out of all of the IoT devices we have that broadcasts SSDP discovery request packets this frequently.
Figure 4.4: Idle Traffic of Google Home Over 1 Hour Period
The Home Mini communicates with IP addresses in only two countries. These include the United States and Canada, as seen in 4.5. Like the Echo Dot and the Eufy Genie, the majority of the traffic is with servers with American IP addresses. Both the Eufy Genie and the Echo Dot communicate with Asian IP addresses. A larger portion of the Home Mini’s traffic is also sent or received locally rather than by external IP addresses. This is due to the fact that the Home Mini regularly performs SSDP searches. The Home Mini is closer to the Eufy Genie in terms of the number of IP addresses it talks to at 197 IP addresses. The companies owning the IP addresses
Figure 4.5: Countries Contacted by Google Home Mini
Using data from the power consumption and network traffic tables, we are able to correlate user actions with patterns in the data. For example, Figure 4.6 shows what happens when we asked the Home Mini a few different questions. First, we prompted the Home Mini with its wake word “hey Google” at which point it started listening for a command. This can be seen by the jump in power consumption from 1200 to 1500 mW. We then asked for the news. At this point, the Home Mini sends about 5 kB of data to a Google server. About 5 seconds later, it started receiving a stream of UDP packets which were the audio of the news feed. After about a minute, we told the Home Mini to stop playing the news. This can be seen by the second spike in power consumption. Next, we asked for the weather. This can be seen by the third spike in power consumption around 1:39PM. The Home Mini sent out another 4 kB to Google servers before receiving 3 kB back and then reading the weather. Over this period, the regularly intervaled SSDP packets are still sent which can be seen by the
Figure 4.6: Home Mini Response to News and Weather
4.1.2 Amazon Echo Dot
Over 99 percent of the IP addresses that the Echo Dot communicates with are located in the United States. Other than the U.S., the Echo Dot communicates with 4 IP addresses in Hong Kong, 2 in Canada, and 2 in Hungary. This is reflected in Figure 4.7.
The network traffic of the Echo Dot is not the only data that separates it from the other devices. The power consumption shows when users are performing certain events. For example, the Echo Dot contains a light sensor that it uses to change the brightness of the LEDs on the device. If the Echo Dot is in a bright area, the LEDs glow brighter and vice versa. Using this feature, we can determine when users have the lights turned on or off in their home. Figure 4.8 shows three distinct areas where the lights are turned on and the LEDs are lit brighter. This causes the Echo Dot to consume about 2200 mW of power rather than its usual 1500 mW.
Figure 4.8: Echo Dot Response to Lights
4.1.3 Eufy Genie
The Eufy Genie, a third party Echo Dot alternative with Alexa support, has a slightly different pattern. As shown in Figure 4.7, over 99 percent of the IP addresses that the Echo Dot communicates with are located in the United States. This amount is much lower for the Eufy Genie at 73 percent as seen in Figure 4.9.
Genie. The Genie communicates with 191 different IP addresses and the Echo Dot communicates with 2,310 IP addresses. The companies that own these IP addresses differ between the two devices also. Both devices primarily communicate with IP addresses owned by Amazon, but the Genie also communicates with IP addresses owned by ChinaNet, Shenzhen Tencent Computer Systems Company Limited, Tencent Cloud Computing (Beijing) Co. Ltd., Baidu Hong Kong Limited, and China Education and Research Network Backbone. None of these IP addresses are present in the Echo Dot’s traffic.
Figure 4.10: Eufy Genie Response to Commands
4.1.4 Eray Security Camera
In contrast to the smart speakers, about half of the servers that the security camera communicates with are located in China. This can be seen in Figure 4.11. About 24 percent of the IP addresses are located in the United States; however, the majority of the U.S. IP addresses are owned by Alibaba.com LLC. Alibaba also owns most of the Chinese IP addresses that the camera communicates with.
Figure 4.11: Countries Contacted by Security Camera
Grouping each country based on the amount of data sent or received by IP addresses in that country gives a better breakdown of where the traffic is going. Figure 4.12 shows that the majority of traffic is still within the U.S. Only 2.4 percent of the traffic is being sent or received is over the local network. We perform all of our camera access on the local network.
Figure 4.12: Countries Contacted by Security Camera, grouped by amount of data
Almost all of the packets being sent are 78 byte UDP packets sent over port 51880. They each contain 36 bytes of data. Most of this 36 bytes is different for every packet, but there are about 10 bytes that stay constant. The user ID that was created when making a new account is sent in these packets. These packets may be used as a heartbeat to make sure that the camera still has a connection with Alibaba’s servers. While it is difficult to tell the exact purpose of these packets, our device’s account number is part of the data that is sent. The camera was set up using the NVAS2 app on the iPad. During the setup, the iPad sent an unencrypted packet with user information contained in an HTTP packet to an Alibaba server in China. The packet is shown in figure 4.13.
Figure 4.13: User Data Sent by NVAS2 Security Camera App
When the video feed is viewed on the iPad, the camera sends about 3 kB/s of data to the iPad. The NVAS2 app lets users move the camera with pan and tilt motors. In order to do this, the iPad sends a 360-660 byte UDP packet with instructions on which direction to move. During the periods where the camera is moving, there are small power spikes where the motors draw more power. These line up with the UDP packets that the iPad is sending to the camera. This can be seen in Figure 4.14 where we viewed the camera feed once, disconnected, then reconnected and viewed the stream
Figure 4.14: Security Camera Streaming and Pan/Tilt
4.1.5 Google Chromecast
Each device exhibits a slightly different behavior on its first boot than any other time the device is booted. Typically this involves sending some user data to a server, checking to see if there is an update available, and downloading and applying any available updates. The Chromecast performed these steps on its first boot. The power and network activity are easiest to understand as shown in Figure 4.15. Upon booting, the power consumption jumped up to about 1600 mW momentarily and then stabilized to 1300 mW. This continued until the Chromecast was connected to the wireless access point. As soon as this was done, the Chromecast began checking for updates. An update was found, so the Chromecast began downloading the update and playing a one minute intro video. This can be seen by the spike in network traffic from 12:40 to 12:41. The Chromecast received an unencrypted TCP packet containing the URL of the tutorial video to play during the download as shown in Figure 4.16.
download. When the update finished downloading, the Chromecast applied the update. This caused the Chromecast to reboot twice. This can be seen by the two dips in the power consumption at 12:41 and 12:43 respectively. Finally, the Chromecast booted and displayed a background image from the internet. The power then stabilized back to about 1300 mW. The additional network traffic seen after that point is caused by the Chromecast loading new background images.
Figure 4.15: Chromecast First Time Boot Network Traffic and Power Consumption
Figure 4.16: Chromecast Tutorial Video URL Received During Update
During the download process, the Chromecast also sent various pieces of information to the Galaxy Tablet that was used to set it up. Some of this information included the percent completion of the download update, the number of IP addresses that the Chromecast has been connected to, the Bluetooth low energy capability of the Chromecast, and more. This packet is shown in Figure 4.17.
Figure 4.17: Chromecast Information Sent to Galaxy Tablet During Up-date
We can also see what the Chromecast’s traffic looks like when it is idling in Figure 4.18. Every 2 minutes, the Chromecast displays a new background image.
pictures are being displayed based on the periodic spikes in throughput and power consumption. We can also see smaller data throughput spikes every minute. These are the SSDP presence announcement packets that the Chromecast sends to the Home Mini.
Figure 4.18: Chromecast Idle Traffic
There are clear differences in the data when content is being streamed to the Chromecast. Figure 4.19 shows the power increasing from 1400 mW to 1900 mW when we started watching a YouTube video. The Chromecast also starts receiving about 13 kB of video data every second which happens at the same time as the power
Figure 4.19: Chromecast Video Streaming
4.1.6 Amazon Fire TV Stick
The Fire TV Stick’s first time boot behavior was similar to the Chromecast. On its first boot, the Fire TV Stick’s power consumption rose to 2400 mW and then dropped down to 1300 mW. As soon as the Fire TV Stick was connected to the wireless AP, it began checking for updates and downloading an update. This can be seen by the section of high network traffic and power consumption. The majority of the traffic during the update download was from Akamai Technologies servers. Just like the Chromecast, the power consumption was at its highest during the download at 2500 mW. During the update process, the Fire TV Stick rebooted twice like the Chromecast did. This can be seen by the two dips in power consumption at 12:38 and 12:40. The power consumption then rose and stabilized to about 1500 mW. After the final reboot, the Fire TV Stick downloaded an additional 5 MB of content from Akamai servers. All of this can be seen in Figure 4.20.
Figure 4.20: Fire TV Stick First Time Boot Network Traffic and Power Consumption
The first packets sent and received by the Fire TV Stick are shown in Figure 4.21. First, the Fire TV sends a keep-alive packet with data about itself to an Amazon server. This includes the version of Android running on the device. Next, the Amazon server replies back with an HTTP OK message and then gives it various parameters like an amazon ID, request ID, and Etag. It also sends an HTML Kindle reachability page. After this, the Fire TV download a few different certificates from Symantec and Verisign. After this, everything is encrypted TLS traffic from Akamai Technologies.
Figure 4.21: Fire TV Stick First Packets Sent and Received
Similar to the Chromecast, we can also see when someone is watching videos on the Fire TV Stick. As soon as we began watching a YouTube video, the power consumption jumped from 800 mW up to 2400 mW before dropping back to about 1700 mW while the video was playing. After watching five minutes of videos, we stopped playback by going back to the home screen. This caused the Fire TV Stick to enter a lower power consumption state of 1300 mW for another 5 minutes before finally returning back to its sleep state at 800 mW.
Chapter 5 CONCLUSION
Using every IoT device on a regular basis and monitoring their network traffic and power consumption 24/7 has caused the MySQL database to grow to 71 gigabytes. This data covers 10 to 15 weeks of use at least every other day. This dataset provides a baseline of “normal” traffic and power consumption for 15 different IoT devices. Even in this set, there are some rare anomalous events such as devices contacting an IP address only a single time or communicating with an IP address in a country that no other device communicates with.
Analyzing the network traffic that each device sends or receives reveals interesting trends about different manufacturers. Google devices tend to only communicate with IP addresses in North America while Amazon devices are more varied. Additionally, devices designed in Asia like the Eufy Genie or the Eray Security Camera send a much larger proportion of their total traffic to countries in Asia.
There was not much anomalous activity in the 6 devices examined in this thesis. The most significant finding for network traffic was the fact that some of the devices sent or received data from countries only a single time. Even then, most of this traffic was just time data. As we showed, we were able to determine whether or not the lights were on in a house based on the power consumption of the Echo Dot. Applying machine learning techniques that are able to look at the entire database may reveal more trends.
The dataset also shows the typical power consumption of each IoT device. We can use the power consumption data to see how much power each device consumes while
music. We can also make comparisons between the devices during these periods. For example, the Fire TV Stick consumes 200 mW less power than the Chromecast does while it is streaming videos. We can use the power data to detect if there are any unexpected periods of high power consumption.
For now, it does not seem like any of the IoT devices are sending audio or video without permission. Even the devices that constantly communicate with servers like the security camera only seem to be doing this to make sure they still have a connection to the servers. Machine learning may reveal some patterns in the future that show that some of the devices actually are spying, but there were not any obvious traffic patterns that show this.
5.1 Future Work
With so much information stored in the database, a natural next step would be applying machine learning techniques to the data. The application of machine learning and artificial neural networks could lead to many interesting projects such as automatic device detection based on fingerprinting. This is similar to the research done in [16]. This could also lead to projects like automated intrusion detection systems which are able to detect anomalies in network traffic or power consumption. This same data could be used to predict when updates are downloading based on the IP addresses sending data to a device, the size of the packets, port numbers, the time of day, or
could also be more discussion about the differences between manufacturers similar to what was described in Chapter 4. Additionally, we only have one device in some device categories. The security camera generates some very interesting traffic, but we have nothing else to compare it to. Using a camera from a well known manufacturer like Belkin or Amazon would make for an interesting comparison to see what countries these devices communicate with as well as what kind of data they are sending to external IP addresses.
Repeating the monitoring and usage in a different country would provide good data for a comparison between the GeoIP information we collected in the U.S. and a different country. The majority of the traffic for each device originates in the United States, but that is likely due to the fact that all of the devices are located there. It would be interesting to see if the ratio of countries seen in Chapter 4 differs based on the country that the devices are located in. A lot of the devices seem to send small packets to servers all over the world before settling on U.S. servers, so the large portion of U.S. IP addresses is likely due to the locality of the devices and servers. Many of the countries that only had a single IP address associated with them may also see more traffic because they are closer to the location of the IoT devices.
One of the most time consuming parts of this project was using all of the IoT devices regularly. This typically took about an hour every day. Automating this process would cut out a lot of the tedious portions of building up the database. It could also make for some additional analysis. If the same exact tasks are repeated every day at the same time, the devices may respond differently or detect that they are being used by a bot. Similarly, if a text to speech program is used to issue commands to the smart speakers, they might send different traffic or ignore the command completely if they can differentiate between a human voice and a computer generated one.
While there are countless more analyses and experiments that can be performed, this work introduces a robust data-collection set up that will enable a wide range of future work on IoT devices to be conducted at Cal Poly. This work also introduces a substantial dataset of IoT power and network traffic that we intend to open-source so that a wide range of researchers can explore and benefit from our data.
BIBLIOGRAPHY
[1] Google, “Chromecast.” [Online]. Available:
https://store.google.com/us/product/chromecast 2015?hl=en-US [2] ——, “Home mini.” [Online]. Available:
https://store.google.com/us/product/google home mini?hl=en-US
[3] Amazon, “Echo dot.” [Online]. Available: https://www.amazon.com/Amazon-Echo-Dot-Portable-Bluetooth-Speaker-with-Alexa-Black/dp/B01DFKC2SO [4] ——, “Fire tv stick.” [Online]. Available:
https://www.amazon.com/Amazon-Fire-TV-Stick-With-Alexa-Voice-Remote-Streaming-Media-Player/dp/B00ZV9RDKK
[5] “Gartner says 8.4 billion connected ”things” will be in use in 2017, up 31 percent from 2016,” gartner.com, Feb 2017. [Online]. Available:
https://www.gartner.com/newsroom/id/3598917
[6] S. Burke, “Google admits its new smart speaker was eavesdropping on users,” CNN, Oct 2017. [Online]. Available:
http://money.cnn.com/2017/10/11/technology/google-home-mini-security-flaw/index.html
[7] K. K. Edara, “Keyword determinations from voice data,” Patent US20 140 337 131, Nov, 2014.
[8] A. M. Fadell, Y. Matsuoka, D. Sloo, and M. Veron, “Smart-home automation system that suggests or automatically implements selected household policies based on sensed observations,” Patent US20 160 259 308, Nov, 2016.
[9] D. Strumpf, “Surveillance cameras made by china are hanging all over the u.s.” The Wall Street Journal, Nov 2017. [Online]. Available:
https://www.wsj.com/articles/surveillance-cameras-made-by-china-are-hanging-all-over-the-u-s-1510513949
[10] “Advisory (icsa-17-124-01),” May 2017. [Online]. Available: https://ics-cert.us-cert.gov/advisories/ICSA-17-124-01
[11] A. Moscaritolo and Angela, “Phone maker blu gets wrist slap over chinese spyware,” May 2018. [Online]. Available:
https://www.pcmag.com/news/360789/phone-maker-blu-gets-wrist-slap-over-chinese-spyware
[12] D. Gewirtz, “Special report: Stuxnet may be the hiroshima of our time,” Jan 2011. [Online]. Available: https://www.zdnet.com/article/special-report-stuxnet-may-be-the-hiroshima-of-our-time/
[13] “Mirai,” Aug 2016. [Online]. Available:
https://github.com/jgamblin/Mirai-Source-Code
[14] Z. Whittaker, “Homeland security warns ’brickerbot’ can destroy unsecured internet-connected devices,” Apr 2017. [Online]. Available:
https://www.zdnet.com/article/homeland-security-warns-of-brickerbot-malware-that-destroys-unsecured-internet-connected-devices/
device identification based on network traffic analysis,” in Proceedings of the Symposium on Applied Computing, ser. SAC ’17. New York, NY, USA: ACM, 2017, pp. 506–509. [Online]. Available:
http://doi.acm.org/10.1145/3019612.3019878
[17] D. Bekerman, B. Shapira, L. Rokach, and A. Bar, “Unknown malware detection using network traffic classification,” in Communications and Network Security (CNS), 2015 IEEE Conference on. IEEE, 2015, pp. 134–142.
[18] Amazon, “Alexa.” [Online]. Available: https://www.alexa.com/
[19] “Geoip databases and services: Industry leading ip intelligence.” [Online]. Available: https://www.maxmind.com/en/geoip2-services-and-databases [20] Y. Meidan, M. Bohadana, A. Shabtai, M. Ochoa, N. O. Tippenhauer, J. Davis
Guarnizo, and Y. Elovici, “Detection of Unauthorized IoT Devices Using Machine Learning Techniques,” ArXiv e-prints, Sep. 2017.
[21] Wireshark, “Wireshark.” [Online]. Available: https://www.wireshark.org/ [22] P. Mockapetris, “Rfc 1035: Domain names - implementation and specification,”
1987. [Online]. Available: http://www.ietf.org/rfc/rfc1035.txt
[23] N. Apthorpe, D. Reisman, and N. Feamster, “A Smart Home is No Castle: Privacy Vulnerabilities of Encrypted IoT Traffic,” ArXiv e-prints, May 2017. [24] Y. Amar, H. Haddadi, R. Mortier, A. Brown, J. Colley, and A. Crabtree, “An
Analysis of Home IoT Network Traffic and Behaviour,” ArXiv e-prints, Mar. 2018.
[26] Amazon, “Amazon rds.” [Online]. Available: https://aws.amazon.com/rds/ [27] Intel, “Intel nuc.” [Online]. Available:
https://www.intel.com/content/www/us/en/products/boards-kits/nuc.html [28] https://github.com/oblique/create ap, “create ap,” Apr 2015.
[29] P. Srisuresh and M. Holdrege, “IP Network Address Translator (NAT)
Terminology and Considerations,” Internet Requests for Comments, RFC Editor, RFC 2663, August 1999. [Online]. Available: https://tools.ietf.org/html/rfc2663 [30] “Ieee standard for information technology-telecommunications and information
exchange between systems-local and metropolitan area networks-specific requirements-part 11: Wireless lan medium access control (mac) and physical layer (phy) specifications: Amendment 6: Medium access control (mac) security enhancements,” IEEE Std 802.11i-2004, pp. 1–190, July 2004.
[31] “Ieee standard for information technology–telecommunications and information exchange between systems local and metropolitan area networks–specific
requirements - part 11: Wireless lan medium access control (mac) and physical layer (phy) specifications,”IEEE Std 802.11-2016 (Revision of IEEE Std 802.11-2012), pp. 1–3534, Dec 2016.