On functional imaging and
treatment planning for
biologically adapted radiotherapy
Thesis for the degree of Philosophiae Doctor
Trondheim, March 2012
Norwegian University of Science and Technology
Faculty of Natural Sciences and Technology
Department of Physics
Oslo University Hospital
Norwegian Radium Hospital
Department of Medical Physics
NTNU
Norwegian University of Science and Technology Thesis for the degree of Philosophiae Doctor Faculty of Natural Sciences and Technology Department of Physics
© Jan Rødal
ISBN 978-82-471-3400-9 (printed ver.) ISBN 978-82-471-3401-6 (electronic ver.) ISSN 1503-8181
Doctoral theses at NTNU, 2012:65 Printed by NTNU-trykk
Preface
This work was accomplished at Department of Physics, Faculty of Natural Sciences and Technology, Norwegian University of Science and Technology (NTNU), from September 2008 to December 2011 (full time position as medical physicist from July 2011). The experimental work was carried out at Department of Medical Physics, Norwegian Radium Hospital, Oslo University Hospital (OUS). The work was supported by Siemens AS, Norway, and Department of Medical Physics, OUS.
The main supervisor has been Professor Eirik Malinen, OUS. The academic supervisor has been Professor Arne Skretting, OUS and NTNU, until February 2011. He was followed by Professor Tore Lindmo, NTNU, from February 2011, due to Arne Skrettings retirement from his position at Department of Physics, NTNU.
Contributions
The papers included in this thesis are written in co-operation with several authors, who have all given written consents to the use of the papers. Eirik Malinen contributed significantly to the planning of the experiments and the data analyses. He is first author of paper I and contributed significantly to the data analysis for this paper. Åste Søvik and Hege Kippenes Skogmo contributed significantly to the imaging and treatment of the canine patients. Åste Søvik is first author of paper III and contributed significantly to the dose plan analysis for this paper. Ingrid Skjei Knudtsen contributed to the PET and CT acquisitions for paper I and II. Einar Waldeland contributed to the planning and experimental work of paper V, and Christoffer Lervåg and Karsten Eilertsen contributed to the data analysis in paper III. All co-authors were involved in the final stages of writing the papers.
Acknowledgements
My main supervisor, Professor Eirik Malinen, is greatly acknowledged for his ever enthusiastic supervision and support of my work for this thesis, and for always being available for discussions. I highly appreciate your extremely positive attitude and the effort you have put into the projects.
I am thankful to my academic supervisors, Professor Arne Skretting and Professor Tore Lindmo, for their support of my work and for being links to the Faculty of Natural Sciences and Technology. Vidar Jetne and Karsten Eilertsen at The Department of Medical Physics are highly acknowledged for the practical arrangements of my position and the financial support of the work.
I also wish to express my gratitude to my co-workers Åste Søvik, Hege Kippenes Skogmo, Ingerid Skjei Knudtsen, Einar Waldeland and Christoffer Lervåg for their positive attitude and professional contributions to the results, and to Dag Rune Olsen and Øyvind Bruland for participating in the initiation of my PhD project. I have enjoyed our interesting disciplinary discussions, but also the off-topic talks concerning matters like sport dogs and ballistics, which have shortened the wait during PET imaging and treatments. My colleagues at the Department of Medical Physics are also highly appreciated for contributing to a great job environment.
Special thanks to the Section of Nuclear Medicine for supporting the projects, and to the staff at the PET/CT and the treatment machine for their enthusiastic participation. Thanks also to the veterinary students who have handled the canine patients, spending almost 40 of their valuable evenings at the hospital.
Finally, warm thoughts to my wife, Heidi, for being supernaturally positive minded and for giving crucial disciplinary feed back in reading my thesis and papers.
List of papers
I. Malinen E, Rødal J, Knudtsen IS, Søvik Å, Skogmo HK. Spatiotemporal analysis
of tumor uptake patterns in dynamic 18FDG-PET and dynamic contrast enhanced
CT. Acta Oncologica 2011;50:873-882.
II. Rødal J, Søvik Å, Skogmo HK, Knudtsen IS, Malinen E.Feasibility of
contrast-enhanced cone-beam CT for target localization and treatment monitoring. Radiotherapy and Oncology 2010;97:521-524.
III. Søvik Å, Rødal J, Skogmo HK, Lervåg C, Eilertsen K, Malinen E. Adaptive
radiotherapy based on contrast enhanced cone-beam CT imaging. Acta Oncologica 2010;49:972-977.
IV. Rødal J, Søvik Å, Malinen E. Influence of MLC leaf width on biologically
adapted IMRT plans. Acta Oncologica 2010;49:1116-1123.
V. Rødal J, Waldeland E, Søvik Å, Malinen E. Dosimetric verification of biologically
Summary
Tumours show large variations in response to radiotherapy, both across tumour types and within individual tumours. One way to counteract radioresistance is to increase the radiation dose to resistant regions by so-called biologically adapted therapy. Visualisation of these regions based on properties related to radioresistance, such as metabolism, hypoxia, proliferation, and vascularisation, can act as basis for target definition, and can be obtained by PET/CT, dynamic MRI, and dynamic CT imaging.
One aim of the present work was to improve tumour visualisation in images obtained before and during radiotherapy. An analysis of dynamic FDG-PET (D-PET) and dynamic contrast-enhanced CT (DCE-CT) images of three canine patients showed similarities between the two image modalities with respect to tumour vascularisation. The results indicated that D-PET may be used alone for assessment of both tumour perfusion and metabolic activity, simplifying the image acquisition. We also investigated a new method for tumour visualisation by use of image subtraction in CE cone-beam CT (CE-CBCT) images, obtained during IMRT of one of the dogs. The method was shown to be feasible and produced images with a clearly visualised tumour. We further aimed to investigate the radiobiological effect of biologically adapted dose delivery. An IMRT planning study based on CE-CBCT images of the first canine IMRT patient demonstrated that such dose planning was feasible. This approach gave the highest effect on the tumour and thus showed that biologically adapted treatment was the best choice for this treatment case. Furthermore, a hypoxia dose painting study with a highly heterogeneous tumour model, where MLC leaf widths and IMRT parameters were varied, indicated that reducing the leaf widths from 10 to 5 or 2.5 mm gave increased tumour control probability. We also implemented dose painting by contours in an anthropomorphic phantom. An optimal dose delivery was not achieved.
In conclusion, dynamic FDG-PET before radiotherapy and CE-CBCT during radiotherapy may be valuable. Dose painting should preferably be delivered by MLCs with small leaf widths. However, a high radiobiological effect from high-resolution dose painting could not be demonstrated in practice. An alternative dose painting approach or treatment modality may thus be required for biologically adapted dose delivery to highly heterogeneous tumours.
Table of contents
PREFACE ... III ACKNOWLEDGEMENTS ... V LIST OF PAPERS ... VII SUMMARY ... IX ABBREVIATIONS ... XIII 1. INTRODUCTION ... 1 2. AIMS ... 3 3. BACKGROUND ... 5 3.1.CANCER ... 5 3.2.RADIOBIOLOGY ... 8 3.3.TUMOUR RADIORESISTANCE ... 11
3.4.TUMOUR RESPONSE MODELLING ... 14
3.5.MEDICAL IMAGING ... 18
3.6.RADIOTHERAPY ... 24
4. METHODS AND DESIGN ... 35
4.1.CANINE PATIENTS, IMAGING AND TREATMENT ... 35
4.2.THE HETEROGENEOUS TUMOUR MODEL ... 37
5. SUMMARY OF RESULTS ... 39 5.1.PAPER I ... 39 5.2.PAPER II ... 39 5.3.PAPER III ... 40 5.4.PAPER IV ... 41 5.5.PAPER V ... 42 6. DISCUSSION ... 43
6.1.COMPARISON OF DCE-CT AND D-PET ... 44
6.2.TUMOUR VISUALISATION BY CE-CBCT ... 45
6.3.ADAPTIVE STRATEGIES ... 46
6.4.DOSE PAINTING ... 47
7. CONCLUSIONS ... 51
8. FURTHER PERSPECTIVES ... 53
Abbreviations
3-D Three-dimensional
64Cu-ATSM 64Cu-methyl-thiosemicarbazone
Bq Becquerel
BTV Biological target volume
CBCT Cone-beam CT
CE Contrast-enhanced
CIN Contrast-induced nephropathy
CRT Conformal radiotherapy
CT Computed tomography
DCE-CT Dynamic contrast-enhanced CT
DCE-MRI Dynamic contrast-enhanced MRI
DICOM Digital Imaging and Communications in Medicine
DNA Deoxyribonucleic acid
DPBC Dose painting by contours
DPBN Dose painting by numbers
D-PET Dynamic PET
ECM Extracellular matrix
EDR Extended dose range
EES Extravascular, extracellular space
EF5 2-(2-Nitro-1H-imidazol-1-yl)-N-(2,2,3,3,3-pentafluoropropyl)acetamide
EGFR Epidermal growth factor receptor
EPID Electronic portal imaging device
EUD Equivalent uniform dose
FAZA 18F-azomycin-arabinoside FDG 18F-fluoro-2-deoxyglucose FET Fluoroethyl-L-tyrosine FETA 18F-fluroetanidazole FETNIM 18F-Fluoroerythronitroimidazole FLT 18F-fluorothymidine FMISO 18F-fluoromisonidazole
Gd-DTPA Gadolinium diethylene triamine pentaacetic acid
GLUT Glucose transporter
Gy gray
HIF Hypoxia-inducible factor
HK Hexokinase enzyme
HR Homologous recombination
IGRT Image guided radiotherapy
IMAT Intensity modulated arc therapy
IMRT Intensity modulated radiotherapy
iv Intravenously
LQ Linear-Quadratic model
LSO Lutetium oxy-orthosilicate
MET Methyl-methionine
MLC Multileaf collimator
MMP Metalloproteinase
MR Magnetic resonance
MRI Magnetic resonance imaging
MRS Magnetic resonance spectroscopy
NARA Norwegian Animal Research Authority
NHEJ Nonhomologues end joining
NMR Nuclear magnetic resonance
NTCP Normal tissue complication probability
OER Oxygen enhancement ratio
PET Positron emission tomography
PMMA Polymethyl methacrylate
pO2 Partial pressure of oxygen (O2)
PO4 Phosphate
PTV Planning target volume
RF Radio frequency
SF2 Survival fraction at 2 Gy
SPECT Single-photon emission CT
SUV Standard uptake value
T1, T2 Time constants in MRI
TCP Tumour control probability
TOF Time-of flight
VMAT Volumetric modulated arc therapy
VSIM Virtual simulator
1.
Introduction
Solid tumours are heterogeneous and structurally complex with respect to factors like blood flow, oxygen and nutrient supply, cell growth, cell density, pH, and bioenergetic
status.1, 2 These biological factors are primarily created by inadequate and
heterogeneous vascular networks, and give rise to a variable resistance to nonsurgical treatments like chemotherapy and radiotherapy. The variability in such resistance factors exists both between and within tumour types, between different parts of the tumour, and may also change with time.
Radioresistant cells within a tumour may cause recurrent growth and thus lack of
local control following therapy.3-5 It has therefore been suggested to apply
heterogeneous tumour dose distributions in accordance with the spatial and temporal variation of radiosensitivity, so-called biologically adapted radiotherapy.6-14 To guide
such focal dose escalation, a radioresistance map of the tumour is required. One strategy to obtain such a map is through noninvasive biological imaging.
Biological imaging includes molecular imaging, which deals with the cellular and sub cellular biological processes, and functional imaging, which focuses on physiological activities within a certain tissue.15, 16 Advances in these modalities may improve our ability to depict targets which may reflect the radioresistance of the tumour. Through functional imaging with computed tomography (CT), magnetic resonance imaging (MRI), and positron emission tomography (PET) one can visualise factors like vasculature, proliferation, hypoxia, and metabolism.17 These characteristics may serve as guidance maps for focal dose escalations in radiotherapy. Assessment of such factors before, during and after treatment is thus important to tailor personalised treatment regimens.18 It is still a matter of discussion, however, how to best incorporate
this information into radiotherapy and the literature shows that there is high interest in this field.19
Technological developments in radiotherapy, such as inverse treatment planning algorithms, intensity modulated radiotherapy (IMRT), and multileaf collimators (MLCs) with increased resolution and accuracy have enabled high gradient,
heterogeneous dose distributions in the patient. Such achievements have therefore been a premise for implementing focal dose escalation. The width of the MLC leafs influences the obtainable resolution of the dose distributions, and has been widely investigated in modelling studies.19, 20 Data concerning biological effect evaluations for various leaf widths are still scarce, though, and the optimal resolution for biologically adapted therapy is yet to be decided.21
Cone-beam CT (CBCT) has been integrated with the linear accelerator for volumetric imaging in the therapy room, and has contributed highly to the development of image guided radiotherapy (IGRT). Visualisation of tumour related changes during treatment is of great interest for treatment setup and monitoring. Still, soft tissue components may be hard to separate in cone-beam CT images. Improving tumour to background contrast in cone-beam imaging may be advantageous in biologically adapted radiotherapy.
2.
Aims
The overall aims of this study were to improve tumour visualisation and to investigate the radiobiological effect of biologically adaptive dose delivery.
Specific aims were to:
x Compare early uptake patterns obtained by dynamic 18
F-fluoro-2-deoxyglucose (FDG) PET and dynamic contrast-enhanced CT (DCE-CT) imaging (paper I).
x Investigate the feasibility of using contrast-enhanced CBCT (CE-CBCT)
to visualise the tumour before and during treatment, and evaluate different treatment adaptation strategies based on such visualisation (paper II and III).
x Analyse the effect of radiotherapy planning with different MLC leaf
widths and investigate the delivery of biologically adapted heterogeneous dose distributions to an anthropomorphic phantom (paper IV and V).
3.
Background
3.1.
Cancer
Tumour and neoplasm are collective terms denoting an abnormal mass of tissue resulting when cells with changed or damaged genetic material (DNA) begin to grow
without control.22 Cells from benign tumours do not spread to other parts of the body,
and can often be removed without coming back, they are not cancerous. Malignant tumours, however, are cancerous, and lead to significant morbidity and mortality. They grow into surrounding normal tissues and metastasise to vital organs throughout the
body.23 Such distant spread of tumour cells is the cause of 90% of human cancer
deaths.24, 25 It has been proposed that the genetic characteristics, or genotypes, of cancer
cells are manifested in six essential alterations in the cell physiology, acquired during tumour development: self-sufficiency in growth signals, insensitivity to antigrowth signals, evasion of programmed cell death, or apoptosis, unlimited growth potential,
sustained blood vessel growth, and tissue invasion and metastasis.25 Later progress has
further added two emerging hallmarks to this list; reprogramming of energy metabolism
and evading immune destruction (Fig. 1).26 There are more than 100 different cancer
types, usually named by the body site where they originated.27 Some cancers start in
blood cells and do not give rise to tumours, while cancers arising from organs and solid
tissues become solid tumours. The latter represents more than 90% of all human
cancers.22, 23
Among the 4,9 million inhabitants in Norway, there were registered 27 520 new
cancer cases in 2009 (0.6%), and 10 600 patients received external radiotherapy.28 A
total of 200 000 persons had cancer in 2009 (4%), and the probability of developing
cancer before the age of 75 is 28% in women and 35% in men.29 The cancer incidence
in Norway has been increasing since population-based cancer surveys were initiated. In the period 2004-2009 the general increase in incidence was 1.8% per year, but the number varies highly between cancer types. The five-year survival also varies much between cancer types and was around 14% for lung cancers, 63% for colon and rectum
cancers and 87% for prostate and breast cancers (2004-2009). These numbers show an increase of 2-8% from the previous five year period.
Sustaining proliferative signaling Evading growth suppressors Avoiding immune destruction Enabling replicative immortality Activating invasion & metastasis Inducing angiogenesis Resisting cell death Deregulating cellular energetics Sustaining proliferative signaling Evading growth suppressors Avoiding immune destruction Enabling replicative immortality Activating invasion & metastasis Inducing angiogenesis Resisting cell death Deregulating cellular energetics
Figure 1. The eight hallmarks of cancer. Adapted from Hanahan and Weinberg.26
Tumour vasculature
To grow beyond a small pool of tumour cells and induce metastatic spread, the cancer has to develop its own blood supply.30 This is done by stimulating the growth of endothelial cells from surrounding vessels into the tumour, a process known as angiogenesis.23 These newly formed blood vessels are highly different from normal
vasculature. They are irregular and tortuous with branching patterns that feature excessive loops, blind ends and arteriolar-venous shunts, and they tend to be more leaky (Fig. 2).1 These vessel structures result in disorganised and variable blood flow, making the delivery of oxygen and nutrients to the tumour cells less efficient than in normal tissues. This leads to acidic, glucose- and oxygen-deprived regions in most tumours.
Figure 2. The vascular system in normal tissue (A) and in solid tumour (B).1
Hypoxia
Normal tissues typically have a median oxygen pressure of 40-60 mmHg (pO2).23
Tumour tissues with severely reduced oxygen concentration are termed hypoxic. They may even be completely depleted of oxygen, i.e. anoxic. Diffusion-limited, or chronic, hypoxia increases with distance between the nutritive blood vessel and the tumour cells. A distance of more than roughly 50 ȝm can give pO2 values lower than 2.5 mmHg.31
die and necrotic tissue will develop. Blood vessels may also be temporarily occluded, leading to perfusion-limited O2 delivery. This is often a transient condition and may be
termed acute hypoxia.32
It has been shown that 50-60% of locally advanced solid tumours can exhibit hypoxic and anoxic regions that are heterogeneously distributed within the tumour
masses.32 It has also been indicated that hypoxia-adapted cells can proliferate despite
oxygen or nutrient deprivation.33 This may lead to increased potential for local invasive
growth and regional and distant spread.2, 31 This hypoxia-driven, malignant progression
may result in an aggressive and treatment resistant tumour phenotype.
Canine tumours
Naturally occurring canine cancers are attractive models in oncology.18 They share
many features with human cancers, including histological appearance, tumour genetics, molecular targets, biological behaviour, and response characteristics to conventional
therapies.34 Tumours in pet dogs are comparable in size to human tumours, and are
relatively outbred compared with tumours in small laboratory animals like mice and rats. The canine genome also shows closer similarities with human genomes in those gene families associated with cancer compared with for example the mouse genome. The range of cancers in pet dogs is as diverse as the cancers seen in human patients and have the same biological features, including tumour vasculature and hypoxia, metastatic capacity, acquired resistance to therapy, and recurrence rate.34
3.2.
Radiobiology
The use of x-rays for treatment of cancer, and a large number of nonmalignant conditions, was started quite immediately after the discovery of x-rays in 1895. It was quickly realised, however, that the radiation dose could not be increased indefinitely due to the toxic effects to normal tissues. Radiotherapy is therefore beneficial only if the tumour response occurs at a total cumulative dose that does not result in severe normal tissue complications. This led to the concept of the therapeutic window. This concept describes the response of the tumour and normal tissues as a function of cumulative
dose for fractionated radiotherapy (Fig. 3). A certain dose difference must exist between the two response curves for the treatment to be beneficial.
Tissue response %
Tissue response %
Cumulative dose
Cumulative dose
(b) Unfavourable
(a) Favourable
Tumour control
Normal tissue damage
Tissue res
p
onse
%
p
Tissue response %
Tissue response %
Cumulative dose
Cumulative dose
(b) Unfavourable
(a) Favourable
Tumour control
Normal tissue damage
Tumour control
Normal tissue damage
Figure 3. (a) The therapeutic window is large when the response of tumour tissue is greater than that of normal tissue. (b) The therapeutic window is small when the response is similar. Adapted from Bernier et al.35
Different radiobiological experiments were carried out during the first decades of the 20th century, and in the middle of the 1920s these investigations started to have an
considerable impact on the design of radiotherapy.35 In the 1930s a consensus emerged
that it was favourable to divide one large single-dose treatment into a series of low-dose treatments, known as fractionated radiotherapy. The treatment effect could then be achieved with less damage to normal tissues. 20 years later, in 1953, Louis Harold Gray showed that the sensitivity of tumour cells to radiation was higher under well-oxygenated conditions than under hypoxic conditions.36 This time period thus led to the
identification of the radiobiological factors that influence the response to fractionated treatments, known as the four Rs of radiotherapy: Repair, Repopulation, Redistribution and Reoxygenation.37
Repair
Normal cells proliferate relatively slowly and have time to repair radiation induced DNA damages before replication. Conversely, rapidly proliferating tumour cells may undergo DNA replication with unrepaired damages, which can be lethal. Fractionated radiotherapy is thus essential for normal tissue repair and contributes to an increased therapeutic window when normal tissues proliferate more slowly than the tumour. Repopulation
Tumour cells that survive irradiation may proliferate, or repopulate, which is a negative effect from fractionation. Splitting the treatment into many fractions over an extended treatment period may further induce accelerated proliferation of the surviving tumour cells. This increases the number of cells to be killed and prolonged treatment times may therefore reduce the possibility to achieve local control. Sufficient time between fractions is anyhow essential for the normal cells to repair sublethal damage, and 4-6 hours between fractions seems to be an adequate interval.
Redistribution
Cells are more resistant to radiation when they are in the S-phase of the cell cycle. Most surviving cells will thus be in this phase. Allowing time for these cells to progress into another, more sensitive phase and then be irradiated again is therefore an argument for fractionated radiotherapy.
Reoxygenation
Another beneficial effect of fractionation is the reoxygenation of hypoxic tumour cells. After irradiation the hypoxic fraction of tumour cells is increased due to the inactivation of the more radiosensitive aerobic cells. Reoxygenation of the hypoxic cells will occur after irradiation, however, gradually increasing the tumour radiosensitivity. The reoxygenation occurs over a time span from a few hours to several days, depending on the underlying mechanisms.
Altered fractionations
In conventional fractionation, a fraction dose of 1.8-2.0 Gy is delivered to the tumour once a day, five days a week. Many locally advanced diseases cannot be controlled by
this regimen and alternative schedules have been derived from laboratory and clinical
observations made in the 1970s and 1980s.35 These studies showed that giving smaller
and more frequent fractions allowed for higher total doses without causing increased late morbidity in normal tissues. This approach is termed hyperfractionation.
Many tumours show rapid cell proliferation, which may even be accelerated by irradiation. Shortening of the treatment time to counteract this repopulation is thus justified and is the rationale behind accelerated fractionation. Accelerated fractionation implies a reduced overall treatment time and an increased mean dose per week above
the 9-10 Gy given in conventional fractionation.37 Both hyperfractionation and
accelerated fractionation have been shown to give significant survival benefits. For example as shown in a large meta-analysis of 6515 patients with head and neck cancers, where a survival benefit of 8% was found for hyperfractionation, and 2% for accelerated radiotherapy.38
3.3.
Tumour radioresistance
Due to the heterogeneity in biological factors, cancers show large variations in radioresistance and respond differently to radiotherapy. Tumour types like melanoma, osteosarcoma and glioblastoma are in general among the radioresistant ones, while
lymphoma, myeloma and neuroblastoma are among the most radiosensitive37. Different
types of carcinomas and lung cancers lie in between, but may also be very radioresistant in certain cases. Tissue radiosensitivity is determined mainly by three mechanisms; intrinsic radioresistance, tumour cell proliferation, and hypoxia.2, 31, 39, 40 Visualisation of radioresistant cells based on these processes thus constitutes the principal foundation for dose escalation in radiotherapy.
Intrinsic radioresistance
Intrinsic radioresistance is a result of the enzymatic repair of double-strand breaks and other DNA damage induced by radiation. Tumour cells can show an increased DNA
repair capacity which will influence the outcome of radiotherapy.40 This is confirmed
for example by the positive expression of repair enzymes and reduced clinical response and survival in cervical cancer.41-43 It is further shown that tumour cell radiosensitivity
is a significant and independent prognostic factor for the outcome of radiotherapy for
cervix and head and neck carcinomas.44-46 Intrinsic radiosensitivity was here measured
by the survival fraction at 2 Gy in vitro (SF2), i.e. without the influence of hypoxia and
repopulation effects.
Homologous recombination (HR) and nonhomologous end joining (NHEJ) are two main pathways involved in repair of double strand breaks, and several gene therapy
strategies have been developed to inhibit such pathways.37 However, DNA therapy has
not yet gained widespread clinical implementation, as is also the case for other therapies based on antibodies targeting repair enzymes. Increasing the irradiation dose by hyperfractionation is so far the chosen strategy for overcoming intrinsic radiosensitivity. Combinations with chemotherapy have been found beneficial, for example in advanced laryngeal cancer.47
Proliferation
Tumours with rapid proliferation show high radioresistance due to the increased growth between sessions of fractionated radiotherapy. A retrospective review of nearly 500 head and neck cancers concluded that increased proliferation set in after a certain treatment time, 3-4 weeks in the referred case. An increase in total dose of 0.6 Gy per day prolonged treatment time was required as compensation.48, 49
Activation of the epidermal growth factor receptor (EGFR) is one pathway for cells to enhance their proliferation in response to radiotherapy or chemotherapy.50 It has therefore been proposed to combine radiotherapy with EGFR-targeted cytostatic agents, for example cetuximab, to inhibit repopulation and thereby increase the radiation
response.40, 50 Results from such studies have been promising for tumour control, but
have also increased normal tissue toxicity. Another approach is accelerated radiotherapy which has shown increased loco-regional control in treatment of head and neck cancers,
and of Burkitt’s lymphoma.38, 47, 50 Chemotherapy in combination with radiotherapy has
also been shown to give improved survival in primary treatment of head and neck and cervix cancers, possibly due to the inhibition of tumour cell repopulation.50
Hypoxia
Radioresistance to electron and photon radiation rapidly increases when pO2 in a
tumour is reduced below 25-30 mm Hg (Fig. 4).2
Reduced proliferation
Reduced oxygen pressure
Distance from capillary (ʅm)
Surviving fracti on after treatmen t 0 50 100 150 Capillary Reduced proliferation Reduced proliferation
Reduced oxygen pressure Reduced oxygen pressure
Distance from capillary (ʅm)
Surviving fracti on after treatmen t 0 50 100 150 Capillary Figure 4. (Left) Part of a tumour surrounding a capillary. The partial oxygen pressure decreases with increasing distance from the capillary. (Right) This reduces the cell kill in response to radiation and anticancer drugs. Adapted from Brown.23
The increased radioresistance is caused by two main mechanisms:
- Reduction of the direct oxygen-enhancement effect, with fewer fixations by oxygen of the radiation induced free radicals in the DNA structure. If oxygen is not present during irradiation, the damaged molecules can be restored to their original form by reaction with H+.44 For most cell types, the oxygen enhancement ratio (OER) for x-rays is around 3, but may be lower than this at radiation doses below 3 Gy.36, 44
- The indirect radioresistance is caused by selection of tumour subpopulations surviving the hostile hypoxic environment. These clones may have hypoxia-induced genetic changes leading to lower apoptotic potential and higher proliferation rate, representing a more aggressive tumour type with increased radioresistance.2 Additionally, hypoxia results in an increase in DNA repair enzymes and radical scavengers, also leading to decreased cell death.51
It has been shown that hypoxia, measured by polarographic electrodes, is an independent prognostic factor which indicates significantly lower loco-regional control
after radiotherapy of head and neck cancers.52 The same has been shown for uterine
cervical cancers and soft tissue sarcomas.2, 53 The use of the hypoxia radiosensitiser
nimorazole in the DAHANCA 5 head and neck study is an example of counteracting the
direct oxygen-enhancement effect.54 Patients with low plasma osteopontin levels, as a
marker of low degree of hypoxia, showed significantly improved loco-regional control and disease-specific survival.
The adverse prognostic impact of hypoxia may, however, also be caused by increased regional and distant metastatic potential of these tumours.2 It is important to note that such properties can not be altered by local doses of radiation.
3.4.
Tumour response modelling
Tumour control probabilityRadiobiological experiments have demonstrated that the survival of irradiated cells can be described by the Linear-Quadratic (LQ) model of cell killing:
) 1 ( 2 d d d d
e
e
S
D E D E D (1) where S is the surviving fraction after a dose d of radiation to a population of cells.37, 55-57Į and ȕ characterise the initial slope and curvature, respectively, of the survival curve.For a fractionated treatment course with n fractions of dose d each, the expected number Ns of surviving, clonogenic cells is thus given by:
) 1 ( 0 0 d nd n s
N
S
N
e
N
D E D (2)where N0 is the initial number of clonogenic cells. Cell repopulation rate and the
straightforwardly be taken into consideration, however, by adding a ȖT term in the exponent, where Ȗ is the repopulation rate and T is the overall treatment time.
Tumour eradication is only obtained when every single clonogenic cell has been
eliminated, i.e. when Ns in equation (2) is zero. The probability that no single
clonogenic cell is present if the mean number of clonogenic cells is Ns can be obtained
from Poisson statistics:
! ) , ( y N e y N P y S N S S (3)
which gives the probability P of the occurrence of exactly y events when the mean
number of events is NS. The tumour control probability (TCP) corresponds to the
probability of finding zero surviving cells, i.e. when y = 0:
S N S
e
N
P
TCP
(
,
0
)
(4)The clinical implication of this formalism may be illustrated by an example of a
massive tumour reduction from 109 clonogens down to a mean of 4. The surviving
fraction is here as low as 4·10-9, but the TCP is still only 4 1.8%
e . Increased cell
killing by a factor 100 reduces the mean number of surviving cells to 0.04, leading to TCP = 96%. These examples indicate that eradicating all the cells in a tumour is a demanding challenge. The TCP value may be very useful as a relative measure, as for example in comparing dose plans and in evaluating the effects of changing parameters in plans. The absolute TCP values must be treated with great caution, however, due to the lack of clinical data on radiosensitivity and clonogenic cell density.55
For a tumour with volume V and clonogenic density ȡ0 the probability of not
finding any surviving clonogens, and thus obtaining tumour control, is from equations (2) and (4) given by:
) 1 ( 0 0 d d n n Ve VS
e
e
TCP
D E D U U (5) From a radiobiological point of view, this equation is fundamental for the understanding of tumour response and its influencing factors. It states, for example, that the relative importance of the intrinsic radiosensitivity, given by Į and ȕ, is greater than that of the clonogenic density, ȡ0.In the case of nonuniform dose distributions in the target volume, the tumour may be divided into a number of independent subunits. If the tumour consists of N such subvolumes, the control probability for a given subvolume is:
¸ ¸ ¹ · ¨ ¨ © § d i i d i n i iV e i
e
TCP
D E D U 1 , 0 (6) where Vi is the volume of element i. Vi may for voxel-wise representation of the tumourbe considered to be a constant Vvox equal to the voxel volume. Finally, the total cure
probability is the product of the cure probabilities for each subvolume of the tumour:
¦
¸¸¹ · ¨ ¨ © §
N i d i i d i n i iVe N i ie
TCP
TCP
1 1 , 0 1 D E D U (7)There is large inter-patient heterogeneity in the intrinsic radiosensitivity of the tumour cells, i.e. in the Į values, and this is suggested to be the main cause for clinically
observed TCP response curves being less steep.55, 56 This inter-patient variation is
suggested to have a larger impact than the radiosensitivity variations between clonogenic cells within each tumour, i.e. the intra-patient variation.55 It is therefore warranted to have a population-based TCP, which may be defined as:
³
f ¸¸ ¹ · ¨¨ © § 0 1 ) (D
dD
g TCP TCP N i i pa (8)where g(Į) is the frequency distribution of Į, which may be assumed to follow a
Gaussian distribution.
Another concept concerning dose-response relationships in radiotherapy is the normal tissue complication probability (NTCP). The NTCP describes the effects on normal tissues for partial-volume irradiations and inhomogeneous dose distributions,
and different models have been proposed for this purpose.37 The concept has, however,
not been dealt with in the present work and will therefore not be further outlined.
Equivalent uniform dose
The concept of equivalent uniform dose (EUD) is relevant when the dose is distributed inhomogeneously over the target volume. The formalism converts the inhomogeneous dose distribution into a single dose, the EUD, which causes the same radiobiological effect when distributed uniformly over the target volume.44, 58 In terms of cell kill, the
EUD may be defined as:
¦
N i d d n EUD EUD n i ie
N
e
1 ) 1 ( ) 1 ( DE1
D DE D (9)The right-hand side of the equation describes the mean surviving fraction over N voxels,
where each voxel receives a dose di. The left-hand side describes a situation where all
voxels have been irradiated with a dose EUD. This gives an equation quadratic in EUD, with the physical solution (for EUD>0):
E
E
D
D
D E D2
1
ln
4
1 ) 1 ( 2»
¼
º
«
¬
ª
¦
N i d d n i ie
N
n
EUD
(10)While the TCP is a parameter which gives the probability of reaching a certain endpoint, i.e. the probability of eradicating the tumour, the EUD gives a dose as output. The EUD can thus be compared with for example the prescribed target dose, or a dose limit for a risk organ.
3.5.
Medical imaging
The first clinical images obtained by CT and MRI were taken in 1971 and 1976, respectively, and commercial installations of these imaging systems were available a
few years later.59,60 Parallel to the progress in CT and MRI imaging, the PET was
developed and clinical use of the first practical PET scanner was published in 1975.61
The development of radiopharmaceuticals, in particular FDG, contributed heavily to the
entry of PET imaging into medicine.62 Later, in 2001, a dual mode PET/CT scanner was
commercially introduced which integrated the PET and CT modalities into one device.63
CT and MRI have the advantage of high anatomical and temporal resolution, and they are supplementary in their visualisation of tissue types. By including contrast agents one can also depict tumour perfusion and diffusion into the extravascular, extracellular space (EES). Functional information about tumour vasculature can thus be obtained. CT and conventional MRI do not map processes like metabolism and proliferation, and no information can be obtained about tissue viability.64
PET imaging has, by contrast, low anatomical resolution, but provides biological insights about the tumour tissue, such as metabolism, proliferation and oxygen status. A broad range of isotope markers incorporated into biological molecules have been developed for PET imaging of these processes, and the modality has become a complementary technique to CT and MRI.
CT
CT images are constructed on the basis of transmission measurements of a fan-shaped x-ray beam which rotates around the patient. The distribution of attenuation coefficients within the depicted volume is calculated by means of digital reconstruction algorithms, and each element, or pixel, of the CT image is thereby assigned a CT number. The CT numbers appear as grey values in the images and are presented in Hounsfield units
(HU), which relate the linear attenuation coefficient in each voxel to the attenuation in water: 1000 u water water tissue H P P P (11)
where ȝ is the linear attenuation coefficient. The CT numbers range from -1000 for air
up to between 700 and 3000 for different types of bone, with that for water set to 0.65 In dose planning systems, the patient tissue distribution is represented by a CT image series; a three-dimensional (3-D) CT matrix. Accurate photon beam dose
computational methods rely on knowledge of the electron densities in this matrix.66
Since the CT numbers bear a linear relationship to the attenuation coefficients, the properties in each volume element, or voxel, of the density matrix may be derived from
the pixel values in the CT images.67 Such density information is not provided by other
imaging methods like MRI and PET. CT information is therefore essential to dose planning when the inhomogeneity of the irradiated medium is taken into account in the dose calculations.
The CT technology has evolved dramatically over the last decade. Helical scanners with multi detector rows, which scan continuously while the patient is moved through the CT gantry, were introduced in 1998, and in 2004 scanners with acquisition
of 64 slices per rotation were introduced.68 Such scanners now have a resolution below
0.5 mm and X-ray tube rotation times down to 0.3 s. These developments also made tumour perfusion measurements readily accessible, enabling functional evaluation of
tissue vascularity through DCE-CT.69
Following injection of a contrast medium in the patient, DCE-CT applies repeated acquisitions of CT images over a selected volume. The changes in tissue density over time can then be measured from the distribution of contrast medium in the tumour. A contrast enhancement may also be observed from the leakage of contrast medium into the extravascular space. This is due to the contrast molecules having a relatively low molecular weight, up to 1550 Da for the contrast agents used in the present work, and due to tumours often demonstrating increased capillary permeability and vascular density over normal tissues. The contrast agents are further both hydrophilic and inert and are thus excluded from the intracellular space.
The usefulness of DCE-CT within oncology is related to vascularisation and tumour hypoxia. The functional information can quantify physiological changes of the tumour, which can aid in tissue characterisation, provide prognostic information, and produce clearer delineation of tumours, with corresponding benefits for radiotherapy planning.30, 69
MRI
While CT relies on ionising radiation for image generation, MRI utilises the principles of nuclear magnetic resonance (NMR) to generate sectional images. The NMR principle involves the interaction of atomic nuclei with imposed magnetic fields, which cause
radio frequency NMR signals.70 For NMR the atomic nuclei must have a magnetic
moment and this presupposes a net nuclear spin.
The most common magnetic nucleus in tissues is the hydrogen nucleus, which is a single proton, and diagnostic imaging applications of NMR almost exclusively involve the hydrogen atom. Bone has a relatively poor hydrogen concentration and is therefore poorly displayed. The hydrogen content in soft tissue molecules yields, in contrast, excellent separation of for example water, fat, proteins and carbohydrates. These components are not so well separated in CT, and MRI and CT are therefore supplementary to each other concerning anatomical imaging.
The image contrast in MRI is determined by the NMR signal strength, which is influenced by the proton density and the T1 and T2 relaxation times. The influence of these parameters is determined by the pulse sequence settings, which aim at optimising the contrast in the tissue of interest. If the tissue contrast depends on differences in T1 times, the pulse sequence is termed T1 weighted, while T2 weighted sequences express tissue differences in T2 times.
Analogous to the CT modality, dynamic contrast enhancement is also applicable for MRI studies. DCE-MRI is conducted by injecting a paramagnetic contrast agent, for example Gd-DTPA, followed by repeated image acquisitions of a selected volume after the injection. The temporal changes in tissue contrast can then be measured and analysed. As tumour oxygenation is dependent on the vascularisation, this is a proposed method for evaluating tumour hypoxia, as for CT.71
MR scanners may also provide diffusion weighted imaging and magnetic resonance spectroscopy (MRS). Such imaging capabilities are of minor relevance for the current work and will not be further outlined here.
PET
PET is a nuclear medicine imaging technique that makes use of positron emitting isotopes such as 11C, 13N, 15O and 18F. The isotopes are incorporated into biological molecules which act as tracers. The tracers have equal or similar chemical forms as naturally occurring biological substrates and can be taken up by cells. The emitted positrons slow down to thermal equilibrium in the tissue and recombine with electrons. This happens in a few picoseconds after emission and results in pairs of 0.511 MeV annihilation photons, emitted in opposite, collinear directions and registered in a 360° detector array around the patient. The positrons have a mean travelling distance of up to 1 mm in tissue and together with a small non-co-linearity in the order of 0.25° for the annihilation photons, this affects the obtainable spatial resolution of the PET images.70
PET imaging provides information with high contrast resolution, but is limited
as a stand alone imaging modality due to its relatively low anatomical resolution.64
However, the combination of PET and CT into a clinical hybrid PET/CT scanner enabled simultaneous functional and structural imaging. Additionally, information from the CT scan could now be used for attenuation correction of the PET images. This provided correct quantification of tracer uptake in each voxel. Another option which is recently introduced is the combination of PET and MRI, but this will not be further outlined here.
The introduction of a faster lutetium oxy-orthosilicate (LSO) scintillator ten years ago, with high light output, improved the spatial resolution from around 6.5 to 4 mm. This also brought down the possible image acquisition times to 5 minutes for a
whole-body scan.72 The LSO technology has further enabled time-of flight (TOF)
scanners, which track the time difference between the two annihilation photons and thus improves the resolution and signal-to noise ratio.
As for CT and MRI, dynamic data acquisition is possible also for PET. This is performed by the use of list mode (LM) acquisition where all events are registered chronologically together with time stamps from the time of tracer injection. The
resulting dynamic image series thus include both the wash-in, or perfusion, phase and the metabolic phase. After completion of the image acquisition, data from a certain time interval can be selected and image reconstruction over that time interval may be performed. This allows for 4-D imaging of the temporal and spatial uptake of the tracer. As the tracer is distributed via the vascular network, dynamic PET (D-PET) can provide measures of tumour vasculature in addition to the active tracer uptake in target cells. PET tracers
There is a large number of tracers available for PET imaging and a selection relevant for marking of metabolism, hypoxia and proliferation will be presented.73
The most widely used and investigated PET tracer is the glucose analogue FDG,
which utilises the highly increased glucose metabolism in cancer cells.64, 73 FDG is
taken up by cells and phosphorylated by hexokinase to FDG-6-PO4 (Fig. 5). Unlike the
normal metabolite glucose-6-PO4, this phosphate can not proceed in the glycolysis and
is not further metabolised. FDG-6-PO4 therefore accumulates in the cells and allows
imaging of disease involvement.74 A similar principle exists also for some of the other
radiotracers described below. FDG uptake in the tumour is linked to aggressiveness, resistance to treatment and poor prognosis.64, 75 Still, FDG is not an absolutely specific measure for tumour tissue. Other types of tissue also take up FDG, such as inflammatory tissue, salivary glands and certain muscles.
The upregulation of the glucose transporters (GLUTs) and the glycolytic hexokinase enzyme (HK-II) in the glycolytic pathway may be induced by the hypoxia-inducible factor (HIF-1Į). It has therefore been discussed if FDG could serve also as a
hypoxia marker.76, 77 However, tumour cells can undergo glycolysis followed by
anaerobic lactic acid fermentation even under aerobic conditions, called the Warburg
effect.78 It has been shown that FDG is not well suited for assessment of the oxygen
status of tumours.64, 77, 79
Several PET tracers are available for imaging of hypoxia, predominantly for
marking of chronic hypoxia.19, 64 These are mainly 2-nitroimidazole derivates, such as
18F-fluoromisonidazole (FMISO) and 18F-azomycin-arabinoside (FAZA), which
accumulate in hypoxic regions by binding to intracellular macromolecules in viable
specifically accumulates in a hypoxic microenvironment, through the selective reduction of its metal component. Other hypoxia tracers are fluoroerythronitroimidazole (FETNIM), fluoroetanidazole (FETA) and the nitroimidazole EF5.73
Vascular
Tumour Cell
18FDG
K
K
Glucose transporter protein 18FDG 18 FDG-6P 18FDG-1-P 18F-fru-6-P 18 FDG-6- Phospho- glucono-lactone HMP shuntGlycolysis
Glycogen
X X XK
K
Hexokinase Glucose-6-phosphataseVascular
Tumour Cell
18FDG 18FDG
K
K
K
K
Glucose transporter protein 18FDG 18 FDG-6P 18FDG-1-P 18F-fru-6-P 18 FDG-6- Phospho- glucono-lactone HMP shuntGlycolysis
Glycogen
X X XK
K
Hexokinase Glucose-6-phosphatase 18FDG 18FDG 18 FDG-6P 18 FDG-6P 18FDG-1-P 18F-fru-6-P 18 FDG-6- Phospho- glucono-lactone HMP shuntGlycolysis
Glycogen
X X XX XXK
K
K
K
Hexokinase Glucose-6-phosphataseFigure 5. The uptake and accumulation of FDG in cells. Adapted from Heron et al.74 Tumour-cell proliferation can be successfully imaged using 18F-fluorothymidine (FLT), which is retained inside the cell. FLT is specifically active during DNA synthesis and serves as S-phase marker. FLT PET may thus potentially be used to aid the identification of rapidly proliferating tumour subvolumes, and to prospectively assess the response to treatment.64 Other proliferation radiotracers are also available, such as thymidine, deoxyuridine, methyl-methionine (MET) fluoroethyl-L-thyrosine (FET) and choline.73
All the factors causing increased radioresistance or recurrence of tumour growth should be included when defining the target volume for radiotherapy. The anatomically defined gross target volume (GTV) from CT and MRI should therefore preferably be expanded with a biological target volume (BTV), defined by specific radiotracers in PET. This may result in an expanded, reduced or spatially shifted GTV.73
SUV
The standardised uptake value (SUV) is used as a tool, both to supplement visual interpretation of tracer uptake in PET images and for semi-quantitative analysis. SUV is a dimensionless ratio of g normalizin tissue
Q
Q
SUV
(12)where Q is defined as average activity per unit volume. A Qnormalizing can be the whole
body, the contralateral anatomical site, or an organ, for example liver or brain.80
The reason for the SUV’s popularity has been the need for a reliable
reproducible measure of uptake. This need stems from intrapatient comparisons during therapy monitoring, from interpatient comparisons in the diagnostic process, relating to
degrees of pathology, and from comparisons of data between institutions.80 The SUV is
subject to errors, however, and criticism about the methodology has been made.81
Factors like body composition, length of uptake period, plasma glucose and partial volume effects should be considered.
3.6.
Radiotherapy
Historical overviewWilhelm Conrad Röntgen discovered x-rays in 1895 and the first treatment of cancer
was accomplished less than 60 days later by Emil Grubbé in Chicago.35 He initiated
clinical radiotherapy by treating an advanced, ulcerated breast cancer in January 1896. However, treatments with these low-energy x-rays of 10-50 kV, and later with ortho-voltage x-rays of 200-500 kV, suffered from several drawbacks. The therapy had low penetration power, gave high surface layer doses in healthy tissue, and resulted in unwanted high doses in bone. Meanwhile, the discovery of natural radioactivity by Henry Becquerel in 1896 and isolation of radium in 1898 by Marie Curie paved the way for utilisation of high-energy photons in cancer therapy. Lead-encapsulated radium
needles and tubes were applied with a few centimetres of skin distance, and they enabled treatments of more deeply seated tumours. Other applications of radium were also developed, such as implantation of radium needles directly into the tumours, and irradiation via natural body cavities. Such brachytherapy applications are today still highly used, but now with sophisticated after loading equipment and a variety of radioactive isotopes as radiation sources.
Parallel to the development of radium therapy, new methods for producing high-energy radiation were developed. A method for accelerating electrons by means of radiofrequency fields was proposed by Gustaf Ising in 1925, and a real life model of a
50 keV linear accelerator (linac) was demonstrated by Rolf Widerøe four years later.82
Before and during the Second World War, the microwave technology was developed and betatrons and higher energy electron linacs could thus be constructed. The first electron linac designed for radiotherapy was introduced at Hammersmith Hospital in London in 1953, and three years later there were seven clinical linacs altogether,
worldwide.82, 83 These high energy treatment beams overcame to a great extent the
limitations of the low-energy and ortho-voltage x-rays.
During the last four decades technological progress has led to a significant improvement of the local control rates of many tumours, even in patients with locally
advanced tumours.35 Treatment planning and medical imaging has profited enormously
from the revolution in computer technology. The functional and anatomical tissue properties mapped by CT, MRI and PET have enabled determination of the size and location of the tumour. Beam shaping and radiation shielding by MLCs in combination with advanced, intensity modulated beam delivery have further improved the possibility to maximise the dose to the tumour and minimise the dose to healthy normal tissue. Image guidance in radiotherapy has also contributed to this, and has enabled treatment monitoring and interactive adaptation of the treatment based on daily assessment of
changes in tumour volume and response.84
The conventional linac gantry has an isocentric movement and rotates 360° around the patient (Fig. 6). The actual beam producing structure has not changed much over time, however, and the same technological principles are used today as in the time of early linac history. The later developments in treatment techniques have resulted mainly from the digitalisation of the linac control systems and from added equipment.
The last decade has also provided alternatives to the conventional x-ray linac design, such as the ring concepts of tomotherapy and of Vero, but these will not be outlined here. The utilisation of protons and heavy ions in cancer therapy will likewise not be described.
Figure 6. Modern linear accelerator with add-on imaging equipment. Radiation gantry and collimator (above the table), volume imaging system x-ray source (to the right) and detector (
to the left),
and electronic portal imaging detector (below the table, partly covered). From Elekta AB web pages.Image registration and fusion
CT images are the foundation for 3-D dose planning. The planning CT may assume the role of an anatomically correct backdrop for the information provided by the MRI and PET modalities, which may have inherent image nonlinearity (MRI) or lack of anatomical resolution (PET).85 Information from the two latter modalities may be included by manually comparison and hand transfer of the data to the planning CT, which is time consuming and unlikely to be accurate. The image sets can alternatively be fused by a full 3-D image registration. Such image registration is based mainly on two methods; landmark registration and intensity-based registration, the latter also called maximisation of mutual information.67, 85
Landmark registration is based on manual segmentation or identification of common structures in the two images to be aligned, and is suitable for image sets with clearly identifiable anatomical reference points, or markers. The intensity-based registration approach is an automatic iteration method. It utilises mutual information in
two images to find a similarity measure, which is maximised at the optimal alignment. Mutual information is user independent and suitable for images from different modalities. The integration of PET and CT into a dual-mode scanner has eliminated user-based registration for this modality. There are still pitfalls, however, since the two data sets are not acquired simultaneously and with different longitudinal table positions.85
When image registration has been performed, the image sets must be displayed in a coherent way to evaluate the relationship between them. A common way is to display the information from both images simultaneously as overlays in one image. Different methods for this are used, including colour overlay, dynamic alternating display, split view and subtracting images (Fig. 7).67
Figure 7. CT image with colour PET overlay. Two types of split views are shown.
IMRT
Intensity-modulated radiotherapy (IMRT) allows for the radiation dose to conform more precisely to the 3-D shape of the tumour compared to classical 3-D conformal radiotherapy (3-D CRT).86, 87 IMRT provides the ability to deliver a high dose to the
partially or fully surrounded by the target, or by a combination of targets (Fig. 8). IMRT also allows higher radiation doses to be delivered to regions within the tumour.
Figure 8. Left posterior view of a head and neck cancer treated with IMRT. The 54 Gy isodose (dark yellow) is partly covering the planning target volume (PTV) (blue). The isodose surface is wrapped around the spinal cord (purple with orange margin) and the larynx (orange). The right and left parotids (brown) are partly spared.
Advanced MLCs were on a broad scale released to the marked in the middle of the 1980s. These collimators had leaves of typically 10 mm width, which could be moved independently of each other into the treatment field. This facilitated both a more conformal shape of the treatment field and modulation of the photon beam intensity. IMRT, which was developed a few years earlier, could now be accomplished by modulating the intensity of a large number of small beamlets, typically 10x10 mm, within the radiation fields.35, 88
To determine the beamlet weights which achieved, or at least closely approximated, the desired dose distribution, inverse treatment planning algorithms were developed. Solving the inverse treatment planning problem was based on works from the 1980s and is today the most common strategy for IMRT.89, 90 In inverse treatment
planning algorithms the desired dose to targets and dose limits of critical structures are defined as a basis, and intensity-modulated beam arrangements are derived to acceptably meet these desired dose objectives.87 This is in contrast to forward planning
algorithms, which have the treatment beams as a starting point. Commonly, the iterative inverse planning process is driven by the minimisation of a composite objective function, formed by weighting together the dose volume objectives, while fulfilling the dose volume constraints for the critical structures in a better and better way along the
optimisation process.91 By using a sequencer, the beamlets may be grouped together in
typically 50 fields or more to assure a more efficient and faster delivery of the treatment.
IMRT may be delivered in different ways, but the main distinction is made between static and dynamic delivery. If the MLC leaves move during beam delivery, the
treatment is referred to as dynamic, or sliding window.87 If the beam is turned off
between each change of the collimator setting, the delivery is termed step-and-shoot. Typically 7-12 beam directions, or gantry angels, are used for implementing an IMRT
plan.88 The beam may also be on during rotation of the gantry. This modality is then
called volumetric modulated arc therapy (VMAT). The term intensity modulated arc therapy (IMAT) is also used.
MLCs with leaf widths down to 1.6 mm have been developed to increase the resolution of the treatment field. Some of these MLC types are add-on equipment introducing smaller maximum field sizes, while others are standard, full field collimators.
Dose painting
As described in chapter 3.3, radioresistance may be heterogeneously distributed within the tumour. The radioresistant regions may be targeted by integrating biological information into the inverse planning of IMRT. Different studies have suggested that molecular and functional imaging could form the basis for selective boosting of tumour subvolumes.6, 8, 85, 92, 93 This procedure is called dose painting and strives to tailor the exact dose distribution needed for eradication of all tumour cells.6, 7, 73, 88, 94 The benefit of this approach was shown by mathematical modelling more than 20 years ago, and later modelling studies of the dose painting concept have estimated large gains in
tumour control probabilities and improvements in dose distributions within the tumour volume.9-14
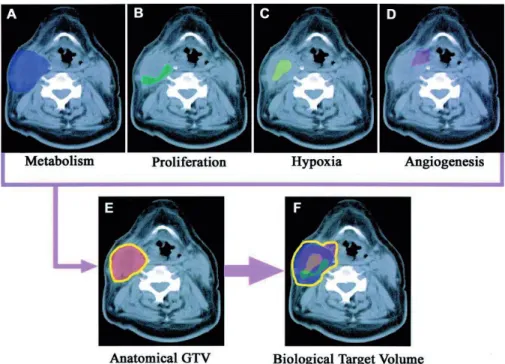
Planning for dose painting starts with segmentation of target volumes and organs at risk. These definitions are made on bases of CT images in combination with functional imaging, depicting biological processes in the tumour tissue that influence radiosensitivity (Fig. 9). Such imaging modalities may be PET, DCE-MRI, DCE-CT, and MRI spectroscopy.7 Two different dose painting approaches have been proposed.
Dose painting by contours (DPBC) prescribes a global dose objective inside the biological image-based contours, where the intention is to reach a certain dose value within the given target.6, 8 Dose painting by numbers (DPBN), or dose painting by voxel intensity, prescribes the dose inside the target for each voxel as a function of the signal intensity of that voxel in the biological image (Fig. 10).7, 9
Figure 9. Imaging paradigm in radiation oncology integrating different functional imaging modalities (panel A-D) with CT defined GTV (panel E) to obtain a combined BTV (panel F).73
Figure 10. (A) Anatomical PTV. (B) Biological PTV. (C) Fusion of (A) and (B). (D) contour based dose painting. (E) voxel-intensity based dose painting.88
The dose prescriptions in dose painting are also differentiated in two strategies; dose escalation and dose redistribution. Dose escalation applies additional dose to the radioresistant subvolumes of the tumour.95, 96 Dose redistribution increases the dose to
the radioresistant parts while reducing the dose to the rest of the tumour, keeping the mean dose constant.95-97
Commercial treatment planning systems generally use dose-volume parameters to prescribe the desired dose distribution. This is not compatible with the DPBN approach, which uses voxel-based dose optimisation, and research treatment planning
software has so far been a prerequisite for true DPBN planning.98-100 However, the
DPBC formalism may approach the DPBN formalism by increasing the number of contour levels.21, 98 This makes planning for simplified DPBN feasible using an ordinary
dose planning system, yet making optimisation and evaluation cumbersome as the number of volumes increases. In any case, a relationship between the biologically based voxel intensities and prescribed doses has to be established.98, 99
An inherent limitation in the resolution of the delivered dose distribution is caused by the application of photons as radiation source. The lateral scattering range and accompanying energy deposition several millimetres away from the interaction point inevitably restricts the obtainable steepness of the dose gradients.
The clinical value of dose painting has not yet been proven by appropriate trials.88, 101 A few focal dose escalation studies have shown, however, that the treatments
are well tolerated and do not increase normal tissue toxicity.102, 103 There are a number of uncertainties and unknown factors which reside mainly in insufficient knowledge regarding the biological meaning of functional imaging, the predictive value of a given imaging parameter for radioresistance, and the uncertainties in the transformation of radiobiological factors to desired dose and dose constraints.88, 98, 104 Another issue which
have received little attention so far, is how well the treatment planning systems can deliver appropriate dose plans for dose painting objectives and the accuracy of such treatment deliveries.21
Due to the large dose gradients arising when prescribing focal dose escalation, one may further expect that high resolution MLCs will be a prerequisite. This is an issue which has received little attention in the literature so far.21 MLC leaf width may be an
issue for effective treatment delivery in biologically adapted therapy and the problem should now be addressed.
In-room imaging systems
Developments in medical imaging have increased the ability to localise the target for precise administration of radiation. This is advantageous not only for designing treatment plans, but also for localisation of the target, the target motion, and the target changes during treatment. During the last decade the development within in-room imaging has moved from electronic portal imaging devices (EPIDs) towards volumetric patient imaging. For conventional linac designs, excluding tomotherapy and Vero, there are currently two main solutions for this; in-room CT, or CT-on-rails, and cone-beam CT.105
In-room CT is an integration of a CT-scanner in the linac treatment room, enabling imaging of diagnostic quality with the patient positioned on the treatment table. Imaging and treatment isocentres are not coincident, however, and the patient has to be transported on the treatment table between the two modalities.
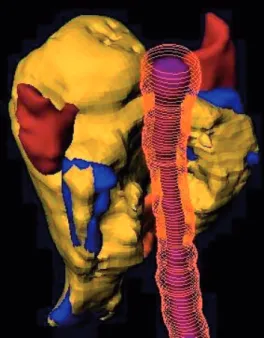
CBCT systems perform tomographic reconstruction from a series of two-dimensional (planar) radiographs obtained by one half or one full rotation of the x-ray source around the patient. Due to the use of a cone-shaped beam and a large area flat panel detector, the whole longitudinal imaging volume of the patient is registered simultaneously (Fig. 11). This eliminates the need for a longitudinal movement of the patient during imaging. The image resolution is good, but the elevated levels of scattered radiation into the imaging system cause reduced image contrast compared to conventional CT systems.
Two main systems are in use for CBCT imaging. Kilovoltage (kV) cone-beam systems use a conventional CT x-ray generator as radiation source. This add-on system operates at a 90° angle with the treatment beam and introduces thereby sub optimal mechanical precision. Megavoltage (MV) cone-beam systems use the treatment beam for imaging. The imaging system is then in-line with the treatment system and has in principle identical isocentres. Artefacts from structures of high atomic number in the patient are avoided due to the high energy, and the images can in principle also be used for reconstruction of delivered doses. However, the MV beam energy causes low image