Green High Performance Computing
Corey Hemminger and Dustin Rogers
Information Systems (IS)
St. Cloud State University
720 4
thAve South
St. Cloud, MN 56301-4498
[email protected]
[email protected]
Abstract
Today's computer hardware is very diverse and has varying levels of performance and power consumption. High Performance Computing (HPC) has become an umbrella term for a number of different computing and networking sciences. The types of applications HPC can serve are up to the creativity of the programmers, but include: database applications, science and chemical modeling programs, mathematical computation algorithms, just to name a few. Distributed Processing is taking a program, and instead of running the components on one processor, we use many processors. However, due to the very nature of creating ‘clusters’ of computers, HPC can also be very resource intensive. The goal of this project will be to compare and contrast the TCO and performance factors of three (3) computers of varying factory classifications.
Introduction
Today's computer hardware is very diverse and has varying levels of performance and power consumption. It is generally assumed that the more energy conservative a machine is reported to be...the higher the purchase price. The cost associated with the initial purchase and operation over time, commonly referred to as total cost of ownership (TCO), varies however. Therefore, determining the best choice for an intensely used computer, or many computers, becomes a very difficult, and time consuming process. It is our belief that these types of comparisons are generally done privately, and the knowledge acquired is kept as such. The goal of this project will be to compare and contrast the TCO and performance factors of three (3) computers of varying factory classifications; High-wattage, consumer-grade hardware, low-wattage, consumer-grade hardware, and finally low-wattage, server-grade hardware. For comparison, performance will be measured in two different quantities; energy consumption and data computation. Data computation is measured by recording the completion time of the same, advanced mathematical calculations on each machine. Energy consumption is measured with a standard ‘plug-in power meter’. This device is placed in-line between computer and the wall outlet to measure the electricity being drawn by the device. The literature review of comparable work reveals while there is not a great deal of material available directly related to this type of analysis, there is a wealth of information promoting the importance of green computing.
Background Information - High Performance Computing
High Performance Computing (HPC) has become an umbrella term for a number of different computing and networking sciences. For the Business Computing Research Lab, HPC refers to three main areas of research and development; Distributed Processing, Distributed Encryption, and Distributed Storage.
As you probably have noticed, all three categories share a common word in their titles, “Distributed”. The word ‘distributed’ here means to ‘logically divide’. When we run a non-distributed computer program, different components of the program are sent individually to the computer’s brain, or processor, to be computed. Distributed Processing, for example, is taking a program, and instead of running the components on one processor, we use many processors. So we are logically dividing a program to run on many brains. We can build single computers with many processors, and/or we can ‘cluster’ many computers together.
Just as computers can have processors, they also have long-term memory space, found on devices know as hard disk drives. One of the popular uses of large amounts of memory (disk space) is to hold large databases. Business databases today can easily become too large to be accommodated by one disk, or even one computer. Again, by configuring a ‘cluster’ of computers to pool all available disk space, you can then create a large enough space for a database of virtually any size.
Half of the job becomes building a system that can run the program. The other half is having the advanced knowledge it takes to manipulate and configure the applications. This is one of the many situations in which the BCRL becomes a tool to other departments on the Saint Cloud State University’s campus. The types of applications HPC can serve are up to the creativity of the programmers, but include: database applications, science and chemical modeling programs, mathematical computation algorithms, just to name a few. This makes HPC a great tool to serve the needs of various fields of study.
Problem
High Performance Computing (HPC) can serve as a powerful research and development tool. However, due to the very nature of creating ‘clusters’ of computers, HPC can also be very resource intensive. Each one of the computers requires power. Anytime we use electronics, we create heat. These are the two foes of HPC, heat generation and power consumption. Currently, the best and most practical way to battle the former is with some type of air conditioning and many fans. Obviously this solution is a direct contributor to the latter problem, power consumption.
Therefore, by building computers that use less energy overall, the BCRL would be able to combat both problems. The theory is, that by using less electricity, the ‘clusters’ will produce less heat. Less heat will require less cooling, also consuming less power.
There is a catch. Unfortunately, as the power efficiency of the ‘green’ components ascends, so does the price. Also, prices in the computer component field are highly dynamic. The prices can vary due to both, time and place of purchase. Component prices depreciate as new technologies are made available to the public.
Solution
It is the intentions of the BCRL staff to research a ‘green’, or power efficient computer that will serve as the prototype node of the next generation BCRL HPC cluster. The goal is to build a computer that is affordable to replicate, yet still is capable of serving the computing needs of the stakeholders in the BCRL.
Hypothesized Benefits
• Will get lower power consumption which is better for the environment (Green) from machine A.
• Lower power consumption is cost effective.
• Researchers using the High Performance Computing Systems of the BCRL will benefit from the gain in processing power.
• Machine C will use twice the power of Machine A since Machine C has double the processors and four times the number of RAM chips in it.
• The CPU's power efficiency rating will make the biggest difference in total power consumption of a computer.
Research and Findings
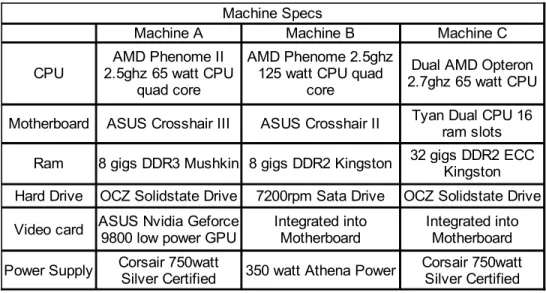
3 machines were built with different grades of hardware:
• Machine A has a 65 watt 2.5 GHz CPU, consumer grade hardware computer.
• Machine B has a 125 watt 2.5 GHz CPU, consumer grade hardware computer.
• Machine C has dual 65 watt 2.7 GHz CPU, server grade hardware.
Due to lack of funds and hardware available we weren't able to test a fourth machine which would have been configured as a server grade hardware and dual 125 watt 2.7 GHz CPUs. We expect that the two server grade machines would scale the same as the consumer grade machines. See Table 1 for specifications.
Table 1: Hardware Specifications
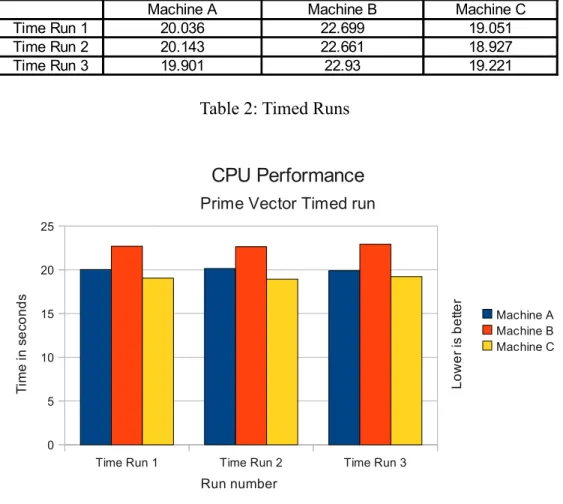
Each Machine has a Unix or Linux operating system. Each of the machine’s performances were measured with a timed run of a Java vector based prime number program set to find 10,000,000 numbers with results shown in Table 2 and Figure 1.
Machine Specs
Machine A Machine B Machine C
CPU
Motherboard ASUS Crosshair III ASUS Crosshair II
Ram 8 gigs DDR3 Mushkin 8 gigs DDR2 Kingston
Hard Drive OCZ Solidstate Drive 7200rpm Sata Drive OCZ Solidstate Drive Video card
Power Supply 350 watt Athena Power AMD Phenome II
2.5ghz 65 watt CPU quad core
AMD Phenome 2.5ghz 125 watt CPU quad
core
Dual AMD Opteron 2.7ghz 65 watt CPU Tyan Dual CPU 16
ram slots 32 gigs DDR2 ECC
Kingston
ASUS Nvidia Geforce 9800 low power GPU
Integrated into Motherboard
Integrated into Motherboard Corsair 750watt
Table 2: Timed Runs
Figure 1: Timed Runs
The program only maxed out one core of each machine to get a comparison measurement of the speed of the CPU. The interesting results found in Table 2 and Figure 1, are that all the central processing units (CPUs) performed negligibly different, with only a couple of seconds difference between CPUs. Even though machine C is 200 MHz faster and machine A and B had a similar gap with each being rated for the same speed and differing in the power used. The higher wattage CPU in machine C took the longest to finish the program. However, from the end users perspective, a difference of only a couple seconds is not going to be very noticeable.
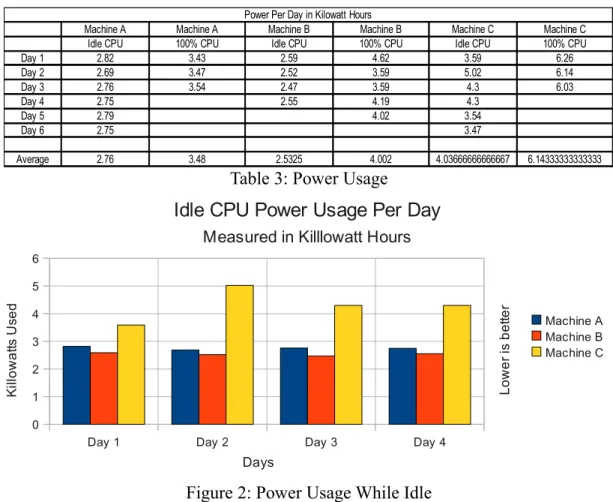
Power was measured with a “kill a watt” electric monitor over several days. All three machines were measured while idle for a few days and kilowatt-hours (KWH) measurements recorded daily. Then we executed the same program on three machines, which in turn used one hundred percent of the CPU, across all cores, for a few days and KWH measurements were recorded daily. The results are listed in Table 3 and Figure 2.
Time Run 1 Time Run 2 Time Run 3 0 5 10 15 20 25 CPU Performance Prime Vector Timed run
Machine A Machine B Machine C Run number T im e in s e co n d s L o w e r is b e tte r
Machine A Machine B Machine C
Time Run 1 20.036 22.699 19.051
Time Run 2 20.143 22.661 18.927
Table 3: Power Usage
Figure 2: Power Usage While Idle
In Table 3 and Figure 2 we can see that machine B actually uses slightly less power than the more efficient machine A while idle. While machine C having twice the hardware than machine A and machine B, it only uses about a third more energy, while idle.
Figure 3: Power Usage While 100% CPU Load
Day 1 Day 2 Day 3
0 1 2 3 4 5 6 7
100% CPU Power Usage Per Day Measured in Killlowatt Hours
Machine A Machine B Machine C Days K ill o w a tts U se d L o w e r is b e tte r
Power Per Day in Kilowatt Hours
Machine A Machine A Machine B Machine B Machine C Machine C Idle CPU 100% CPU Idle CPU 100% CPU Idle CPU 100% CPU
Day 1 2.82 3.43 2.59 4.62 3.59 6.26 Day 2 2.69 3.47 2.52 3.59 5.02 6.14 Day 3 2.76 3.54 2.47 3.59 4.3 6.03 Day 4 2.75 2.55 4.19 4.3 Day 5 2.79 4.02 3.54 Day 6 2.75 3.47 Average 2.76 3.48 2.5325 4.002 4.03666666666667 6.14333333333333
Day 1 Day 2 Day 3 Day 4
0 1 2 3 4 5 6
Idle CPU Power Usage Per Day Measured in Killlowatt Hours
Machine A Machine B Machine C Days K ill o w a tts U se d L o w e r is b e tte r
With the CPU's maxed out at 100% usage, in Figure 3 we see that the machines electrical consumption is pretty close between machine A and B even though machine B's CPU is rated to consume twice the power. Again Machine C scales the same as when idle and uses only an extra one third of the power compared to the other two.
After monitoring power consumption, figures were made to calculate cost of electricity and total cost of ownership for five and ten years. The average consumer grade computer's useful life cycle is about five years, compared to a server grade computer’s life-cycle of approximately ten years. Electricity costs were calculated per month by taking the average of the power measurements, multiplying them by $0.13, (Excel Energy cost per KWH, rounded off accordingly), and multiplying that by thirty to emulate the days in a month.
Table 4: Total Cost of Ownership
Figure 4: Monthly Power Costs
Total Cost of Ownership
Machine A Machine B Machine C Machine Cost $1,098.96 $990.34 $2,976.53 PCM 100% CPU $13.57 $15.61 $23.96 PCM Idle CPU $10.76 $9.88 $15.74 PCM 50% 50% $12.17 $12.74 $19.85 $1,924.59 $1,939.81 $4,434.04 $2,750.22 $2,889.29 $5,891.54 Total Cost after 5
years assuming 100% CPU Load Total Cost after 10 years assuming 100%
CPU Load
Power Cost Calculated by multiplying the average power use per day by $0.13 per KWH from excel Energy and 30 day month.
PCM 100% CPU PCM Idle CPU PCM 50% 50% $0.00 $5.00 $10.00 $15.00 $20.00 $25.00 $30.00
Energy Costs Per Month Calculated using $0.13/KWH Machine A Machine B Machine C Power usage C o st
PCM = Power Cost per Month
L o w e r is b e tte r
Table 4 and Figure 4 show the cost of electricity per month with all three machines idle, 100% CPU load, and with half of the month being idle and half of the month at 100% CPU load (50% / 50%). From the data we can see that machine B, (over time, while sitting idle,) is the cheapest to run, but is more expensive than machine A when in use for long periods of time. Machine C having twice the hardware generates only about thirty percent higher operational costs.
Table 4 shows the total cost of ownership which is the price of the machines plus power usage cost over several years. When broken to a cost, per core on each machine, over ten years; machine A costs $687.56, machine B costs $722.32, and machine C costs $736.44 to operate, per core.
Looking at the total cost of ownership and performance per core machine A is the most cost effective and lowest power consuming/green choice to operate for a single computer. If looking at a cluster of computer's working together on computational problems such as those encountered in a distributed computing environment, then machine C will have a higher cost of ownership per core. However, it will use significantly less energy when looking at systems with tens or hundreds of processors used in a cluster environment. Overall we were very surprised at how close all three machines faired in performance and power usage, given their range in hardware and power consumption ratings.
Literary Review
Power Management Difficulties
While it has always been obvious that all electronics consume energy, it has only recently become one of society’s driving forces to reduce the amount of energy in which electronic devices consume. It has also become blatantly apparent that computers have become one of the key players in the electronic device revolution. There are two broad categories regarding energy conservation in smarter devices such as computers. The first category involves creatively programming a ‘smarter’ device to only consume the energy that it requires. We will refer to this strategy as the ‘software strategy’ due to the fact that it involves a certain amount of programming.
Standards set forth by the U.S. Environmental Protection Agency’s (EPA) Energy Star program require that office equipment have the ability to conform to low power standards when not being used. Computer operating systems are then programmed to control the Advanced Configuration and Power Interface (ACPI) that is capable of giving the administrator the option to lower the power consumption of a particular machine. In an article published in the 2005 issue of the International Journal of Network Management entitled “Managing energy consumption costs in desktop PCs and LAN switches with proxying, split TCP connections, and scaling of link speed” Chamara Gunaratne et al report that “sixty percent of all desktop PCs remain fully powered on during nights and
weekends, with existing power management almost always disabled.”[2] They also state that “failure to maintain network connectivity in sleep is the principal reason…power management features are often disabled due to the inconveniences that they present to users and network administrators.” Gunaratne and colleagues continue to describe various energy-saving methods that have been used, or that they are proposing through their research.
The Electronic Product Environmental Assessment Tool(EPEAT) defines three levels that can be obtained by specific computer models based on various criteria; gold, silver, and bronze. The criteria that the EPEAT ratings are based on IEEE 1680-2600 standards, which vary from ‘materials selection’ to ‘reduction/elimination of environmentally sensitive materials’. One of the categories, entitled ‘energy conservation’ is defined as follows; ENERGY STAR compliance is required. ENERGY STAR is the standard set that defines the ACPI capabilities of the machine, such as a computer that can turn the hard disk off when the system is idle. Although ENERGY STAR does specify that systems should use resourceful components, ENERGY STAR compliance does not define the levels of electricity that the devices must use. To exaggerate our point, under ENERGY STAR compliant conditions, we could use a hard disk that required one million watts, as long as it went into a low-power state when idle. The three optional requirements are ‘early adoption of new ENERGY STAR specification’, ‘renewable energy accessory available’, and ‘renewable energy accessory standard’.
Whether in use or not, conserving energy using the software strategy is fine for office or classroom lab settings in which computers can be expected to remain idle a majority of the time. On the other hand we have a second set of office and lab settings in which computers are used to the maximum potential a majority of the time. The second category regarding energy conservation in smarter devices involves manufacturing components that consume less energy to begin with. We will call this strategy the ‘hardware strategy’ because the goal is to assemble a complete computer with energy efficient components. . The literature review of comparable work reveals while there is not a great deal of material available directly related to this type of analysis, there is a wealth of information promoting the importance of green computing.
We feel that educating network administrators on the value of energy conservation is important, but they cannot be blamed for the massive amounts of energy being consumed by the electronics under their jurisdiction. We demand that these people provide us with unobstructed network connectivity, therefore when a power management feature gets in their way; we can already guess which service is going to win. Ideally, a synthesis if the two situations would prevail. That is, using energy efficient components to construct a computer; and then programming the computer to switch to low-power modes when idle using ENERGY STAR techniques.
References
[1]Computer Specification : ENERGY STAR. (n.d.). Home : ENERGY STAR. Retrieved February 8, 2010, from http://www.energystar.gov/index.cfm? c=revisions.computer_spec
[2]Gutaratne, C., Christensen, K., & Nordman, B. (2005). Managing energy consumption costs in desktop. International Journal of Network Management, 15, 297-310. Retrieved February 6, 2010, from http://citeseerx.ist.psu.edu/viewdoc/download? doi=10.1.1.121.4228&rep=rep1&type=pdf
[3]Excel Energy. (n.d.). Energy Prices Rates and Tariffs. Retrieved March 6, 2010, from http://www.xcelenergy.com/Minnesota/Company/About_Energy_and_Rates/Ener gy%20Prices%20%28Rates%20and%20Tariffs
%29/Pages/Energy_Prices_Rates_and_Tariffs.aspx
[4]Welcome to EPEAT. (n.d.). Welcome to EPEAT. Retrieved February 6, 2010, from http://www.epeat.net
[5]Welcome to GEC. (n.d.). Welcome to GEC. Retrieved February 8, 2010, from http://www.greenelectronicscouncil.org