University of North Florida University of North Florida
UNF Digital Commons UNF Digital Commons Library Faculty Presentations & Publications Thomas G. Carpenter Library
11-22-2019
Visualizations for the Digital Humanities Using Tableau Visualizations for the Digital Humanities Using Tableau
Jennifer L. Murray
Follow this and additional works at: https://digitalcommons.unf.edu/library_facpub Part of the Library and Information Science Commons
Visualizations for the Digital Humanities
Using Tableau
Jennifer L. Murray
UNF Digital Humanities Workshop
November 22, 2019
What is Tableau?
• Tableau is an easy-to-use business intelligence software used for data analysis.
• Tableau natively connects to dozens of data sources, including Oracle and MS-SQL, as well as local sources like MS-Access and Excel.
• Once connected you use drag and drop tools to visualize and create interactive dashboards.
• Visualizations can be presented to your audience via PDF, Tableau Reader, Tableau Server or Tableau Public.
•
It’s
Storytelling
•
News4Jax
tells a story every day
• Data visualization software that provides the ability to create interactive workbooks and dashboards to see and understand data in minutes.
• Tableau Desktop License
• $630/year for Desktop Professional License
• FREE for full time students, instructors and non-profit researchers:
• https://www.tableau.com/academic
• https://www.tableau.com/academic/teaching/course-licenses
• Connections to over 32 data sources and Drivers
• Oracle, Microsoft SQL, MySQL, DB2
• Microsoft Access, Excel, PowerPivot and Text • Any ODBC Compliant data source
• Actian Vectorwise, Amazon Redshift, Cloudera Hadoop, Cloudera Impala, DataStax, EMC Greenplum, Firebird, Google Analytics, Google BigQuery, Hortonworks, HP Vertica, BM DB2, IBM Netezza, MapR Distribution, Microsoft Access, Microsoft Excel, Microsoft PowerPivot, Microsoft SQL Server, Microsoft SQL Server Analysis Services, Microsoft Windows Azure, MySQL, OData, Oracle, Oracle Hyperion Essbase, ParAccel Analytic
Database, PostgreSQL, Progress OpenEdge, Salesforce.com, Force.com, Database.com, SAP HANA, SAP NetWeaver Business Warehouse, SAP Sybase, Teradata, Teradata Aster Data nCluster…
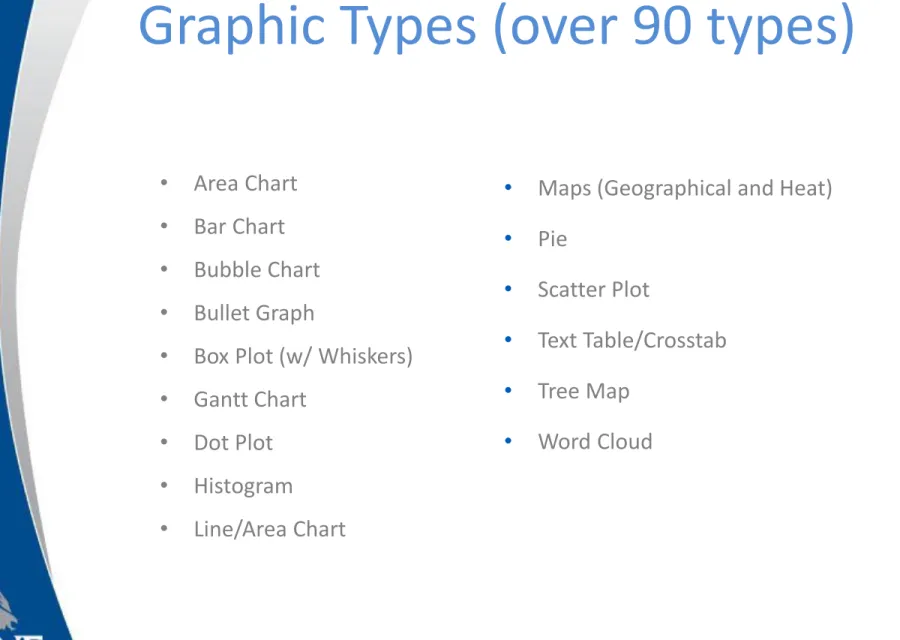
• Area Chart • Bar Chart • Bubble Chart • Bullet Graph
• Box Plot (w/ Whiskers) • Gantt Chart
• Dot Plot • Histogram
• Line/Area Chart
Tableau Desktop –
Graphic Types (over 90 types)
• Maps (Geographical and Heat) • Pie• Scatter Plot
• Text Table/Crosstab • Tree Map
• PDF, JPG, Data • Tableau Reader • Tableau Server • Tableau Online • Tableau Public • Embed on a webpage
• Video recording – Skype or Camtasia
Tableau Desktop –
Distributing Reports
• Making your reports and potentially YOUR DATA available to 7 Billion of your closest friends
• De-identify everything • Strip out non relevant data • Do not allow download • FREE with restrictions
• Support for data sets of up to 10 million rows
• Storage limit of 10 GB
• Data source limitations – i.e. Excel, Text, Access files
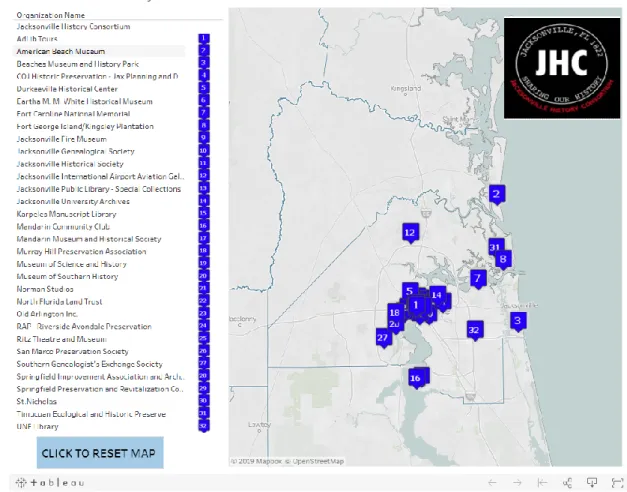
Tableau Demo: Mapping
• Tableau Public: https://public.tableau.com/views/Jacksonville-History-Consortium-Map/Jax?:display_count=y&:origin=viz_share_link
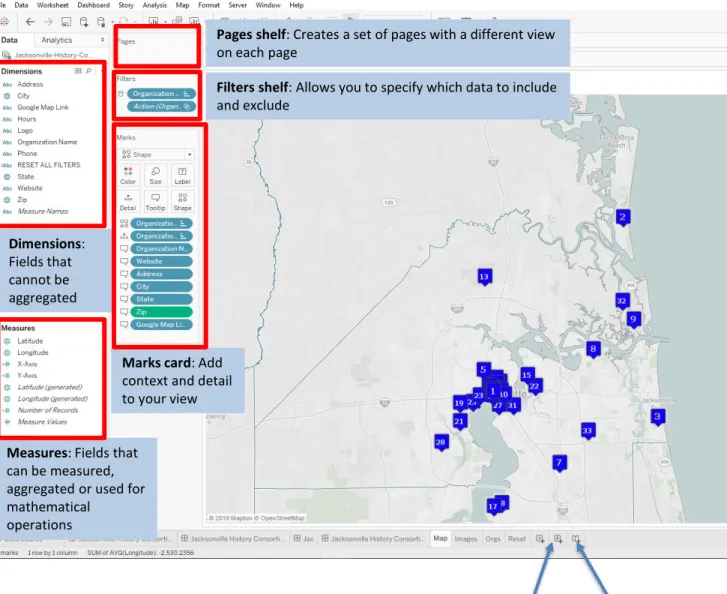
Dimensions: Fields that cannot be aggregated
Measures: Fields that can be measured, aggregated or used for mathematical
operations
Pages shelf: Creates a set of pages with a different view on each page
Filters shelf: Allows you to specify which data to include and exclude
Marks card: Add context and detail to your view
Tableau Worksheet
Dashboard: Collection of views from multiple worksheets
Story: Sequence of worksheets or dashboards that work together to convey information
Tableau Demo: Text Analysis
• Starter Kit for Text Analysis
https://www.kenflerlage.com/2019/09/text-analysis.html • Search for “Digital Humanities” in Tableau Public
https://public.tableau.com/en-us/search/all/digital%20humanities • 3 Easy Steps to Make Graphs
https://digitalhumanities.berkeley.edu/blog/17/06/26/3-easy-steps-make-graphs-tableau
• Add Image of Google Maps and OpenStreetMap as Background Images in Tableau https://help.tableau.com/current/pro/desktop/en-gb/bkimages_maps.htm • U.S. Census Bureau Vizzes
https://public.tableau.com/profile/us.census.bureau?eml=gd&utm_medium=email &utm_source=govdelivery#!/
• Getting Started
https://help.tableau.com/current/pro/desktop/en-us/gettingstarted_overview.htm • Free Training Videos
https://www.tableau.com/learn/training • Tableau Add-In for Reshaping Data in Excel
https://community.tableau.com/docs/DOC-10394
• Viz of the Day
https://public.tableau.com/en-us/gallery/?tab=viz-of-the-day&type=viz-of-the-day
“I think telling stories with data is
one of humanities most powerful
tools for affecting change.”
(Loree 2019)
Loree, J. (2019). Tableau Public Authors. Retrieved from
https://public.tableau.com/search/authors/hr%20analytics