MEASURING QUALITY MANAGEMENT SYSTEM PERFORMANCE USING QUANTITATIVE ANALYSES
by
Richard Angus Smith
Dissertation submitted in fulfilment of the requirements for the degree
Master of Technology: Quality
in the Faculty of Engineering
at the Cape Peninsula University of Technology
Supervisor: Mr A Bester Co-supervisor: Prof M Moll
Bellville
i
DECLARATION
I, Richard Angus Smith, declare that the contents of this dissertation/thesis represent my own unaided work, and that the dissertation has not previously been submitted for academic examination towards any qualification. Furthermore, it represents my own opinions and not necessarily those of the Cape Peninsula University of Technology or Eskom, Koeberg Power Station.
22 June 2013
ii
ABSTRACT
Many top performing businesses, which achieve superior levels of success and sustainability, have a sound, implemented, and well maintained, Quality Management System (QMS). The correlation between business success and an implemented management system has been shown in numerous papers. This research, which culminates in a quantitative measure of QMS performance, was conducted at Eskom’s Koeberg Nuclear Power Station (KNPS). The power station is the operating leg of the Koeberg Operating Unit (KOU). The researcher is a QMS lead auditor in the KNPS Quality Assurance Department.
A program of audits is planned based on the KOU quality and safety manual and the national regulatory licencing requirements. The audit monitoring program is then implemented over a three year period and considers all the management system processes which impact on nuclear safety and business performance. The individual audits each consider ISO 9001 criteria in context of the business area audited. Each major business area (e.g. design, maintenance, etc.) within the power station adheres to all generic ISO 9001 QMS clauses and considerations, such as documentation management, records management, etc. Each process or business area audit is thus effectively a QMS audit. The audit results, when combined are therefore a representative measure of the overall organisational QMS performance.
The potential value to be gained from the audit results and data accrued over the monitoring period has not been optimised to maximise the return on investment to Eskom. The research problem statement thus proposes that the performance measurement capability of the quality management system at Eskom's Koeberg Power Station is insufficient. This diminishes management's ability to identify business risk resulting from management system deficiencies, which impacts negatively on business performance. The research question seeks to determine how the performance
iii
measurement capability of the QMS can be improved to assist management in identifying business risk resulting from quality management system deficiencies in order to improve business performance.
The research objectives are supported by the literature study, which identifies the quality management methods currently used in order to measure and subsequently improve business performance. It also shows how QMS performance measurement, when deconstructed and analysed can provide the required insight for supporting management decision making. The research approach is considered inductive in that a theory is developed based on the collection and the analysis of that data. Applied research, will thus serve as the basis of the research methodology as it is considered the most appropriate research approach, based on the need to answer practical questions around the measurement of QMS performance philosophy.
The research shows that by introducing additional theming and severity data into the secondary audit findings data, it is possible over time to extract high level strategic direction information when analysing the additional metadata. The dimensions and value of the QMS Performance measuring instrument are:
Ø A cause and effect theming philosophy of audit findings providing an additional context to business improvement advice to management. Ø The provision of a QMS process deficiency locator / identifier which
targets management action areas for improvement.
Ø The provision of a quantitative measure of the management system performance, providing a reference from which to improve.
By providing a quantifiable measure of an organisations QMS performance, a reference point is provided to gauge QMS performance and also render a definitive measure to enable performance improvement of the business.
iv
ACKNOWLEDGEMENTS
I wish to thank:
§ My family, Cheryldene, Rae, Darren, Ayden and Zac for supporting me and encouraging me to completion.
§ The staff of the quality assurance department of Koeberg Nuclear Power Station for the opportunity to test and influence theories. § My Supervisors Mr Andre Bester and Professor Mellet Moll for
guiding and shaping this output. .
v
LIST OF ABREVIATIONS
QMS Quality Management System
NC Nonconfority
KNPS Koeberg Nuclear Power Station
KOU Koeberg Operating Unit
NEI Nuclear Energy Institute
SNPM Standard Nuclear Performance Model
NNR National Nuclear Regulator
ISO International Standards Organisation
BPIR Business Performance Improvement Resource IAEA International Atomic Energy Agency
ASME American Society of Mechanical Engineers
NQA Nuclear Quality Assurance
ANS American National Standard
KPI Key performance indicator
PI Performance indicator
SSG Specific severity grading
GSG Generic severity grading
NSG Nonconformity severity grading
PSG Process severity grading
vi
GLOSSARY
Assurance: Evidence (verbal or written) that gives confidence that something will or will not happen or has or has not happened (Hoyle, 2007:186).
Audit: An examination of results to verify their accuracy by someone other than the person responsible for producing them (Hoyle, 2007:187).
Business management system:
The set of interconnected and managed processes that function together to achieve the business objectives (Hoyle, 2007:187).
Key
performance indicators (KPI):
The quantifiable characteristics that indicate
the extent by which an objective is being achieved (Hoyle, 2007:193).
Measures: The characteristics by which performance is judged. They are the characteristics that need to be controlled in order that an objective will be achieved. They are the response to the question “What will we look for to reveal whether the objective has been achieved?” (Hoyle, 2007:194).
Measurement capability:
The ability of a measuring system (device, person and environment) to measure true values to the accuracy and precision required (Hoyle, 2007:194).
Quality management (QM):
The application of a quality management system in managing a process to achieve maximum customer satisfaction at the lowest overall cost to the organisation while continuing to improve the process (ASQ, 2012:Online).
vii Quality
management system (QMS):
A formalised system that documents the structure, responsibilities and procedures required to achieve effective quality management.quality control The process relating to gathering process data and analysing the data to determine whether the process exhibits nonrandom variation (ASQ, 2012:Online).
QMS
Performance Measurement
Audits, Reviews, Surveillances and Self Assessment monitoring activities that measure compliance to requirements of the QMS (Source: Adapted from Ramly, Ramly and Yusof, 2007:1).
QMS
Performance Measure
That measurement intent on providing a clear quantitative reference representative of the health or performance of the QMS (Source: Own).
QMS Health Measure
That measurement intent on providing a clear quantitative reference representative of the health or performance of the QMS (Source: Own).
viii
TABLE OF CONTENTS
DECLARATION ... i ABSTRACT ... ii ACKNOWLEDGEMENTS ... iv LIST OF ABREVIATIONS ... v GLOSSARY ... viTABLE OF CONTENTS ... viii
LIST OF TABLES ... xiii
LIST OF FIGURES ... xiv
CHAPTER 1: SCOPE OF RESEARCH ... 1
1.1 Introduction ... 1
1.2 Motivation ... 1
1.3 Background to the research problem ... 2
1.4 Statement of the research problem ... 3
1.5 The research question ... 3
1.6 Investigative questions ... 3
1.7 Primary research objectives... 4
1.8 The research process ... 4
1.9 Research design and methodology ... 6
1.10 Data collection design and methodology ... 6
1.11 Ethics ... 7
1.12 Research assumptions ... 8
1.13 Research constraints ... 8
1.14 Chapter and content analysis ... 9
1.15 Significance of the research ... 10
1.16 Conclusion ... 11
CHAPTER 2: BACKGROUND ON THE RESEARCH ENVIRONMENT ... 12
2.1 Introduction ... 12
2.2 Nuclear governance in South Africa ... 13
2.3 Eskom’s nuclear power program and requirements ... 14
2.4 Quality management in Eskom ... 14
2.5 Koebergs’s quality management Imperative ... 15
2.6 KOU quality management environment overview ... 15
ix
2.8 KOU graded approach to quality management ... 19
2.9 KNPS quality management and QMS measurement ... 20
2.10 Limitations of the KNPS QMS reporting environment ... 21
2.11 Conclusion ... 21
CHAPTER 3: MANAGEMENT SYSTEM PERFORMANCE MEASUREMENT - A LITERATURE REVIEW ... 22
3.1 Introduction ... 22
3.2 Quality management systems and their role ... 23
3.3 Business performance measurement ... 23
3.4 Quality management methods and philosophies ... 24
3.4.1 International business excellence models... 24
3.4.2 The balanced scorecard ... 27
3.4.3 The purpose of the balanced scorecard ... 27
3.4.4 The balanced scorecards need for cutomisation ... 28
3.4.5 Nuclear industry specific quality models and standards ... 28
3.4.6 Nuclear Energy Institute Standard Nuclear Performance Model (NEI SNPM) ... 29
3.4.7 International Atomic Energy Agency (IAEA), GS-R-3, The management System for Nuclear Facilities and Activities ... 29
3.4.8 American Society of Mechanical Engineers (ASME) NQA-1 ... 30
3.5 The relationship between quality management and business performance ... 30
3.6 Models vs. standards ... 31
3.7 QMS performance measurement by means of audit ... 32
3.7.1 QMS audits ... 32
3.7.2 The role of QMS audits ... 33
3.7.3 Quality data collection and analysis ... 33
3.7.4 Frameworks and structure for data collection and analysis ... 34
3.8 Quality management Instruments ... 34
3.8.1 SERVQUAL instrument ... 35
3.8.2 The “Critical factors of quality” Instrument... 36
3.9 Quality performance measurement inputs ... 36
3.9.1 Key Performance Indicators (KPIs) ... 37
3.9.2 Cause and effect relationaships ... 38
3.9.3 Cause and effect themes ... 38
3.9.4 Metrology considerations for measuring instruments ... 38
x
3.10.1 Functional decomposition ... 40
3.10.2 Thematic analysis ... 41
3.11 The Impact of good management systems on business performance ... 42
3.11.1 The importance of obtaining management commitment ... 42
3.11.2 The role of top management during the implementation of ISO 9001 or other management standard ... 43
3.11.3 Leadership competencies for implementing QM principles ... 43
3.11.4 Leaderships ability to influence followers ... 44
3.12 Conclusion ... 44
CHAPTER 4: RESEARCH DESIGN AND METHODOLOGY ... 46
4.1 Introduction ... 46
4.2 Inductive applied research ... 46
4.3 Archival research ... 47
4.4 The applicability of mixed methods research ... 48
4.5 The quantitative and qualitative comparison ... 48
4.6 The QMS audit methodolgy ... 49
4.7 The reliability of audit results ... 52
4.8 Data collection design and methodology ... 53
4.9 The use of secondary data analysis ... 53
4.10 Types of secondary data and uses in research ... 55
4.11 Data collection using forms ... 56
4.12 Data mining ... 56
4.13 Data sets and sources ... 57
4.14 Source data sensitivity ... 58
4.15 Mixed method analysis ... 58
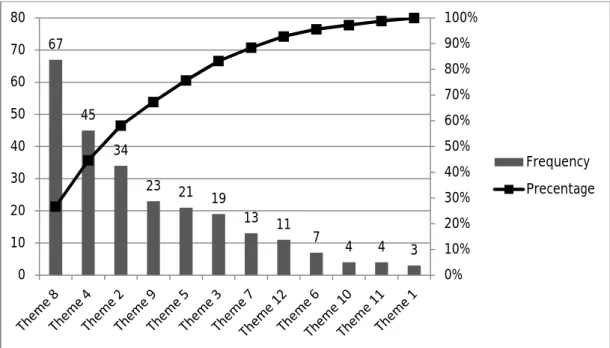
4.16 Pareto charts ... 58
4.17 Data analysis ... 60
4.18 Data formats and analysis path ... 60
4.19 The validation and reliability survey intent ... 61
4.20 QMS deficiency location ... 61
4.21 QMS theme coding notation ... 62
4.22 Data validity and reliability ... 62
4.23 Data analysis tools ... 64
xi
CHAPTER 5: MANAGEMENT SYSTEM THEME ANALYSIS: DATA
COLLECTION, ANALYSIS, AND INTERPRETATION OF RESULTS ... 66
5.1 Introduction ... 66
5.2 The QMS monitoringand reporting environment ... 67
5.3 QMS performance measuring instrument dimensions ... 68
5.3.1 QMS process deficiency locator ... 68
5.3.2 QMS "quantitative measure" tag ... 69
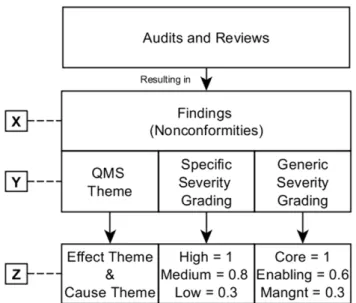
5.3.3 Resultant finding metadata ... 70
5.3.4 QMS process theme listing basis ... 70
5.3.5 Cause and effect chain phylosophy ... 72
5.3.6 Cause and effect theming phylosophy ... 73
5.3.7 QMS health measurement inputs relationships ... 75
5.3.8 QMS measuring instrument uncertainty in context ... 76
5.4 Improving the reporting environment ... 78
5.5 Data analysis ... 79
5.5.1 Data formats and analysis path ... 79
5.5.2 The validation and reliability survey intent ... 80
5.5.3 Validation and reliabilty survey results ... 80
5.6 QMS deficiency location ... 82
5.6.1 QMS theme coding notation ... 82
5.6.2 Pareto analysis of the effect and cause themes... 83
5.6.3 Pareto Analysis at QMS Process Level ... 85
5.7 QMS related perfomance measurement ... 87
5.7.1 NEI coding value ... 87
5.7.2 NEI coding assignment ... 89
5.8 QMS performance measure results ... 92
5.9 QMS performance measure vs. business performance ... 93
5.10 Conclusion ... 94
CHAPTER 6: CONCLUSION ... 95
6.1 Introduction ... 95
6.2 The research problem revisited ... 95
6.3 The research question revisited ... 96
6.4 The investigative questions revisited ... 96
6.5 Key research objectives revisited ... 97
6.6 Reliability and validity of the research ... 98
6.6.1. Significance of the research ... 98
xii
6.6.3. Reliability ... 99
6.6.4. Validity ... 99
6.7 Findings and conclusions ... 100
6.7.1. The cause and effect theming philosophy ... 100
6.7.2. QMS process deficiency locator / identifier. ... 101
6.7.3. Quantitative measure of the qms performance. ... 101
6.8 Recommendations ... 102
6.9 Final conclusion and “real world” value ... 103
BIBILIOGRAPHY ... 104
ANNEXURE A: Primary and secondary data ... 108
ANNEXURE B: QMS process themes listing ... 117
ANNEXURE C: Specific severity grading criteria ... 121
ANNEXURE D: KNPS events reported 2008 to 2011 ... 122
ANNEXURE E: Validity of measurements ... 124
ANNEXURE F: Nonconformities vs. plant events relationship ... 125
ANNEXURE G: QMS performance measure methodology ... 126
xiii
LIST OF TABLES
Table 4.1: Qualitative and quantitative research characteristics ... 48
Table 4.2: Example – Secondary and primary research data format ... 61
Table 4.3: Example - QMS theming notation ... 62
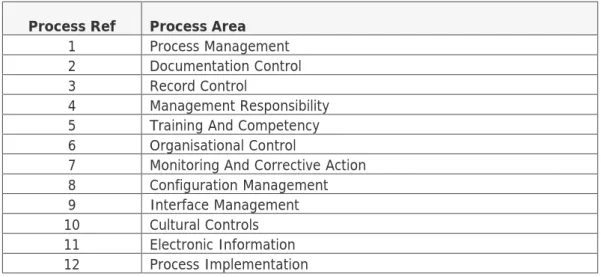
Table 5.1: QMS theme processes ... 71
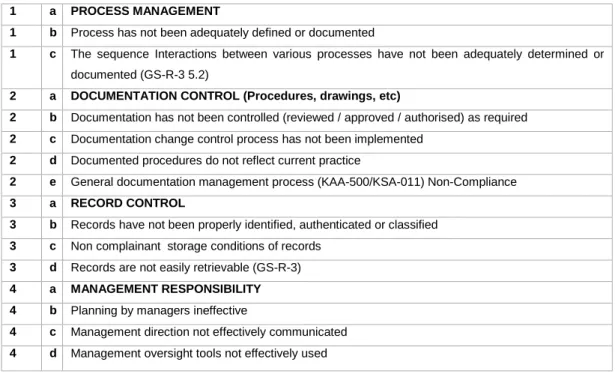
Table 5.2: QMS theme detail example ... 72
Table 5.3: Cause / effect QMS themes example ... 73
Table 5.4: Example - research data for analysis format ... 79
Table 5.5: Reliability survey results ... 81
Table 5.6: QMS theming notation example ... 82
Table 5.7: Pareto “effect” theme - top 10 frequency of occurrence ... 83
Table 5.8:Pareto “cause” theme - top 10 frequency of occurrence ... 84
Table 5.9: Average weighting assigned to EM / NQA's ... 88
Table 5.10: NEI coding and safety weighting ... 89
xiv
LIST OF FIGURES
Figure 2.1: Koeberg quality management process flow 16
Figure 2.2: NEI process SNPM 18
Figure 4.1: Research overview 46
Figure 4.2: Simplified audit process steps KNPS employs 50 Figure 4.3: Audit process / research methodology links 51
Figure 4.4: Pareto theme identification example 59
Figure 5.1: Audit and review distribution 66
Figure 5.2: KNPS quality monitoring process flow 67
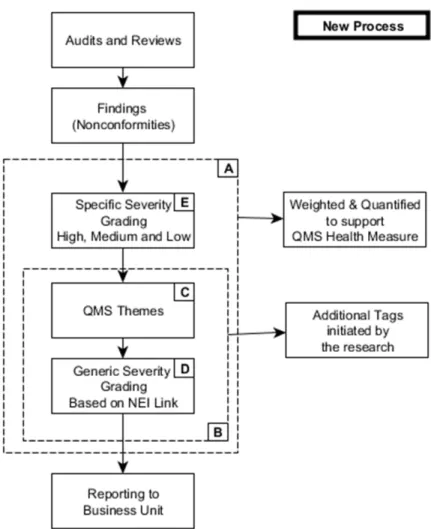
Figure 5.3: The modified monitoring process 69
Figure 5.4: Resultant finding metadata 70
Figure 5.5: Cause and effect chain 73
Figure 5.6: Nonconformity theme and severity selection options 74 Figure 5.7: QMS health measure component relationships 75
Figure 5.8: Measurement uncertainty inputs 76
Figure 5.9: Process modified to extract quantitative data 78
Figure 5.10: Sum of Nonconformities Effect Tags 84
Figure 5.11: Sum of NC cause tags 85
Figure 5.12: Pareto QMS “effect” themes at process level 86 Figure 5.13: Pareto QMS “cause” theme at process Level 87
Figure 5.14: NCs by NEI category 88
Figure 5.15: Process nonconformity distribution for 2008 91 Figure 5.16: Effect" QMS related process grading's 92
Figure 5.17: NC severity distribution by year 93
Figure 5.18: QMS performance measure vs. business performance 94 Figure 6.1 Nonconformity cause themes by process area 100 Figure 6.2: Nonconformity effect directive by process area 101 Figure 6.3: Collective QMS Performance Measure by Year 102
Figure 6.4: Cause Theme Validation Results 124
1
CHAPTER 1:SCOPE OF RESEARCH
1.1 Introduction
“When you can measure what you are speaking about, and express it in numbers, you know something about it, when you cannot express it in numbers, your knowledge is of a meager and unsatisfactory kind; it may be the beginning of knowledge, but you have scarcely, in your thoughts advanced to the stage of science.”
Baron William Thomson Kelvin (1824-1907)
This research aims to develop and establish a measurement methodology for Quality Management System (QMS) Performance in order to provide business managers with quantitative information to inform decisions and their associated actions, proactively.The scope of the research will expand on the following broad areas, which shows research framework:
Ø Background and statement of the research problem.
Ø The research question and investigative questions.
Ø Primary research objectives.
Ø The research process.
Ø Research design and methodology.
Ø Research data collection design and methodology.
Ø Ethics considerations.
Ø Research assumptions and constraints.
Ø Significance of the research.
1.2 Motivation
Many top performing businesses, which achieve superior levels of success and sustainability, have a sound, well maintained, implemented Quality Management System (QMS). Correlation between business benefits and an implemented management system have been shown in numerous papers and that the benefits accrued outweigh the costs (Fons, 2011:468). Current methods of accessing the success of the implementation of the
2
management system do not provide a quantitative measurement indicative of the management system health.
The benefit of a definitive measure of management system health lies in providing a point of reference, which can fuel the motivation to continuously improve compliance to the management system. This is the foundation for superior business performance. Quantifying the economic benefits also aids in informing management decisions (Fons, 2011:461). This research aims to develop a QMS health measure based on the coding and analysis of QMS audit findings data. This will provide management with information to inform decisions and their associated actions proactively. The informed decisions thus can be made prior to the business deficiencies manifesting themselves as a lagging indicators as used in some of the current business models and measurement systems.
1.3 Background to the research problem
The research problem relating to insufficient measurement capability of the quality management system performance was accentuated by customer feedback and a business process self-assessment. QMS trend reporting is presented to senior management periodically. The reporting includes minimal quantitative content, and does not show a clear reference point to implement continuous improvement from. ISO 9000 (2000:9) defines "effectiveness" as the "extent to which planned activities are realised and planned results achieved". The researcher proposes that the relationship between QMS ‘effectiveness’ and QMS "performance" is direct in that the "performance" is representative of the measure of "effectiveness". The researcher thus suggests that a "QMS performance measure" is defined as “that measurement intent on providing a clear quantitative reference representative of the health of the QMS”.
The QA business reporting process self-assessment showed deficiencies in the audit data analysis and traceability of insights to originating raw data. The amount of detail contained within overview reporting was also
3
perceived to be too shallow, in that management could not clearly establish the actual QMS risks that the business was exposed to. Chapter 2 expands of the pertinent areas which will provide context to the research problem. The expanded areas include content which shows the governance requirements of the quality management program and the quality management environment itself.
1.4 Statement of the research problem
The problem that is researched within the ambit of this study, reads as follows: The performance measurement capability of the quality management system at Eskom's Koeberg Power Station is insufficient. This diminishes management's ability to identify the business risk resulting from management system deficiencies, which impacts negatively on business performance.
1.5 The research question
The research question, forming the crux of this research study, reads as follows: How can the performance measurement capability of the quality management system of Eskom’s Koeberg power station be improved to assist management to identify business risk resulting from quality management system deficiencies, in order to improve business performance?
1.6 Investigative questions
The investigative questions, which will be researched in support of the research question, are listed below:
Ø What quality management methods are currently used to improve business performance?
Ø What performance measures are used for representing quality management system performance?
4
Ø What is the relationship between the quality management system performance measures and business performance?
Ø How can QMS performance measurement provide insight into
management decision making?
Ø How can the existing QMS performance measurements be used to
improve business performance?
1.7 Primary research objectives
The identified primary research objectives of this research study are listed below:
Ø Primary objective: The primary objective of this research study is to mitigate the research problem through the implementation of a feasible and viable problem solving mechanism.
Ø Secondary objectives: The secondary research objectives are: Ø To identify which quality management methods are currently used
to improve business performance.
Ø To determine which performance measures are used for
representing quality management system performance.
Ø To show the relationship between the quality management system performance measures and business performance.
Ø To show how QMS performance measurement can provide insight
into management decision making.
Ø To show how existing QMS performance measurement (audit) data can be used to improve business performance
1.8 The research process
Watkins (2012:36) adapts the six fundamental stages in the research process as noted by Collis and Hussey (2003), and proposes the following logical sequence to be followed to perform research. The author's research process will follow Watkins proposed method with minor adaptions:
5
Ø Identify a specific complex problem, which the researcher wishes to conduct the research on.
Ø Conduct an abbreviated literature review on the subject matter being investigated. The purpose being to not only provide insight into the complexity of the problem, but also to provide insight into the literature pertaining to the field of study of the proposed research.
Ø Formally describe, formulate and document the research problem. Ø Describe and formulate the research question, and associated
investigative questions.
Ø Select an appropriate research design and methodology, which includes the data collection design and methodology.
Ø Determine the key research objectives for the proposed research. Ø Document the research process, which will be followed for the
proposed research and formulate an associated work plan.
Ø Identify the limitations, which may impact on the proposed research. Ø Clearly identify, list and articulate the assumptions, which would
apply to the proposed research.
Ø Based on the above, formulate a formal research proposal and submit for approval.
Ø Establish a structured working relationship with the allocated supervisor or promoter.
Ø Conduct an in-depth literature review on the subject being researched.
Ø Collect, analyse and interpret the research data.
Ø Formulate a structured approach to mitigate the identified research problem. Furthermore, ensure that the identified research question and supporting investigative sub-questions have been answered as a result of the research. In addition, clearly indicate how the research objectives were met/not met, as a result of the research. Ø Write up the dissertation or thesis.
6 1.9 Research design and methodology
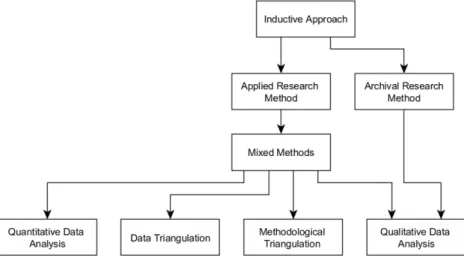
The research approach is considered to be inductive in that a theory is developed based on the collection and the analysis of that data. (Saunders, Lewis & Thornhill, 2009:125-126). Applied research, will serve as the basis of the research methodology as it is considered the most appropriate research approach. Thunhurst and Randall (2010:398) state that the defining feature of applied research is that it is driven by the need to answer practical questions surrounding the topic being studied.
The applied research approach makes use of mixed methods to optimally achieve the research objective. Creswell (2009:203) notes that with the development and perceived legitimacy of both qualitative and quantitative research in the social and human sciences, mixed methods research, employing the combination of quantitative and qualitative approaches provides an expanded understanding of research problems.
1.10 Data collection design and methodology
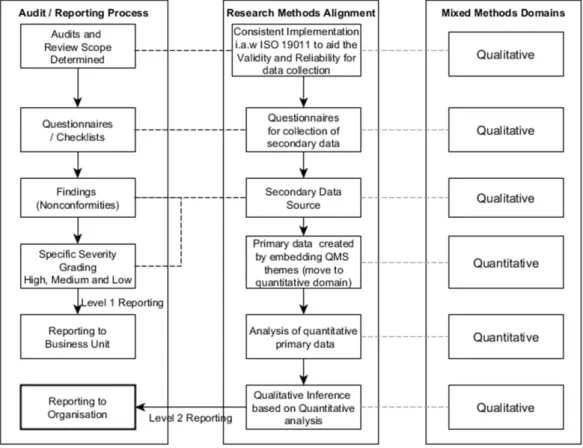
The objective of the research is to propose and develop a QMS performance measurement methodology and show the correlation between this measure and actual business performance. Existing data resulting from audit findings collected over a three year period (2008 to 2010) will be analysed and QMS “cause and effect” themes will be assigned to the individual findings. The themes embedded in the existing primary data i.e. the QMS audit findings will be extracted as a secondary data source, and further analysed in order to provide a measure of overall QMS health. The quantified QMS performance data will inform management decisions and guide management action with the aim of improving business performance. Data triangulation will support the data collection methodology and validity of the research.
Saunders, Lewis and Thornhill (2009:150), notes that archival research makes use of administrative records and documents as the principal source of data. Watkins (2012:75) notes that the concept of ‘triangulation’, applies to not only the collection of data from different sources (data
7
triangulation) as described in this paragraph, but also to using multiple research methods (methodological triangulation). The author shares the definition by Collis and Hussey (2009), and amends the definition for the purpose of clarity and, which reads as follows: "Triangulation is the use of multiple sources of data (data triangulation), and different research methods (methodological triangulation). In this research study, data mining will serve as the primary vehicle, while questionnaires serve as mechanisms of data collection to provide validity and reliability measures for this study.
1.11 Ethics
According to Watkins (2012:77) ". . . ethics refer to the appropriateness of your behaviour in relation to the rights of those who become the subject of your work, or are affected by it".
Watkins (2012:77) notes that Leedy and Ormrod (2010), state that most ethical issues in research fall into one of four categories namely:
Ø Protection from harm.
Ø Informed consent.
Ø The right to privacy.
Ø Honesty with professional colleagues.
Watkins notes that Collis and Hussey (2009) expand on the above and add the following to the list of ethics:
Ø Voluntary participation.
Ø Anonymity.
Ø Confidentiality.
The main ethics consideration for this study will thus include, "informed consent", "the right to privacy", "honesty with professional colleagues", "voluntary participation", anonymity and confidentiality.
8 1.12 Research assumptions
Leedy and Ormrod (2001:62-63), provide for the following explanation of assumptions, which cited verbatim: “Assumptions are what the researcher takes for granted. But taking things for granted may cause much misunderstanding. What we may tacitly assume, others may have never considered. If we act on our assumptions, and if in the final result such actions make a big difference in the outcome, we may face a situation we are totally unprepared to accept. In research we try to leave nothing to chance in the hope of preventing any misunderstanding. All assumptions that have a material bearing on the problem should be openly and unreservedly set forth. If others know the assumptions a researcher makes, they are better prepared to evaluate the conclusions that result from such assumptions. To discover your own assumptions, ask yourself, what am I taking for granted with respect to the problem? The answer will bring your assumptions into clear view”.
The following assumptions are upheld with respect to the research in this research study:
Ø An implemented, well maintained QMS is essential to drive and improve business performance.
Ø The coders or raters of the reliability test questionnaires are all registered, competent quality management system lead auditors and all possess three or more years of auditing experience.
Ø The “QMS themes” measuring Instrument table seen in Annexure B
is calibrated and the intrinsic uncertainty of the measure is negligible.
1.13 Research constraints
The following research constraints are noted.
9
Ø A level of subjectivity exists in rating of certain elements (such as nonconformities and process areas) within an audit activity leading up to, and over the duration of the research.
Ø The process outputs of QMS audits and reviews include non-conformities and observations. This research will only consider the nonconformities, taking cognisance that additional value may be obtained when analysing observation metadata.
Ø The competency of the auditors and accordingly the rating and theming process is of utmost importance as an influence to the accuracy of the QMS performance / health indicator.
Ø Staff movement i.e. arrival of new auditors and the loss of existing auditors, will influence the overall rating and measurement indirectly by their influence at audit conclusion stage.
Ø ‘De-limitations’ pertaining to the research include the following: Ø The research, even though biased toward nuclear power utilities
management systems, may be generalised for use in any management system.
1.14 Chapter and content analysis
The following chapter and content analysis is applicable to the research. Ø Chapter 1 – Scope of the research: In this chapter the scope of
the research is discussed, in particular as it pertains to a specific research environment. Furthermore, the research problem is elaborated upon, which will not only form the crux of the research study, but will set the scene for the research. In addition, aspects pertaining to the research process, investigative questions,
research objectives, research design and methodology,
assumptions and significance of the research, are elaborated upon. Ø Chapter 2 – Background to the research environment: A
holistic perspective: In this chapter, the reader is provided with a holistic perspective of the research environment. The research environment will not only provide context to the research problem, but would provide a comprehensive background to aid the
10
understanding of the reader of not only where the research will take place, but also why it is necessary to be conducted in this particular environment.
Ø Chapter 3 – Management System Performance Measurement - A Literature review: In this chapter a literature review will be conducted on the primary theme of the thesis, providing an empirical underpinning to the research problem. More specific, the literature review will provide academic context to the unique aspects that would mitigate the research problem.
Ø Chapter 4 – Research and Methodology: This chapter provides an overview of the research design and methods used to interrogate and expose the solutions to the research problem.
Ø Chapter 5 – Management system Theme Analysis - Data collection, analysis, and interpretation of results: From a quantitative and or qualitative perspective, this chapter reflects the approach to data collection. Furthermore, data gleaned from the data collection exercise, will be analysed and interpreted.
Ø Chapter 6 – Conclusion: In this concluding chapter, key aspects pertaining to the research will be revisited. Research findings will be brought into the context of the overall research, recommendations will be made, and final analogies will be drawn. More specific, in this chapter the research problem will be mitigated through the implementation of a problem solving mechanism to the benefit of the organisation and its people.
1.15 Significance of the research
This research, while taking the assumptions and constraints into consideration, will provide a quantitative measure of a QMS performance or health status. This will enable organisations to respond to the QMS health measurement from a leading ‘business performance impact’ indicator perspective. Acting on the leading indicator will deliver less lagging (reactive) effects, enabling management to focus proactively on the management system foundations of the business.
11
This will impact positively on the sustainability of the business and allow for continuous improvement of both process and profit. There were no instances noted in the literature review which explicitly explore or focus on quantification of management system performance or health at audit finding level. The scarcity of research in this area further highlights the significance of the research.
1.16 Conclusion
This chapter of the research provided an introduction and overview of the overview of the current state of measurement of the QMS health status of Koeberg Power Station. The chapter also elaborated upon the research problem, which forms the crux of the research study, and also set the scene for the research. Aspects pertaining to the research process, investigative questions, research objectives, research design and methodology, assumptions and significance of the research, were also elaborated upon. The following chapter will provide additional data and expand upon the appropriate areas to clearly state the context, environment and background to the research problem statement.
12
CHAPTER 2: BACKGROUND ON THE RESEARCH
ENVIRONMENT
2.1 Introduction
The research was conducted at Eskom’s Koeberg Nuclear Power Station (KNPS). The power station is the operating leg of the Koeberg Operating Unit (KOU) which has additional support divisions to support KNPS. The author of this document is a member of a team of QMS auditors in the KNPS Quality Assurance Department. This chapter will elaborate on the elements important to understanding the context of the research and will therefore expand on the following:
Ø Nuclear governance in South Africa: shows the nuclear related bodies that influence the operations of the KOU
Ø Eskom’s nuclear power program and requirements: The unique needs of nuclear power generation in South Africa
Ø Quality management in Eskom: The quality management standards basis that Eskom uses
Ø Generic nuclear power utility business process interface overview: An overview of the processes and their relationships with each other based on the Nuclear Energy Institute (NEI) performance model.
Ø Quality management at KNPS: The quality management standards basis that KNPS uses beyond ISO 9001, such as the applicable international standards and considerations.
Ø KOUs quality management environment overview: The environment in which quality management is practiced within KNPS.
Ø KNPS quality management and QMS measurement: The status quo of QMS measurement within KNPS.
13 2.2 Nuclear governance in South Africa
The National Nuclear Regulator (NNR) is responsible for exercising regulatory control over the safety of nuclear installations, certain types of radioactive waste, irradiated nuclear fuel, and the mining and processing of radioactive ores and minerals. The "National Nuclear Regulator" Act No 47 of 1999 established the National Nuclear Regulator (NNR). The objectives of the NNR are to provide for the protection of persons, property and the environment against nuclear damage through the establishment of safety standards and regulatory practices, and to exercise regulatory control related to the safety of nuclear installations through the granting of nuclear authorisations. The current revision of the Koeberg Nuclear Power Station: Koeberg Nuclear Installation Licence: NIL-01 (VARIATION 17)
The Institute for Nuclear Power Operations (INPO): INPO's mission is to promote the highest levels of safety and reliability, to promote excellence in the operation of nuclear electric generating plants.
The World Association of Nuclear Operators (WANO) is an organisation created to improve safety at every nuclear power plant in the world.
The South African Nuclear Energy Corporation (NECSA) is a state-owned company responsible for undertaking and promoting R&D in the field of nuclear energy and radiation sciences. It is also responsible for processing source material, including uranium enrichment, and co-operating with other institutions, locally and abroad, on nuclear and related matters.
The Department of Minerals and Energy ensures (DOE/ DME) the optimal utilisation and safe exploitation of mineral and energy resources.
The Nuclear Executive Committee (NEXCO) KOU's highest level at which key strategic decisions are taken. This committee is also responsible for the Division's overall business performance. NEXCO meetings are
14
scheduled on a monthly basis and are chaired by the division's senior general manager (Eskom, 2012:Online).
2.3 Eskom’s nuclear power program and requirements
Eskom’s nuclear power program is regulated by the National Nuclear Regulator (NNR) in terms of the National Nuclear Regulatory Act (47 of 1999). The NNR impose compliance to the Nuclear Installation License (NIL-1) and a number of Requirements Documents (RD’s) and Licensing Documents (LD’s). The nuclear installation license via “The Quality Management Requirements for Koeberg Nuclear Power Station” (LD1023), require that a comprehensive program of systematic audits be planned and carried out to verify compliance with all aspects of the quality management system and determine the effectiveness of the program.
A program of audits are planned, distributed and implemented over a three year period considering all the processes specified in LD1023, and also includes processes important for impact on business performance. Each major process (e.g. Design, Maintenance, etc.) within the power station adheres to all generic quality management system clauses and considerations (e.g. Documentation Management, Records Management, etc.). Each major process audit is thus effectively a QMS audit, and collectively over a three year program a detailed picture of the management system heath is visible based on the audit findings over the period.
2.4 Quality management in Eskom
Eskom has embarked on an ISO 9001 certification program for all its business units. Quality management within Eskom is seen as the overriding consideration that impact on plant safety and reliability. KNPS attained SABS ISO 9001 certification during August 2012.
A sound quality management system is essential to provide sustained customer focused process outputs which contribute to improved business
15
performance (Fons, 2011:468). The nuclear power generation industry has additional safety considerations and standards, which need to be considered in conjunction with ISO QMS standard to provide a more specific measure of QMS heath and performance.
2.5 Koebergs’s quality management Imperative
Koeberg employs approximately 1200 people. Indirectly, the station creates about another 600 local jobs off-site, and about 2000 jobs in the general South African nuclear industry. In the non-nuclear industry about 100 local firms supply equipment to Koeberg. KNPS performs the role of a “base load” generation utility in that it operates at 100% power output consistently. This is important in the context of South Africa’s power capability to supply the national electrical grid. Koeberg’s sustainability via high calibre quality management, is thus essential in order to support its economic and technical value to South Africa.
The benefits of an implemented quality management system based on ISO 9000 and derivatives of that standard has been practically questioned and tested for many years. The volumes of organisations that have adopted this philosophy provide evidence of its acceptance as an important component to achieving, sustaining and surpassing business goals. In each industry the high level criteria of the standard is adopted, but in many cases, expansion of the requirements at an operational level is needed to provide more detailed instruction appropriate to the product, service or industry constraints.
2.6 KOU quality management environment overview
The KOU QMS is based on the requirements of ISO 9001:2008 and is supplemented by those of the National Nuclear Regulator (NNR) document RD-0034 "Quality and Safety Management Requirements for Nuclear Installations", ASME NQA-1:2008 "Quality Assurance Requirements for Nuclear Facility Applications” Part 1 (as referenced in
16
RD-0034) and IAEA document GS-R-3, "The Management System for Facilities and Activities" (Eskom Internal manual 238-8, 2010:8).
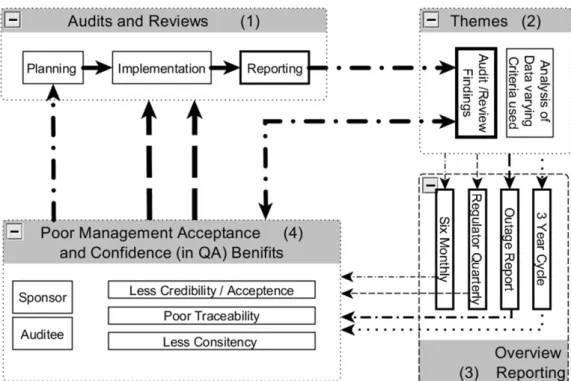
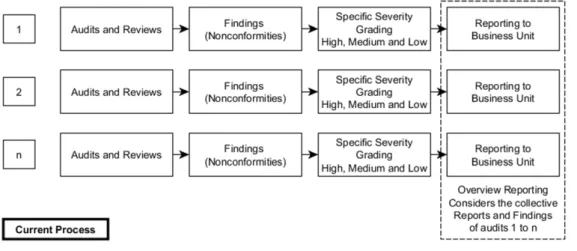
Figure 2.1: Koeberg quality management process flow shows the distinct phases from auditing to management overview reporting. The phases are described as follows:
Ø Audits and reviews (1): The audit and review monitoring activities are subdivided into planning, implementation and local process reporting to the process owner and others affected by findings raised.
Ø Theme assignment and analysis (2): During this phase, all audit reports and findings are collated and common themes are extracted from the data collectively in an attempt to highlight cross organisational issues.
Ø Management Overview Reporting (3) and (4):The result of the analysis forms the basis of both written and verbal reporting for management action.
.
17
2.7 Generic nuclear power utility business process interface overview
The nuclear power generation industry is a complex industry. A balance must be obtained between resources expended on processes, interfaces and how they are integrated, with additional business considerations such as plant and personnel safety, environment, etc. The Nuclear Energy Institute (NEI) Standard Nuclear Performance Model (SNPM) provides guidance on prioritisation of the more important processes from a safety perspective. This prioritisation guidance is considered in the audit program planning phase, in order that resources may be directed efficiently to obtain the most value to the organisation, while still adhering to regulatory requirements.
The NEI SNPM (2004:7) has been considered extensively within the management systems of the KOU, and is used as the basis in this dissertation for describing the process relationships and the method for importance grading of the various elements of the KOU management system processes. Further detail can be seen in Chapter 3.
The executive summary of the NEI SNPM (2004:i) reads: “To improve benchmarking effectiveness, the Nuclear Energy Institute (NEI), Electric Utility Cost Group (EUCG) and Institute of Nuclear Power Operations (INPO) worked to define a Standard Nuclear Performance Model (SNPM). They indicate that their three-year effort resulted in closer coordination of process descriptions, key business performance indicators (KPIs) and activity based costing (ABC) definitions.
18
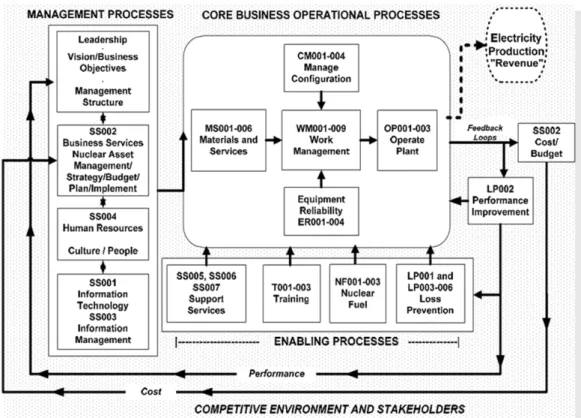
Figure 2.2: NEI process SNPM (Source:NEI SNPM:2004)
The NEI SNPM (2004:7) notes that the business outcome results of the combination of core and enabling processes. In nuclear generation, this result is the safe and reliable generation of electricity. Figure 2.2: NEI process SNPM (Source:NEI SNPM:2004) shows the process grouping and interfaces which makes up the NEI SNPM and is further described below:
Ø NEI Core process: The NEI SNPM (2004:7) identifies the core processes as those most directly related to nuclear safety and that accomplish a key business function. The core processes are Operate Plant, Work Management, Manage Configuration, Equipment Reliability and Materials and Services. The process scope is equivalent to the sum of scope definitions of the
associated sub-processes. The corresponding performance
indicators are known as level zero performance indicators within the NEI model.
Ø NEI Enabling process: An enabling process is a process that is applied in support of one or more core processes. The enabling processes are Management Processes and Support Services,
19
Training, Nuclear Fuel and Loss Prevention. The process scope is equivalent to the sum of the scope definitions of the associated sub-processes. The corresponding performance indicators are known as level zero performance indicators (NEI SNPM, 2004:7). Ø NEI Sub-process: A description for a subset of process steps
within the bounds of a single process. All 45 categories within the nine standard processes are referred to as sub-processes. Sub-processes may have a stand-alone process description. The corresponding performance indicators are known as level one performance indicators (NEI SNPM, 2004:7).
2.8 KOU graded approach to quality management
The applicability of the QM requirements on processes, activities and Structure, System and Component (SSCs) is determined by their importance to nuclear safety and availability of generation capability of that process or SSC function. This consideration is seen as a graded approach. Management will determine and classify the activities and processes of the KOU and its business areas in terms of their potential impact on quality and nuclear safety, and then subsequently manage these processes accordingly (Eskom Internal manual 238-8, 2010:8).
The Eskom Internal manual 238-8 (2010:8), requires that the degree to which the management system requirements are applied to an activity should reflect the importance of the activity to safety, health, environment, and the possible consequences if the activity is carried out incorrectly and results in equipment failure or failure to meet an objective. This can result in minimising the impact on valuable resources (and total costs) while improving overall safety. By using a graded approach it may be possible to identify activities of lesser significance within a process, and then define which controls and checks of the process are necessary (Eskom Internal manual 238-8, 2010:8).
20
The graded definitions noted in the NEI SNPM namely core and enabling will be used as a weighting criterion in Chapters 4 and 5 to provide a significance dimension to the QMS health indictor for a nuclear QMS. The enabling processes have been further subdivided into management and
support areas to further differentiate significance between
nonconformities.
2.9 KNPS quality management and QMS measurement
Providing a quantifiable measure of the Quality Management System (QMS) performance is important to the defining the status, and predicting capability of the resources and processes to achieve business goals. For business goals to succeed, the processes which lead to its success needs to be enabled by a structured, implemented quality management system. The nuclear power generation industry has additional safety considerations and standards which need to be considered in conjunction with ISO QMS standard to provide a more specific measure of the QMS heath and performance. The understanding by management of the relationship between a well maintained QMS and the related business performance is often variable and not adequate. The variation in the understanding of relationship impacts on the commitment by management to support QMS maintenance and improvement initiatives.
Data is gathered from audits and reviews and is assessed by KNPS QA personnel, and a QMS performance measurement reported to NEXCO biannually. The assessment takes place in the form of analysis of all data gathered from audits and reviews such in the form of reports, nonconformities and observations. The largely qualitative assessment includes numerous elements and biased perceptions, which reduces the reliability of feedback. Accurate, timeous quality data is important to inform strategic decisions taken by such forums such as NEXCO. Figure 2.1: Koeberg quality management process flow highlights the fact that improvement in the reliability of information and traceability of data is required to grow confidence in QA reporting.
21
2.10 Limitations of the KNPS QMS reporting environment
The limitations associated the current QMS reporting for overview or summary reporting environment include the following:
Ø Variation in identification of common themes due to the sequential nature of the analysis.
Ø Data is analysed long after the event leaving room for assumtion. Ø Data is not analysed by the auditor performing the monitoring
activity.
Ø Variation in assigned themes as themes are not consistant from one reporting period to another.
Ø It is difficult to assess improvement across reporting periods.
Ø Theming is time consuming due to the manual and inconsistent theming process.
Ø There is a low level of repeatability in the data analysis and theming process.
Ø Data traceability from insight to themes to findings is combersome.
The points above suggest that a process improvement is required to ensure that reliable timeous information may be produced to inform management decisions.
2.11 Conclusion
This research provides the methodology to quantify the QMS performance, and highlight its relationship to business performance, in order to direct management action to deficient areas of the management system. Improved data analysis will both support improving the QMS and positively impact on business performance. The research introduces significance tags to both process area level, and the audit finding level in order to reduce the level of collective uncertainty embedded in current periodic reporting of QMS performance.
22
CHAPTER 3: MANAGEMENT SYSTEM PERFORMANCE
MEASUREMENT - A LITERATURE REVIEW
3.1 Introduction
The literature review examines the elements and processes which support the research question, which states: "How can the performance measurement capability of the quality management system of Eskom’s Koeberg power station be improved to assist management to identify business risk resulting from quality management system deficiencies, to improve business performance?"
The review considered the broader elements of the research scope which highlights the following key considerations in support of the primary research question and the investigative sub questions.
Ø Quality management systems and their role.
Ø Quality management methodologies and philosophies.
Ø Business performance measurement and the relationship between quality management and business performance.
Ø Quality measurement instruments and their influences.
Ø Causal and effect relationship methodology in the QMS context.
Ø The development basis and use of QMS themes.
Ø The impact of good management system implementation on
business performance.
Ø The importance of obtaining management commitment.
The review also provides an overview of management system models and standards pertaining to the nuclear power quality industry, which is important to the detail of the research in further chapters.
23
3.2 Quality management systems and their role
The Quality Management systems (QMS) standard, ISO 9000 (2000:1), notes that the rationale for quality management systems as being able to assist organisations in enhancing customer satisfaction. It states that customers require products with characteristics that satisfy their needs and expectations. It goes on to highlight that needs and expectations are expressed in product specifications and collectively referred to as customer requirements.
The ISO 9000 (2000:1), standard notes that customer requirements may be specified contractually by the customer, or may be determined by the organisation itself. In either case, the customer ultimately determines the acceptability of the product. The standard notes that customer needs and expectations are changing, and because of competitive pressures and technical advances, organisations are driven to continually improve their products and processes.
The quality management system approach encourages organisations to analyse customer requirements, define the processes that contribute to the achievement of a product which is acceptable to the customer, and keep these processes under control. A quality management system can provide the framework for continual improvement to increase the probability of enhancing customer satisfaction and the satisfaction of other interested parties. It provides confidence to the organisation and its customers that it is able to provide products that consistently fulfill requirements (ISO 9000, 2000:1).
3.3 Business performance measurement
According to Kellen (2003:3), business performance measurement and control systems are the formal, information-based routines and procedures, managers use to maintain or alter patterns in organisational activities. Kellen (2003:3), notes that a typical performance measurement
24
helps businesses in periodically setting business goals and then providing feedback to managers on progress towards those goals.
The author notes that the time horizon for these goals can typically be about a year or less for short-term goals or span several years for long-term goals. Since a business performance measurement system measures performance, Kellen (2003:3), deems it of importance to define what performance is, and cites Lebas and Euske’s (2002) definition of performance as, “Doing today what will lead to measured value outcomes tomorrow.” Kellen (2003:3), concludes that business performance measurement then is concerned with measuring this performance relative to some benchmark, be it a competitor’s performance or a preset target. The overview of this domain distinguishes between Non-nuclear (International Business Excellence Models) and Nuclear Industry specific models and standards.
3.4 Quality management methods and philosophies
Ghalayini and Noble (1996:63) note that in order for companies to ensure achievement of their goals and objectives, performance measures are used to evaluate, control and improve production processes. A variety of quality management methods and philosophies such as Business Excellence Models, Balanced Scorecards and QMS Standards have been employed to aid measurement of performance. The quality method chosen would be unique depending on market situations, product strategies and competitive environments the business is exposed to. Paragraphs 3.4.1 to 3.4.8 provide an overview of some of these.
3.4.1 International business excellence models
Talwar (2011:24), notes that during the last two decades, business excellence models have been considered an effective way to pursue excellence in many industries worldwide. According to Talwar (2011:30) citing Lakhe and Mohanty (1994) and Hendricks and Singhal (1997),
25
several organisations have reported that with implementation of business excellence models, their process orientation, customer orientation and improvement orientation have improved. Winners of business excellence models have not only improved their product quality, but have also reported improvements in market share, sales, profits, employee morale and competitiveness as a result of implementing these models
The criteria below was extracted from the writings of Business Performance Improvement Resource (BPIR) (2012:Online), which provides overviews of the various models listed below, namely, the Australian Business Excellence Framework, the Canadian Framework for Business Excellence, the Singapore Quality Award Framework, the EFQM Excellence Model and the Baldrige Criteria for Performance Excellence. The first six elements are common to all the models, while the last two elements were noted in only two and three models respectively.
The elements of the models were drawn from the writings at BPIR (2012:Online), which are elaborated upon below:
Ø Leadership: How upper management leads the organisation, and how the organisation leads within the community.
Ø Strategic Planning: How the organisation establishes and plans to implement strategic directions.
Ø Customer and Market Focus: How the organisation builds and maintains strong, lasting relationships with customers.
Ø People / Workforce Focus: How the organisation empowers and involves its workforce.
Ø Process Management: How the organisation designs, manages and improves key processes.
Ø Business Results / Success: How the organisation performs in terms of customer satisfaction, finances, human resources, supplier and partner performance, operations, governance and social responsibility, and how the organisation compares to its competitors.
26
Ø Measurement, Analysis and & Knowledge / Information Management: How the organisation uses data to support key processes and manage performance.
Ø Partnerships and Suppliers: How the organisation manages and interacts with suppliers and partners in order to for the relationship to be mutually beneficial.
The models described below are considered to be more established and are widely used internationally:
Ø Baldrige Criteria for Performance Excellence: This is the model behind the US Malcolm Baldrige National Quality Award, an award process administered by the American Society for Quality (ASQ) and managed by the National Institute of Science and Technology (NIST), an agency of the US department of Commerce. This framework is used as the basis for over 70 other national Business Excellence/Quality awards around the world (BPIR, 2012:Online). Ø EFQM Excellence Model: This is the model behind the European
Business Excellence Award, an award process run by the European Foundation for Quality Management (EFQM). This framework is used as the basis for national business excellence and quality awards across Europe (BPIR, 2012:Online).
Ø Singapore Quality Award Framework: The Singapore Quality Award (SQA) framework is used as a basis for assessing Singapore’s organisations to the highest standards of quality and business excellence. The award aims to establish Singapore as a country committed to world-class business excellence. The framework and award is administered by SPRING Singapore (BPIR, 2012:Online).
Ø Canadian Framework for Business Excellence: The Canadian Framework for Business Excellence is used by Canadian organisations as a management model for organisational excellence and also as the basis for adjudication of the Canada
27
Awards for Excellence. The framework is administered by the National Quality Institute (BPIR, 2012:Online).
Ø Australian Business Excellence Framework: The Australian Business Excellence Framework is the premier framework for business excellence in Australia and provides the criteria for the Australian Business Excellence Awards. The framework is administered by SAI Global (BPIR, 2012:Online).
3.4.2 The balanced scorecard
Wongrassamee, Simmons and Gardiner (2003:18), note that in early 1990, the Nolan Norton Institute, the research arm of KPMG, sponsored a study in "Measuring performance in the organisation of the future". David Norton, CEO of Nolan Norton, served as the study leader and Robert Kaplan as an academic consultant. The authors state that after a yearlong research program with 12 companies, the study group produced a comprehensive framework, named the "Balanced Scorecard", in which an organisation's mission and strategic objectives can be translated into a set of performance measures.
3.4.3 The purpose of the balanced scorecard
Wongrassamee, Simmons and Gardiner (2003:18), continue and state that purpose of the Balanced Scorecard is to help communicate and implement an organisation's strategy. The authors note that the Balanced Scorecard is a framework containing a set of financial and non-financial measures chosen to aid a company in implementing its key success factors, which are defined in the company's strategic vision. Wongrassamee, Simmons and Gardiner (2003:18), note that to counter the traditional emphasis on the financial aspect of profit, Kaplan and Norton (1992) introduced three additional measurement categories that highlight non-financial aspects. The authors state that these are customer satisfaction, internal business process, and learning and growth and note that Kaplan and Norton consider these three additional categories as sets
28
of measures of the firm's drivers of future performance, whereas the financial perspective represents the past performance.
3.4.4 The balanced scorecards need for cutomisation
Wongrassamee, Simmons and Gardiner (2003:19), note that the Balanced Scorecard is not a template that can be applied to businesses in general or even industry-wide. The authors state that different market situations, product strategies and competitive environments require different scorecards. Business units the authors continue thus devise customised scorecards to fit their mission, strategy, technology and culture. In fact a critical test of a scorecard's success is its transparency: from 15 to 20 scorecard measures, an observer should be able to see through to the business unit's competitive strategy the authors note.
3.4.5 Nuclear industry specific quality models and standards
The considerations for management systems (MS) and models for the nuclear power industry, even though they contain the same MS components as conventional non-nuclear business, is heavily biased toward prioritisation of personal and public safety. IAEA GS-G-3.5 (2009: 4) states, “Safety shall be paramount within the management system, overriding all other demands."
Models and standards aim to enhance nuclear safety in compliance with nuclear quality requirements, nuclear community industrials must develop and continuously improve safe, reliable products that meet or exceed customer and applicable statutory and regulatory requirements. Nuclear utilities thus need to make business sense and question safety in all decisions (IAEA GS-G-3.5, 2009:4). The following paragraphs provide an overview of the more prominent nuclear specific models and standards.