The Relationship between
Data Centre
Strategy
and
Energy Efficiency
.
We’re addicted to data. As individuals, we’ve come to expect access to social networks and an array of communications tools from almost any location. Most organisations are unable to perform the basic functions of commerce without fast and reliable access to data. The organisational data centre – the locations that store, secure, and serve this data – has become the engines that power our economy and our society.
As our hunger for data grows, so do the requirements of the data centre. These demands have led to concerns about not only the high costs of building and operating data centres, but also their environmental impact. Data centres consume a tremendous amount of energy to both power and cool the equipment they contain. In fact, they’re now estimated to use 1-2% of all the world’s energy – a rising figure.
Contents
Trend 1: Executive summary
03
Trend 2: Introduction
03
2.1 Scope and audience
03
2.2 Background
03
Trend 3: Data centres and energy consumption
04
3.1 Energy stakeholders for data centres
04
3.2 How data centres use energy
05
3.3 Metrics for data centre energy efficiency
06
Trend 4: Common data centre strategies
06
Trend 5: Quantitative model
07
5.1 Methodology
07
5.2 Limitations
07
5.3 The effect of energy efficiency
08
5.4 Modelling energy consumption
08
5.5 Cost implications
10
5.6 Impact on carbon emissions
13
Trend 6: Conclusion
14
Figure 1: Decision-making variables for data centre builders and buyers
04
Figure 2: Typical data centre energy consumption breakdown
05
Figure 3: Data centre energy systems – factors that influence main load profiles
05
Figure 4: Main stages of computation used in the framework
07
Figure 5: Montly energy cost as % of total cost
08
Figure 6: Energy consumption and cost
08
Figure 7: Energy consumption
09
Figure 8: Monthly energy cost per user
09
Figure 9: In-house monthly cost comparison
10
Figure 10: Co-located monthly cost comparison
11
Figure 11: Public cloud monthly cost comparison
12
Figure 12: Monthly emissions data
13
consumption when compared to an in-house data centre. A co-located data centre also usually produces less carbon emissions, although reporting these emissions may prove a little more complex for the responsible organisation that chooses to do so.
Organisations that adopt a cloud computing strategy stand to save the most, as costs can be drastically reduced and primary energy consumption for data centre hardware is entirely eliminated. Cloud computing can also remove any associated carbon emissions, although this depends on how the business defines its reporting boundary.
The positive effect of both approaches is largely due to the outsourcing of numerous energy-related responsibilities to the data centre or cloud computing provider. It’s clear that energy is still being consumed and carbon is still being produced, however, as the providers are servicing multiple clients, they’re able to gain greater efficiencies than most individual clients due to greater economies of scale.
Our model highlights that the cost and energy benefits of adopting a co-located data centre or cloud computing strategy decline with scale. As an in-house data centre strategy gives organisations more control, organisations with extremely large data centre requirements or a significant dependence on their data centres to do business may decide to retain them in-house. With the right focus and investment, these extremely large in-house data centres could provide greater energy efficiency than co-located data centres. An in-house data centre strategy also allows organisations to choose where they source their energy from, enabling them to use renewable energy to drastically reduce carbon emissions.
To choose a data centre strategy that delivers a balance of low cost, energy consumption, and carbon emissions, we recommend that organisations use the cloud wherever they can, build only when they must, and co-locate everything else.
Trend 2: Introduction
2.1 Scope and audience
This document examines the relationship between different data centre
strategies and energy consumption, and aims to quantify the merits of each strategy, depending on scale and other considerations. The views of multiple organisational stakeholders are considered.
Trend 1: Executive summary
We’re addicted to data. As individuals, we’ve come to expect access to social networks and an array of communications tools from almost any location. Most organisations are unable to perform the basic functions of commerce without fast and reliable access to data. The organisational data centre – the locations that store, secure, and serve this data – has become the engines that power our economy and our society.
As our hunger for data grows, so do the requirements of the data centre. These demands have led to concerns about not only the high costs of building and operating data centres, but also their environmental impact. Data centres consume a tremendous amount of energy to both power and cool the equipment they contain. In fact, they’re now estimated to use 1-2% of all the world’s energy – a rising figure.
Many organisations have targets in place to reduce energy consumption. Responsible organisations may do this due to the well-documented links between the use of energy from non-renewable sources – coal or oil, for example – and climate change. They may simply wish to lower costs. Although the reasons for this may vary from organisation to organisation, and from stakeholder to stakeholder, most view reducing energy consumption as a positive goal.
As a result of the complexity, cost and environmental impact, many organisations are asking themselves whether or not they even need their own data centres and reviewing options like cloud, co-location, automation and managed services to reduce their data centre footprint. Each of the different location-based strategies – in-house, co-located, and cloud – has a distinctive effect on energy consumption. Dimension Data conducted research using a detailed model to quantify the impact on cost, energy consumption, and carbon emissions of all three strategies. Several factors were considered – most notably scale, but also the energy efficiency of the data centre, and the configuration and type of IT equipment it contains. These parameters were set based on a combination of industry best practice and first-hand experience gleaned from Dimension Data’s own data centre environments.
Our modelling showed that organisations using a co-located data centre can benefit from lower costs and reduced energy
This paper wishes to inform those with a professional interest in both data centres and energy consumption, with a particular focus on the following roles:
• Head of Sustainability • Chief Information Officer • Data Centre Manager • Data Centre Architect
2.2 Background
Modern organisations depend on reliable access to data. They increasingly expect this data to be available from any location across a wide range of devices. Access needs to be fast, reliable, and secure. Meeting these needs has led to tremendous growth in data centres. Managing a data centre can be a significant challenge, as it needs to be highly available, extremely secure, scalable, and connected to great communications infrastructure. Although many organisations build their own data centres, the associated challenges have led others to host their equipment in rented, state-of-the-art, and purpose-built facilities, a strategy known as co-location, or even to rent computing power-as-a-service from an external provider. These three strategies – in-house, co-located, and cloud – have both advantages and disadvantages. Data centres consume tremendous amounts of energy, yet the importance of energy is often overlooked when deciding on a data centre strategy. For example, the availability of energy has a critical impact on reliability and scalability, while its cost forms a key part of the overall operational expenditure. Organisations are also increasingly concerned with the strong evidence linking climate change with carbon emissions arising from energy consumption and, as a result, many have set targets to reduce their energy usage. Energy is a complex and rapidly evolving topic, as the associated cost, availability, and carbon emissions are intensely scrutinised around the world. It’s also increasingly the subject of legislation and political debate. As a consequence, organisations need to understand the energy implications of the data centre strategy they choose, to ensure that they’re able to meet their availability, cost, and environmental objectives.
3.1 Energy stakeholders
for data centres
Although IT equipment is often the largest consumer of energy in a data centre, many IT managers view energy as simply a commodity for ensuring reliable IT services, rather than as a factor that can and should be optimised. Conversely, although data centre facility managers are often responsible for energy costs, they may not have sufficient control over, or understanding of, the energy efficiency of the IT equipment to implement significant cost reduction measures. Therefore, there’s often some misalignment between stakeholders, which can result in missed opportunities to maximise the energy efficiency of the data centre.
In addition to rationalising data centre infrastructure, many organisations adopt emission reduction targets or environmental policy statements, which aim to reduce environmental impact, ensure efficient use of energy and, ultimately, reduce cost. Dimension Data, for example, has committed not to increase the average levels of carbon produced per person within its business between 2013 and 2018. Stakeholders within an organisation will have different priorities when determining the appropriate data centre strategy.
Trend 3: Data centres
and energy consumption
Given that data centres now account for between 1-2% of global energy consumption1, it’s perhaps not surprising
that the energy implications of various data centre strategies and technologies have become more relevant than ever. A recent study2 suggests that data centre energy
requirements grew by 63% in 2012, indicating that energy is an increasingly vital component in data centre strategy and management. With energy representing a considerable proportion of data centre costs, the key challenge remains to develop a data centre strategy that helps achieve competitive advantage by balancing net energy costs with business objectives, including environmental sustainability. Organisations are increasingly consolidating their data centre infrastructure into fewer facilities to achieve greater economies of scale and simplified management. Many argue that significant efficiency can be achieve by consolidating IT resources into shared infrastructure facilities using co-located or cloud services. This could include energy savings and lower operational costs. This paper evaluates the means and achievability of these reductions in subsequent sections.
At Dimension Data, the Chief Information Officer, Group Infrastructure and
Networking Manager, and Group Head of Sustainability weighted each decision factor according to their individual business objectives. Factors were classified as either: • critical
• important
• important but not relevant to their role Applying a quantitative metric allows comparison in a visual format. Some of these factors are listed in Figure 1. Operational cost is clearly a significant factor in strategic decision-making. Energy costs can account for up to 75%3 of data
centre operations and maintenance costs, but are rarely a critical factor. Accessibility (including bandwidth and network latency) is of greater importance to operational stakeholders, while the Group Head of Sustainability values risk management, mainly minimising threats to physical and energy supply security.
Quantifying factors including cost, accessibility, risk, and efficiency is complex. However, a methodology that involves key stakeholders and considers all the issues will ensure that key factors are addressed and will help effective decision-making.
Figure 1:
Decision-making variables for data centre builders and buyers
Cost (land and build)Capex Physical accessibility
Scalability Flexibility Environmental impact Energy supply security Bandwidth and network latency Remote accessibility and control Operations and
maintenance Energy cost
Physical security
(natural disaster) Virtual security (cyber threat) Accessibility
Risk
Efficiency
Decision factors
Environmental impact Virtual security (cyber threat) Physical accessibility
Scalability Bandwidth and network latency Operations and maintenance Flexibility Physical security (natural disasters) Energy cost
Energy supply security Remote accessibility and control Capex (land and build) Group head of sustainability Group infrastructure and network manager Chief information officer Factor importance 100% 90% 80% 70% 60% 50% 40% 30% 20% 10% 0%
Most data centres that serve a minimum of 1,000 business users with multiple applications, will have an energy system comprised of four main load structures: • the IT equipment (including servers,
storage and networking equipment) • an internal mechanical system
(primarily cooling)
• general facility electrical systems (lighting, backup power, security, and displays)
• external user devices like PCs, laptops, phones, and tablets that are in constant interaction with the data centre
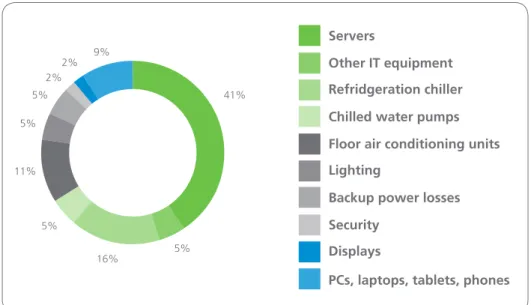
Figure 2 (adapted from IBM, 20104) shows
the approximate breakdown of these load structures and component parts, within a typical in-house data centre.
3.2 How data centres use energy
Energy is viewed as a resource that should never be compromised at the risk of disrupting the delivery of critical business services. The energy industry, however, is experiencing transformation of its own. New ways of achieving energy efficiency through hardware, software, and behavioural change are emerging. In addition, the introduction of renewable energy systems at the national and distributed on-site scale represent opportunities for data centre transformation. To understand the implications of these trends in the context of informing data centre strategies, organisations should first recognise how energy is used within data centres.
Combining these load structures indicates it’s feasible for an in-house data centre that serves 1,000 business users to consume more than 1GWh of electricity in a year. This equates to the annual electricity supply to more than 200 average UK households. It’s important to note, however, that the relative profile of these loads and overall energy requirements can vary significantly, based on many variables, some of which are illustrated below in Figure 3. There are numerous considerations for individual data centre design, including management, hardware, software, networking, mechanical, and electrical system composition. Therefore, a direct comparison of data centre infrastructure is challenging. Unsupported comparative generalisations can’t be made in relation to the merits of in-house, co-located, or cloud data centres from an energy implication perspective.
This paper doesn’t address the intricacies of these variables, or how they may be adjusted to improve energy performance. It aims to demonstrate that precise strategic coordination, combined with an informed choice of data centre strategy, can have a significant impact on data centre energy usage.
The choice of data centre strategy is also highly influenced by the efficiency of the chosen data centre, so it’s also important for decision-makers to understand the background and application of certain energy metrics.
Figure 2:
Typical data centre energy consumption breakdown
Figure 3:
Data centre energy systems – factors that influence main load profiles
5% 5% 41% 16% 11% 5% 5% Refridgeration chiller Other IT equipment Servers Lighting
Floor air conditioning units Chilled water pumps
Displays
PCs, laptops, tablets, phones Security
Backup power losses
2% 2% 9%
IT
equipment Mechnical system
Facility electrical systems Means of network data transmission (wired, wireless 3G or 4G) Temperature set points and means of control Monitoring system sophistication IT hardware numbers architecture and efficiency rating Aisle, server rack, and cable design/ configuration Backup power generator hardware and practices Server utilisation rate Insulation and building materials used Lighting hardware, usage and automation Virtualisation software existence Type of cooling system Access frequency and practices
In addition to these metrics, other common measurements used in data centre management are real energy consumption (in kWh), real energy cost (in monetary terms), or real carbon emissions (in tons of emission). Total cost of ownership is also used often to understand the full lifecycle cost of a data centre in monetary terms, comprising all components including design, build, operations, maintenance, energy supply, and disposal.
The range of metrics available highlights that no single metric has been proven entirely fit for purpose. Each may serve a purpose, but organisations have to decide which metrics are most appropriate and feasible to calculate with credibility, given the wider objectives of the business. It’s likely that while a particular metric is suitable for one organisation, it may not be for another. The key is to choose a metric that relates directly to the organisations overall business strategy, and to make sure that it can be used to clearly communicate progress. For example, within Dimension Data’s own operations, PUE is used to stimulate conversations about efficiency; however, energy use per USD million of revenue is viewed as the most appropriate metric and one that forms a key part of the organisation’s Environmental Policy Statement. This metric uses USD million of revenue as a proxy for the state of underlying data centre infrastructure, however, energy use could also have been normalised against area (square metres) or number of users, if these were deemed to be more appropriate.
Despite its shortcomings, PUE’s simplicity means that it’s still the most widely used metric and it’s therefore used in the quantitative section of this white paper.
4. Common data
centre strategies
The emergence of cloud computing, along with the advancement of technologies such as virtualisation and converged infrastructures, has led to a range of data centre optimisation and modernisation strategies. Organisations can choose between three main data centre strategies: in-house, co-location, or cloud. It’s not uncommon for organisations to adopt a combination of the three:
3.3 Metrics for data centre
energy efficiency
Some organisations lack any form of data centre strategy. Others have an evolving set of practices built on past experience. Few have a specifically designed strategy that aligns with wider organisational objectives, consisting of a vision, a set of objectives or targets to achieve that vision, and a clear methodology. It’s natural to expect a set of credible, quantitative metrics at the heart of data centre strategy management, yet this continues to be a contentious issue rather than being the backbone of sound strategy development – particularly in data centre energy efficiency.
The most frequently used energy metric in data centres is power usage effectiveness (PUE), which was derived by the Green Grid (www.thegreengrid.org). PUE is a simple ratio based on the energy usage of a data centre’s IT equipment divided by the total facility’s energy usage. A data centre with a high PUE is seen as inefficient, as a significant portion of energy usage goes into powering the facilities rather than the IT equipment. Conversely, a data centre with a low PUE uses most of its energy to power IT equipment. A perfectly efficient data centre would have a PUE of 1.0, although anything below 1.8 is seen as above average.
PUE is, however, somewhat crude and therefore not always well regarded by data centre architects. Arguments against PUE include that it’s only a snapshot in time, that it doesn’t take into account the utilisation of the data centre nor the efficiency of the IT equipment. As an example, using highly energy efficient IT equipment has the effect of increasing PUE, so simply attempting to optimise PUE could result in poor decision-making. The deficiencies of PUE have led to the creation of other metrics, such as carbon usage effectiveness (CUE) – another Green Grid metric to determine the relative carbon emissions of a data centre. JouleX, a data centre energy management provider that’s now part of Cisco, supports the use of a metric known as performance per Watt, which determines the energy performance of individual data centre devices and produces performance indicators.
• An in-house data centre is built, owned and operated by the end-user organisation, affording maximum infrastructure accessibility, control, and privacy. The high costs associated with the design, build, upgrade, temperature control, operator training, daily management, and skill retention, combined with the risk of aggregating all organisational information in a location(s), may detract from the business case for building an in-house data centre. • A co-located data centre refers to the
placement of privately owned servers in a third-party’s data centre facility. The third party is responsible for infrastructure systems provision, monitoring, power supply, and temperature control. The end-user organisation retains control of its own servers, their accessibility, and security, while typically saving costs by using mechanical and engineering systems that are shared between multiple tenants. • Cloud computing strategies involve
the purchase of computing resources as required from a third party, which owns and operates the IT infrastructure. Cloud computing services can be purchased on a public basis, where an organisation can access computing resources alongside other organisations, or on a private
basis, where organisations have exclusive access to specified computing resources. They can also be purchased in a hybrid
model – a combination of public and private cloud computing
Many organisations follow a range of data centre strategies. Dimension Data’s global expansion and acquisitions have resulted in numerous servers within its own global environment, which are distributed across multiple countries. Some of these reside within in-house data centres, while many are co-located. Increasingly, Dimension Data moves applications to computing resources hosted within its own Managed Cloud Platforms. Alfredo dos Santos is the Group Infrastructure and Network Manager responsible for the delivery of global applications and the day-to-day operational management of Dimension Data’s data centres. He comments that ‘regional differences in data centre strategy and lack of coordinated governance can increase management complexity.’ Dos Santos suggests that a single governance policy to guide data centre set-up, operation, and monitoring procedures can result in the more efficient management of IT resources.
(10,000 users). The model uses a range of average parameters, all of which are fully customisable.
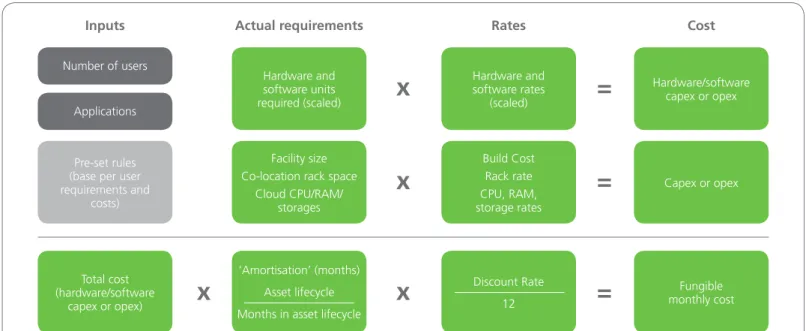
The financial cost to both set up and operate is calculated across all three data centre strategies. Generally accepted asset lifecycles with a consistent discount rate are used to evaluate monthly amortised capital costs, combined with monthly operational costs to sustain that strategy. Energy consumption is gauged by using the total load requirements of the IT equipment (servers and networking equipment), reduced by an appropriate factor to reflect the proportion of provisioned power that never gets used. Energy consumed by the power and cooling infrastructure is then incorporated using a PUE ratio which illustrates the relationship between IT equipment power consumption versus the rest of the facility. Emissions, being directly related to energy consumption (and power source) are calculated using a conversion factor – as tons of CO2 per kilowatt hour. Economies of scale have been built into the IT resource requirement (CPU, RAM, and storage). This accounts for the fact that, as an interconnected system in which resources can be shared, a data centre doesn’t demonstrate linear relationships between the number of users and the IT resources required. Similarly, the cost of those resources reduces per unit at scale, and this has been incorporated into the framework. Figure 4 below illustrates the main stages of computation used in the framework.
5. Quantitative model
This section of the paper aims to quantify the impact of different data centre strategies on energy consumption, emissions, and cost. This is calculated through a model developed to take a wide range of variables into account.
While every effort has been made to ensure the accuracy of the model’s data inputs, significant variability may exist, based on factors including location, hardware, and the choice of service provider. Readers should focus on the robustness of the methodology to be used as a replicable tool for strategy building, rather than relying on specific results.
5.1 Methodology
The model is designed to evaluate the energy and cost impact of providing data centre resources for common applications. In this case, we have considered core network services – email, file and print, and directory. A range of user inputs allow the selection of typical server parameters, such as number of CPUs, storage per user, level of backup and whether virtualisation is used. The impact of scale, alongside networking, storage, and facilities considerations, is then used to determine the cost, energy, and carbon impact of providing these services in in-house or co-located data centres, or via cloud computing. These are produced for different size requirements – small (100 users), medium (1,000 users) and large
5.2 Limitations
This model portrays relative costs, energy consumption, and emissions between data centre strategies over one month. This allows users to evaluate cost differences between strategies as a snapshot in time. It doesn’t take into consideration the impact of inflation, changes to input prices over time (including the cost of energy), and the inevitable need to install new hardware and software. The model is therefore not appropriate for investment analysis, which would seek to build dynamic cash flows specific to each data centre strategy over a longer time, which can be valued.
In addition, although the model is replicable, it requires a detailed
understanding of the many input variables. These will be unique in every circumstance, depending on application requirements, location, hardware and software vendors, risk appetite, law and regulation, and accounting policies, among other factors. Results could vary significantly between two seemingly similar assessments. A strong understanding of the forces behind input assumptions is critical to use the model constructively.
Figure 4:
Main stages of computation used in the framework
Number of users
Hardware and software units required (scaled)
Facility size Co-location rack space
Cloud CPU/RAM/ storages Pre-set rules
(base per user requirements and costs) Build Cost Rack rate CPU, RAM, storage rates ‘Amortisation’ (months) Asset lifecycle Months in asset lifecycle Total cost (hardware/software capex or opex) Hardware and software rates (scaled) Hardware/software capex or opex Capex or opex Fungible monthly cost Discount Rate 12 Applications Inputs Rates
=
x
=
x
=
x
x
5.3 The effect of energy efficiency
PUE is used within the model to illustrate the relationship between IT equipment and other forms of infrastructure energy consumption. This approach has many advantages, but also limitations. PUE can be a useful metric in many scenarios, however, as multiple variables affect it, it’s not easy to make assumptions regarding its potential values. For example, although larger data centres tend to be able to operate more efficiently, it’s not always the case in practice.
Additionally, PUE becomes less relevant in certain data centre strategies. Figure 5 shows a highly exaggerated model where the PUE of a hypothetical data centre decreases from 2.0 to 1.5 when more than 100 users are provisioned. For in-house data centres, this clearly has an immediate impact on cost. For co-located data centres, this benefit of energy efficiency is unlikely to be passed on to the data centre user and will therefore have no impact. This highlights that PUE is a far less relevant metric to users of co-located data centres.
5.4 Modelling energy consumption
At scale, in-house data centres can achieve significant efficiencies as shown in figures 5 and 6. It’s clear from this that a large facility supporting 10,000 users is three times more efficient than a small facility supporting 100 users, with monthly electricity consumption per user dropping from an average of 75 kWh to only 25kWh per month.
In-house
Co-located
Users
Energy cost (£/CPU)
Figure 5:
Monthly energy cost as % of total cost
Figure 6:
Energy consumption and cost
100 775 1,450 2,125 2,800 3,475 4,150 4,825 5,500 6,175 6,850 7,525 8,200 8,875 9,550 8.0% 7.0% 6.0% 5.0% 4.0% 3.0% 2.0% 1.0% 0.0%
Real energy consumption (kWh/month)
Size In-house Co-location Public cloud Small 7,512 3,756 N/A
Medium 39,650 26,433 N/A Large 251,332 167,555 N/A
Energy consumption (kWh/month/user)
Size In-house Co-location Public cloud Small 75 38 N/A
Medium 40 26 N/A Large 25 17 N/A
Energy consumption (£/month/user)
Size In-house Co-location Public cloud Small 7.11 3.55 N/A
Medium 3.75 2.50 N/A Large 2.38 1.59 N/A
Figures 7 and 8 also highlight that energy consumption in a co-located facility is between half and two-thirds that of an in-house data centre, although, economies of scale are more difficult to achieve. Renting rack space to support 100 users would theoretically consume approximately 38kWh per user, whereas providing a facility for 10,000 users would require approximately 17kWh per month per user. Energy costs for an in-house data centre range from over GBP 7 per user per month for a small facility to only GBP 2.38 for a large, purpose-built facility. Although energy isn’t often separately invoiced by co-location providers, it’s usually included in the rental and management fees. Given that these are designed to cover the energy consumption cost of the end user’s IT equipment, they may range from around GBP 3.50 per user per month for small-scale service requirements to around GBP 1.60 for large-scale service requirements. In practice, however, many co-location providers may not take scale into account when including the cost of energy in their rental fees.
For some stakeholders, such as Heads of Sustainability, monitoring energy consumption is also important to accurately track environmental performance. The control offered by an in-house data centre enables detailed monitoring of energy consumption. For example, separate metering can be used to monitor the load pulled by specific IT equipment and other non-IT infrastructure.
The energy consumption of co-located rack space is more difficult to monitor holistically, as facility management (in particular cooling) is controlled by the provider. However, the assumption is that only energy consumption arising from the operation of IT (including networking) equipment should be accounted for by the end user when evaluating a co-located environment.
The nature of a public cloud strategy doesn’t allow for energy consumption to be monitored, accounted for, or directly costed, as the provider is responsible for both the IT equipment being deployed as well as general facility management. This can provide significant benefits for organisations, as it makes the impact of energy the sole responsibility of the provider of the cloud service.
In-house
Co-location
In-house
Co-location
In-house
Co-location
Small
Small
Medium
Medium
Large
Large
Real energy consumption (kWH/user/month
kWH/month/user
User energy consumption (kWH/user/month
Figure 7:
Energy consumption
Figure 8:
Monthly energy cost per user 300,000 250,000 200,000 150,000 100,000 50,000 8.00 7.00 6.00 5.00 4.00 3.00 2.00 1.00 – 80 70 60 50 40 30 20 10 –
10
5.5 Cost implications
Energy consumption, cost, and associated emissions are clearly impacted by data centre strategy. This however should be brought into perspective by understanding the overall cost profile of each data centre strategy. Figures 9, 10, and 11 capture the overall cost composition of in-house, co-location, and public cloud data centre strategies providing access from 100 to 10,000 users.
Evidence suggests that the primary cost component of any data centre strategy is operations and maintenance, which includes software licences, support, communications, security, facilities
management, as well as hardware/software maintenance. This varies between 68% (in-house) and 89% (public cloud).
Building costs are only relevant in-house, although they represent minimal capital expense (up to 6%) in relation to the other major cost categories. IT equipment
and virtualisation software account for about 19-21% of costs for in-house and co-location set-ups, but obviously don’t feature in a public cloud strategy.
Energy costs only ever amount to between 4% and 7% of monthly amortised costs, being relevant mostly for small in-house strategies.
Public cloud demonstrates the lowest overall monthly cost to sustain a given IT resource requirement.
Figure 9:
In-house monthly cost comparison
72%
Building (inc power and cooling) Energy
Operations and maintenance
Servers, storage and networking
7% 7% 13% 1% 68% 7% 10% 11% 6% 70% 5% 11% 8% 6%
Small
Medium
Large
(£ ‘000)
Users (thousand)
500 450 350 300 250 200 150 100 50 100 550 1,000 1,450 1,900 2,350 2,800 3,250 3,700 4,150 4,600 5,050 6,400 6,850 7,300 7,750 8,200 8,650 9,100 10,000Operations and maintenance Building (inc power and cooling)
Energy Servers, storage and networking Third Party Management
73%
Third party management Energy
Operations and maintenance
Virtualisation software
Servers, storage and networking
4% 6% 13% 4% 69% 4% 10% 11% 6% 71% 4% 11% 8% 6%
Small
Medium
Large
(£ ‘000)
Users (thousand)
500 450 350 300 250 200 150 100 50 100 550 1,000 1,450 1,900 2,350 2,800 3,250 3,700 4,150 4,600 5,050 6,400 6,850 7,300 7,750 8,200 8,650 9,100 10,000Figure 10:
Co-located monthly cost comparison
Operations and maintenance Building (inc power and cooling)
Energy Servers, storage and networking Third Party Management
89% 11% 85% 15% 86% 14%
Small
Medium
Large
(£ ‘000)
Users (thousand)
400 350 300 250 200 150 100 50 100 550 1,000 1,450 1,900 2,350 2,800 3,250 3,700 4,150 4,600 5,050 6,400 6,850 7,300 7,750 8,200 8,650 9,100 10,000Figure 11:
Public cloud monthly cost composition
Operations and maintenance Building (inc power and cooling)
Energy Servers, storage and networking Third Party Management
5.6 Impact on carbon emissions
For organisations that report their carbon emissions, in-house, co-location, and public cloud data centre strategies have very different reporting implications. The Green House Gas (GHG) Protocol defines direct and indirect greenhouse gas emissions, and further categorises these as scopes 1, 2, and 3.
Scope 1 accounts for direct emissions generated from sources owned or under the control of the organisation. This would only apply to in-house data centres and would frequently include emissions from cooling systems or the burning of fuel for use in backup systems (for example, generators). Scope 1 emissions aren’t considered in the model.
Figure 12:
Monthly emissions data
Tons CO2e/month
Size In-house Co-location Public cloud Small 3.381 1.690 N/A
Medium 17.843 11.895 N/A Large 113.099 75.400 N/A
Tons CO2e/month/user
Size In-house Co-location Public cloud Small 0.034 0.017 N/A
Medium 0.018 0.012 N/A Large 0.011 0.008 N/A
Scope reporting (medium data centre)
Size In-house Co-location Public cloud
Scope 1 – – –
Scope 2 17.843 – – Scope 3 – 11.895 –
Scope 2 accounts for indirect emissions arising from electricity purchased by the organisation. This is the major emission category for in-house data centres, but it doesn’t apply to co-located data centres or cloud computing services.
Scope 3 is an optional reporting category that accounts for indirect emissions resulting from a range of other activities. Emissions arising from energy consumption in co-located data centres and cloud computing could be included in scope 3 emissions, although, some organisations don’t include these within their reporting boundary. Although many companies may see the use of third-party data centres as a means to eliminate emissions altogether, they should more appropriately be reported in some proportion as scope 3 emissions.
Figure 12 illustrates actual emissions associated with the three strategies – from small to large deployments – and how such emissions could be reported according to the GHG Protocol. It’s clear from this that in-house data centres are typically responsible for higher emissions than co-located data centres. Emissions associated with cloud computing aren’t included in this model, however, many studies have shown these to be significantly less than those associated with traditional data centre environments.
6. Conclusion
This model clearly shows that organisations adopting a co-located data centre strategy can benefit from lower costs, reduced energy consumption and less carbon emissions when compared to an in-house data centre strategy. This is primarily due to removing the need to invest in power and cooling infrastructure, relying instead on this being delivered as part of the service by the data centre provider. Although the data centre provider may pass some of these costs back as part of the management charge, organisations benefit from the economy of scale afforded by the infrastructure being shared among multiple tenants.
For the same reasons, adopting a co-located data centre strategy will usually result in a reduction in the carbon emissions associated with energy usage. These would fall into the GHG protocol’s scope 3 for indirect emissions, as opposed to scope 2 for purchased electricity. Reporting on scope 3 is optional, although responsible organisations will often include this within their reporting boundary. Organisations adopting this approach wouldn’t need to report any direct emissions associated with the data
1 Eric Masanet, Arman Shehabi, Lavanya Ramakrishnan, Jiaqi Liang, Xiaohui Ma, Benjamin Walker, Valerie Hendrix, Pradeep Mantha. ‘The Energy Efficiency Potential of Cloud Based Software: A U.S. Case Study’, Lawrence Berkeley National Laboratory (2013), Berkeley, California.
2 Datacentre Dynamics, British Computer Society, Siemens and Cummins, ‘Global census shows datacentre power demand grew 63% in 2012’, ComputerWeekly.com (2012). 3 IBM Global Site and Facilities Services presentation, ‘Data Centre Efficiency Best Practices’, (2012); and Whitestone Research Corporation ‘Operating Cost Benchmarks for Data
Centres’, (2011).
4 IBM, ‘Energy Consumption of Information Technology Data Centers’, (2010).
centre – known as scope 1 emissions – such as those from backup generators or refrigerants within cooling systems. The model also shows that the difference in cost, energy, and carbon between co-located and in-house data centre strategies decline with scale. Organisations that require larger data centres may therefore decide to build an in-house data centre, as the greater control that this affords may outweigh any benefit in cost, energy, or carbon. Indeed, there are numerous organisations who have built highly efficient data centres with a PUE of less than 1.2, and in these cases it’s very possible that this has brought them greater energy efficiency than with a co-located data centre. These examples tend to be extremely large, however, significant cost and effort has usually been invested to create such efficiencies.
The use of cloud computing provides even greater efficiencies. Using this strategy, organisations eliminate any direct energy costs and carbon emissions by removing the need to purchase equipment. Although some of these energy costs may be passed back to the client in management fees, cloud computing providers are able to command significant economies of scale
and keep these costs to a minimum. Carbon emissions associated with cloud computing are difficult to calculate and likely to fall outside of the reporting boundary for many organisations. However, evidence shows that these are significantly reduced by the efficiency of this model.
For these and many other reasons, cloud computing is an ideal strategy for most organisations. Many recognise that there are still challenges to be overcome before they can move to the cloud completely, and therefore choose instead to migrate individual applications that are well suited to this model, while investing in newer, more efficient and supportive technologies within their existing data centres. For environments where cloud is unsuitable, organisations can gain many benefits from the use of co-located data centres – particularly for smaller environments. Organisations requiring larger data centres with a high degree of control may wish to build their own, but need to understand that significant investments may be required to ensure that these are both economically and environmentally sustainable.
Gabon · Ghana · Kenya Malawi · Mauritius · Morocco Mozambique · Namibia · Nigeria
Oman · Rwanda · Saudi Arabia South Africa Tanzania · Uganda United Arab Emirates · Zambia
New Zealand · Philippines Singapore · Taiwan Thailand · Vietnam
Western Australia Ireland·Italy
· Luxembourg Netherlands Poland·Portugal Slovakia·Spain· United Kingdom Switzerland