“The Great Recession and Material Hardship” Natasha V. Pilkauskas Columbia University Janet Currie Columbia University Irwin Garfinkel Columbia University May 2011 _________________
Natasha V. Pilkauskas (np2247@columbia.edu) is a doctoral student in the School of Social Work at Columbia University. Janet Currie (jc2663@columbia.edu) is the Sami Mnaymneh Professor of Economics at Columbia University. Irwin Garfinkel (ig3@columbia.edu) is the Mitchell I. Ginsberg Professor of Contemporary Urban Problems and co-director of the Columbia Population Research Center, in the School of Social Work at Columbia University. The authors thank the Eunice Kennedy Shriver National Institute of Child Health and Human Development (NICHD) for supporting this research through the grant R01HD36916-09. We would also like to thank Melanie Wright for her research assistance and James Ziliak and Christine Percheski for their thoughtful comments on earlier drafts.
Abstract
Little research looks at the relationship between macroeconomic indicators and material hardship. High unemployment rates as a result of economic downturns are likely to lead to lost income, increased poverty, and material hardship. We examine the effect of the unemployment rate on hardship – food insecurity, difficulty paying bills, housing insecurity, unmet medical needs, and having utilities cut off – and investigate the role that government safety nets play in mitigating the effects of unemployment on the experience of material hardship. We use data from the Fragile Families and Child Well-being Study. The latest wave of data was collected during the Great Recession, the worst recession since the Great Depression, providing a unique opportunity to look at how high unemployment rates affect the well-being of low income families.
Introduction
The Great Recession that began in December, 2007 and officially ended in June, 2009 was one of the worst recessions in the US since the Great Depression. Among families in the lowest 10 percent of the income distribution, estimates from the Current Population Survey show that unemployment rates were still as high as 31 percent in October to December 2009. In the second lowest income decile unemployment was almost 20 percent (Sum and Khatiwada, 2010). High unemployment rates are likely to influence the health and well-being of low income
families. In addition to lost income and increased poverty due to unemployment, low-income families are likely to experience other material hardships as a result of the economic downturn. Research that has focused on material hardships has generally looked at the relationship between poverty or income and the occurrence of hardship. Little research has looked at the relationship between macroeconomic indicators, like the unemployment rate, and material hardship.
This paper focuses on the relationship between material hardship and the unemployment rate using data from the first five waves of the Fragile Families and Child Wellbeing Study (Fragile Families). These data are uniquely suited to looking at the effects of unemployment as the most recent data collection (May 2007 to February 2010) coincided with the Great
Recession. To our knowledge, it is the first paper to examine the effect of the unemployment rate on material hardship, and it is one of the few studies to be able to exploit longitudinal data in order to control for many potential confounders. We examine the effect of the unemployment rate on individual hardships including: food insecurity, inability to pay bills, housing insecurity, unmet medical needs and having utilities cut off. We also investigate the effect of the
unemployment rate on the usage of government assistance programs and the role that these government programs play in mitigating the effects of unemployment on the experience of material hardship.
Our study finds that the unemployment rate is related to the summary measure of material hardship, inability to pay bills and having your utilities cut off. We also find that the
unemployment rate is related to the receipt of two government assistance programs: the
Supplemental Nutrition Assistance Program (SNAP) and unemployment insurance (UI). Lastly we find that cash assistance programs – in particular, TANF, UI and SNAP – appear to be helping families avoid food, bill, housing, medical and utility hardships.
Literature on Economic Wellbeing and Material Hardship
A large literature relates the business cycle to measures of economic wellbeing. Many studies focus specifically on the unemployment rate and poverty, income inequality, and family income (Blank and Blinder, 1986; Blank 1989, 1993; Cutler and Katz, 1991; Blank and Card, 1993; Tobin, 1994; Haveman and Schwabish 2000; Freeman, 2001; Hoynes, 2002; Gunderson and Ziliak, 2004). These studies generally find that increased unemployment rates are associated with poorer economic outcomes. For example, Blank and Card (1993) find that a rise in the unemployment rate is associated with an increase in the numbers of weeks unemployed, a decrease in the number of weeks employed, real average weekly earnings and mean earnings. Despite the large literature that looks at poverty and income measures, no studies look at the effect of changes in the business cycle on material hardship. This study is the first to look at the association between the unemployment rate and hardships.
Many economists believe that consumption based indicators of economic well-being are superior to income based measures (Citro and Michael, 1995). Measures of income do not always fully capture all the resources that families have to make ends meet. In addition, other sources of income such as government transfers, wealth, and the ability to draw on credit or free services may also aid families in avoiding hardships. Measures of consumption are likely to better capture other sources of income. Material hardship measures are designed to capture forms of foregone consumption that threaten health and well being—such as going without food, housing, or needed medical care. Besides capturing the effects of economic resources that income measures may miss, hardship measures are also heuristically attractive because they measure concrete adversities. Measures of material hardship can provide some perspective on what it means to be poor by measuring families’ living conditions (Federman et al, 1996). Some researchers have suggested that the general American public is more interested in understanding whether families can obtain basic necessities rather than whether they have a certain level of income (Mayer and Jencks, 1998; Rector, Johnson and Youssef, 1999; Heflin, Sandberg and Rafail, 2009). Meyer and Sullivan (2003) find that those who are income poor are not necessarily the same as those who are consumption poor and that the experience of material hardship is more closely related to consumption poverty than income poverty. Moreover, short-term fluctuations in income have relatively little impact on material hardship once average
income is controlled (Short, 2005; Mayer and Jencks, 1989; Iceland and Baumann, 2007). Finally, high unemployment rates may affect not only individual and family members’ probability of employment, but also whole neighborhoods and family support systems. Few researchers advocate for the replacement of income or poverty measures in favor of a material hardship measure, but many argue that material hardship measures are a useful complement to other economic well-being measures.
Measures of material hardship were first used in the United States by Mayer and Jencks (1989) in a study of Chicago residents. Since then a number of surveys have included similar measures of material hardship, most notably the Survey of Income and Program Participation (SIPP) conducted by the U.S. Census Bureau. The Fragile Families study includes measures of hardship that are very similar to those collected by Mayer and Jencks and SIPP. In spite of 20 years of use of material hardship measures, there is little agreement on how to operationalize the measure (Beverly, 2001; Ouellette, Burstein, Long and Beecroft, 2004; Carle, Bauman and Short, 2009: Heflin et al. 2009). Some researchers use an index of all material hardships, others look just at a specific hardship (i.e. phone disconnected) and some look at hardship domains such as housing or food hardships. In addition, the number of measures included in studies of
hardships varies greatly (Rose, Parish and Yoo, 2009). Despite these discrepancies, most studies of material hardship cover the domains of health, food insecurity, ability to pay bills and housing hardships. Heflin et al (2009) find that models that separate the domains of hardship are superior to fully aggregated or disaggregated measures of material hardship. Other studies of material hardship that use the Fragile Families data use both individual and aggregate measures (Teitler et al. 2002; Reichman et al, 2005; Schwartz-Soicher, Geller and Garfinkel, 2009; Nepomnyaschy and Garfinkel, 2008; Osborne, Berger and Magnuson, 2010). Heflin and Iceland (2009) create five hardship domains in their analyses using the Fragile Families data. We construct our domain measures to closely match theirs and also include a summary measure of hardship in our
analyses.
No previous study has examined the effect of the unemployment rates experience in the Great Recession on measures of material hardship. The most recent wave of the Fragile Families data are ideally suited to examining the effects of the Great Recession. The 9-year follow up survey (5th wave) was collected from May 2007 through February 2010. Therefore we have data
from just before the large crash in December 2007 through the end of the Great Recession. Studies of changes in poverty and the income distribution during recessionary periods find that the bottom of the income distribution and lower educated workers are most affected by
recessions (Blank and Blinder, 1986; Blank and Shierholz, 2006; Blank, 2010). The Fragile Families study follows an economically disadvantaged population providing us with information on families who are most likely to be hit the hardest by an economic crisis. The panel data and timing of the most recent survey provide us with a great deal of variation in the unemployment rate over time making it ideal for our study.
We expect that as the unemployment rate increases the incidence of material hardships will increase but that some hardships may be more responsive to the unemployment rate than others. Hardships that reflect the individual’s inability to purchase or pay for something on a regular basis, such as food or paying bills, may be more affected by a change in the
unemployment rate. The consumption of these goods may be more easily affected by fluctuations in income. Or it may be the case that these hardships are not greatly influenced by the
unemployment rate as inability to make a bill payment or buy food may be the type of hardship that occurs commonly for low income families even in the best of times. For this reason we may see that it is the more extreme hardships, such as experiencing housing insecurity or having your utilities cut off, that are more closely linked with the unemployment rate. These hardships are likely to occur after extended periods of economic hardship, many months of inability to pay rent or bills.
Previous research provides little guidance on which hardships may be more affected by the unemployment rate. Sullivan et al (2008) and Iceland and Bauman (2004) find that food insecurity was more highly affected by recent fluctuations in income or poverty; Lovell and Oh (2006) find that utilities and phone disconnection are most affected by bouts of unemployment; and Beverly (2001) and Danziger et al. (2000) find that employed respondents are more likely to experience unmet medical needs. Given these mixed findings, we investigate the relationship between individual dimensions of material hardship and the unemployment rate to better understand the processes underlying different dimensions of hardship. Understanding if a particular type of hardship is more closely linked with changes in the unemployment rate may aid policy makers in targeting specific programming during recessionary periods.
The experience of material hardship may be mediated by public safety nets. The ability to access government aid from programs such as Temporary Aid to Needy Families (TANF) or the Supplemental Nutrition Assistance Program (SNAP) might help families avoid hardships. For hardship domains such as food insecurity where government assistance is regularly available the effect of the unemployment rate on hardship may be less pronounced. However in domains such as utility payments, or housing insecurity, where government programs are less available, we might see more hardship. We investigate several sources of government support; TANF, SNAP, Medicaid, unemployment insurance (UI), supplemental security insurance (SSI), the earned income tax credit (EITC) and public housing vouchers/section 8 housing to see whether they help mitigate material hardship.
Several studies have examined the relationship between individual employment or individual unemployment and material hardship (Elder, 1999; Conger and Elder, 1994; Lovell and Oh, 2006; Moffit and Cherlin, 2002; Danziger, Corcoran, Danziger and Heflin, 2000; Edin and Lien, 1997; Teitler, Reichman and Nepomnyaschy, 2004; Bauman, 2002). However, there are many reasons to expect such an association even in good economic times, as those who are unemployed may have other problems that cause both unemployment and material hardship. We focus instead on the unemployment rate, a measure that is not affected by the choices of the individuals in our sample. In addition, the unemployment rate allows us to get at shocks that affect the whole household, not just the employment of one particular member.1 Households (and in particular low income households) often have multiple earners and a wide network of people who may help out in the event of an individual shock to employment or income. However, the whole network is likely to be affected by a shock as large as the Great Recession. Our data allow us to look at the effect of the unemployment rate on material hardships over a long time span (9 years) and during both good economic times and a time of economic crisis – the Great
Recession.
1 We do find the expected relationship between individual employment and the unemployment rate in our sample.
In a model in which an indicator for whether the mother was employed last week is regressed on the log of the current unemployment rate in the baseline city and an individual fixed effect, the estimates indicate that a doubling of the unemployment rate would decrease the probability that she was employed by 0.058. We could not investigate the association between the unemployment rate and employment of all the individuals in the family household as only some of this information was collected in the survey.
Data and Methods Data
We use data from the Fragile Families and Child Wellbeing Study, a sample of
approximately 5,000 births in 20 large U.S. cities (in 15 states). Births were randomly sampled between 1998 and 2000 with an oversample of non-marital births. The study is designed to be representative of births in large cities (populations over 200,000). Mothers and fathers were interviewed at the time of the birth of the child and follow-up interviews were conducted when the child was one, three, five and nine years old. The survey is designed to cover questions of parental relationships, economic wellbeing, parenting and child wellbeing. Ninety percent of the mothers who completed baseline interviews were re-interviewed when their children were approximately one year old. Eighty-eight percent of mothers who completed baseline interviews were re-interviewed when their children were about 3-years old, 87 percent were interviewed when their children was about 5-years old and 76 percent were interviewed when their child was about 9-years old. The 9-year follow-up started in May 2007 and continued through February 2010, throughout the Great Recession.
In this study we focus on the mothers’ reports as they are both more complete than the fathers’ reports and they are more likely to be residing with children, a population who may be more vulnerable to the effects of hardship. We used multiple imputation to impute values for missing data on our covariates (we estimated all our analyses on the non-imputed data and the results were nearly identical). Multiple imputation utilizes the observed data to impute values for individuals who are missing data (Allison, 2002; Rubin, 1976). We imputed 5 data sets and the estimates are averaged over these data sets. The pooled data has a sample of 19,592 (person-year observations). Three thousand forty seven person-year cases are missing from a survey wave. Our final sample is 16,245 person-year observations and 4327 respondents contribute to the estimates. Analyses of the respondents who attrite from the sample show that they are more disadvantaged than the sample. Those who attrite are more likely to have less than a high school degree and lower income to needs ratios than those who do not attrite. Attriters are also more likely to be Hispanic and be immigrants than those who do not attrite.
Unemployment
We construct an average unemployment rate over the last year since the date of the mother’s interview in order to match our key dependent variable which is a measure of hardship over the previous year2. We use the log of the unemployment rate as it was the functional form that best fit our data. Information about the monthly unemployment rate was appended to the data set using data from the Bureau of Labor Statistics’ Local Area Unemployment Statistics (LAUS). We append two different unemployment rates. First, using the mothers’ current Metropolitan Statistical Area (MSA) and based on the date of the interview (for each interview wave), we attach the unemployment rate for the MSA in which she lives at the time of the interview. Second, we append the unemployment rate from the mother’s original MSA
(regardless of whether the mother moved) to the data for each wave of data based on the date of the interview. For example, if a mother was sampled in Boston, MA and she moves to
Indianapolis, IN, in the first version of the unemployment rate (current city) the analyses are done using the unemployment rate faced in Indianapolis. In the second unemployment rate (original/baseline city) the analyses are conducted using the Boston unemployment rates. We discuss reasons for doing both of these analyses in the methods section.
Our study focuses on the unemployment rate; however, as the latest recession illustrated, unemployment and employment do not always move together since people can also drop out of the labor force. Hence, we also looked at employment rates using data from two different sources: the LAUS and the Current Employment Survey (CES). LAUS data primarily comes from the Current Population Survey and CES data comes from Employment Statistics. For both data sets, rates were calculated using the number employed divided by population data that was appended from Census data and then averaged over the last year. Using the employment rate (instead of the unemployment rate) did not substantively change our results. In addition, the results of the analyses conducted with the LAUS and the CES were very similar. Results from these analyses are not reported here but are available from the corresponding author upon request.
2
We investigated the relationship between the outcome variables and different lags in the unemployment rate but it did not substantively change our results.
Material Hardship
We create measures of five hardships and a summary variable that includes 10 hardships. A dichotomous measure is created for each of the five domains representing whether or not an individual had experienced the hardship. All hardship questions refer to the past 12 months. The food insecurity measure includes two questions: ―In the past twelve months, did you receive free food or meals‖ and ―Were you ever hungry, but didn’t eat because you couldn’t afford enough food?3‖ Inability to pay bills is measured using two questions: ―Did you not pay the full amount of rent or mortgage payments‖ and ―you did not pay the full amount of a gas, oil or electricity bill?‖ Housing insecurity is measured by three questions: ―Did you move in with other people even for a little while because of financial problems?‖, ―Did you stay in a shelter, in an abandoned building, an automobile or any other place not meant for regular housing, even for one night?‖ and ―Were you evicted from your home or apartment for not paying the rent or mortgage?‖ The measure of medical hardship is based on the question ―Was there anyone in your household who needed to see a doctor or go to the hospital but couldn’t because of the cost?‖ The utilities cut off variable includes two questions: Whether or not ―your gas or electric service was ever turned off, or the heating oil company did not deliver oil because there wasn’t enough money to pay the bills‖, and ―was your telephone service ever disconnected by the telephone company because there wasn’t enough money to pay the bill?‖ Lastly, the summary measure is constructed by summing all of the hardship questions included in the individual dimensions4.
Government assistance variables
We investigate the relationship between the unemployment rate and a number of
government safety net programs. Respondents are asked if they received TANF, SNAP, UI, and SSI in the last year. For the EITC, respondents were asked if they filled out a form to receive the
3 In Year 3 the food hardship variable is based on just one question: “Did you receive free food or meals” as the
second question was not asked.
4
The Year 3 survey has two exceptions. The question about whether the respondent was ever hungry was not asked in Year 3. In order to retain sample we carried forward the value from the previous year’s survey for the respondent. Fewer respondents replied yes to this question in year 1 than in year 5 so we felt it was a more conservative approach. We conducted analyses restricting the hardship measure to the questions that were asked in all waves of the survey and the results did not change. In addition, in year 3 the question about whether the gas or electric service was ever turned off was asked in two questions rather than one. We have combined those questions into a single question to be comparable with the other survey waves.
credit with their last Federal income tax return. Respondents were also asked if they were currently covered by Medicaid. In the year 9 survey mothers were not asked if they received Medicaid. We assumed mothers received Medicaid in year 9 if they reported that their child received Medicaid. This measure may overestimate the use of Medicaid so these estimates should be interpreted with caution. Lastly, respondents were asked if they were currently living in public housing project or receiving government aid to pay for housing. These questions are all coded as yes/no responses.
Other variables
The main focus of our analyses are the individual fixed effects models. However, the pooled OLS models include a number of basic demographic controls found to be important in other studies of material hardship. Previous research on material hardship finds that marital status is significantly related to the experience of material hardship (Lerman, 2002). Other important predictors of hardship include race/ethnicity, education levels and age (Mayer and Jenks, 1989; Ouellette et al, 2004; Mirowksy and Ross, 1999). We include a measure of mental health using the conservative threshold of the Composite International Diagnostic Interview-Short Form as it has been found to explain a lot of the variation in hardship (Sullivan et al, 2008; Heflin and Iceland, 2009) We also include a control for immigrant status, income-to-needs ratio, city of residence, an indicator of whether the mother was in the last quartile of interviews within her city (harder to find) and year of interview. All of our control variables are measured at the baseline survey except mental health which was collected at the 2nd wave of the survey (when the child was one) but asks about depression in the last year.
Methods
First we examine the relationship between material hardship and the unemployment rate using an Ordinary Least Squares (OLS) model where we have pooled all of the waves of data. We estimate the following equation:
MHi = β0 + β1UR + β2Xi +εi (1)
where MHi denotes the i'th respondent’s material hardship score, UR denotes the log
characteristics of the individual, and i is the disturbance term. The1 is the main parameter of interest. In addition to the control variables discussed above, model (1) includes a measure of whether the respondent was in the last quartile of interviews within their interview city, as a measure of being difficult to find, city fixed effects and year of interview.
Our second model includes person specific fixed effects using the following equation: MHi = βi + β1UR + β2Xi + εi (2)
Individual fixed effects models exploit the longitudinal nature of our data and allow us to control for personal characteristics that might be correlated both with residing in an area with higher unemployment rates and with suffering from material hardship. For example, if a person is constrained to stay in a high unemployment area (perhaps because they lack the assets necessary to move) then their lack of assets may also increase the probability that they suffer from material hardship. In model (2), the only covariates are an indicator of whether the mother was harder to find (last quartile of interviews within her city) and interview year.
Each analysis is conducted using the original/baseline city unemployment rate as well as the current city unemployment rate. In preliminary analyses we found (not surprisingly) that those who lived in a city with a higher baseline unemployment rate at the time of the survey were more likely to have moved to a new city when they were followed up. Hence, the unemployment rate experienced by an individual in their current city is to some extent the result of an individual choice. Using the (current) unemployment rate in the baseline city solves this problem in models that also control for individual fixed effects. The fixed effect controls for the baseline city (a characteristic of the person that is fixed over the analysis). Analyses using the original/baseline city unemployment rate allow us to assess the association between the unemployment rate that individuals would have faced in the baseline city, and material hardship. However, we find very similar results whether we use the unemployment rate in the baseline city or the current city, and whether or not we drop movers entirely.
For both models (1) and (2) we tested several functional forms (entering unemployment as a set of dummies, linear, and quadratic) and found that the substantive results were very similar between the different models. The log unemployment rate fit the data best and we report
those results. We estimate models (1) and (2) for each of the material hardship domains, the summary hardship measure as well as the government assistance measures.
Results
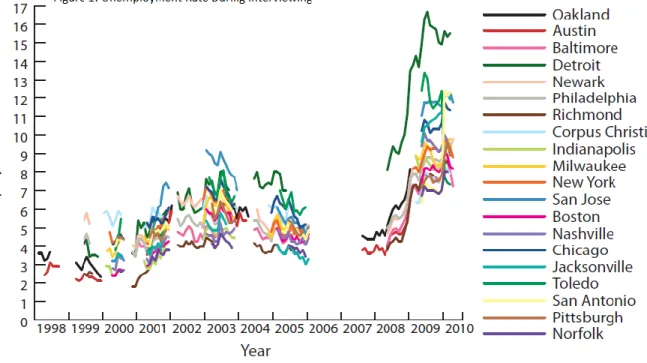
Figure 1 shows the unemployment rate over the years in which the survey data was collected in each of the 20 cities in our sample. The gaps in the graph represent the periods when no interviewing took place. Figure 1 shows a general upward trend in the unemployment rate in all cities in the early 2000’s that appears to remain relatively flat through the mid 2000’s with a decreasing trend in 2004 to 2006. In the latest data collection (2007 to 2010) there is a dramatic upward trend in the unemployment rate over time in all cities, corresponding to the Great
Recession. This graph demonstrates the large variation in the unemployment rate during data collection which makes these data particularly suitable to investigating the effects of the unemployment rate on the well-being of families.
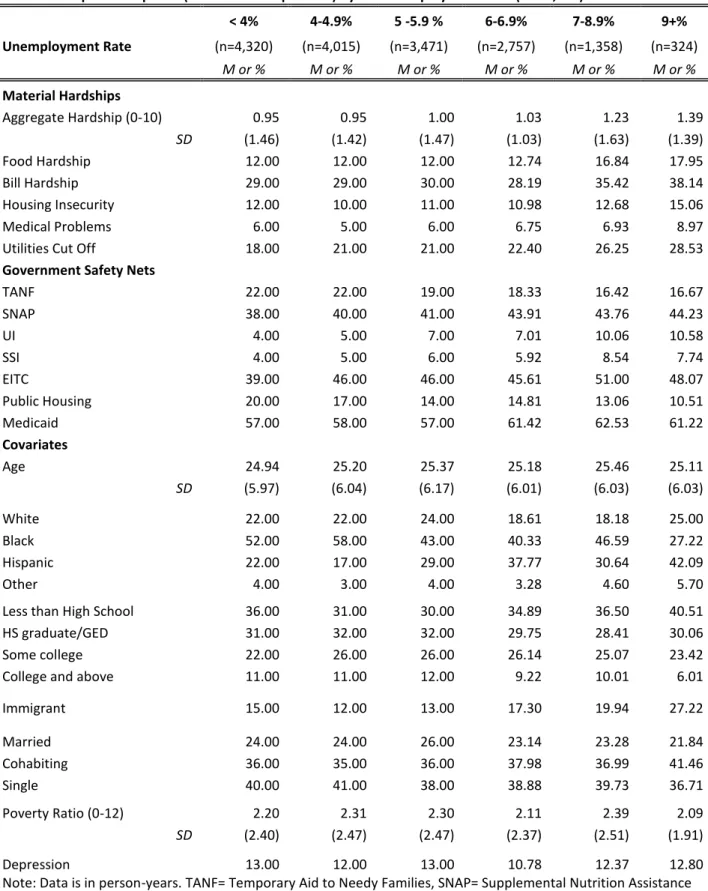
Table 1 provides descriptive information on material hardship, government safety net programs, and the demographic characteristics of our sample by different rates of the
unemployment rate. Because the Fragile Families study focuses on unwed parents, by design three quarters of the sample are unwed parents and consequently the population is highly disadvantaged with the overall average income-to-needs ratio just over 200 percent of poverty.
About one third of respondents have less than a high school degree and another third have a high school degree or equivalent. Blacks and Hispanics comprise ½ and 1/4 respectively of the sample.
[Table 1 about here]
Mean levels of material hardship increase with the unemployment rate. The summary hardship measure in areas with less than 4 percent unemployment is 0.95 whereas in areas with more than 9 percent unemployment it increases to 1.39. Frequency of experiencing food
hardship, bill hardship and having your utilities cut off steadily increase with the unemployment rate (differences between individuals who live in areas of less than 4 percent unemployment and those who live in areas of more than 6 percent unemployment are statistically significant). Medical problems and housing hardships are relatively stable as the unemployment rate
increases, but when the unemployment rate is above 9 percent more respondents experience both types of hardship.
We might expect that government assistance programs would increase in usage as the unemployment rate increases and for SNAP, UI, SSI and Medicaid this is the case. TANF receipt appears to be decreasing in receipt as the unemployment rate increases. This decrease could be because in later waves of the survey (when the unemployment rates were higher and in particular during the Great Recession) individuals may have reached the time limit of their TANF
eligibility rather than TANF being less available. Respondents in areas with higher
unemployment rates also appear to be significantly less likely to receive public housing. EITC receipt increases from areas with less than 4 percent unemployment to areas with higher
unemployment. This may reflect that in earlier waves of the survey, when the unemployment rate was lower, mothers were less likely to be employed (and hence receive the EITC) because they had newly born children. We might also see more EITC receipt at higher rates of unemployment because mothers who would normally be ineligible for the EITC are experiencing more spells of unemployment that lower their incomes and make them eligible for participation.
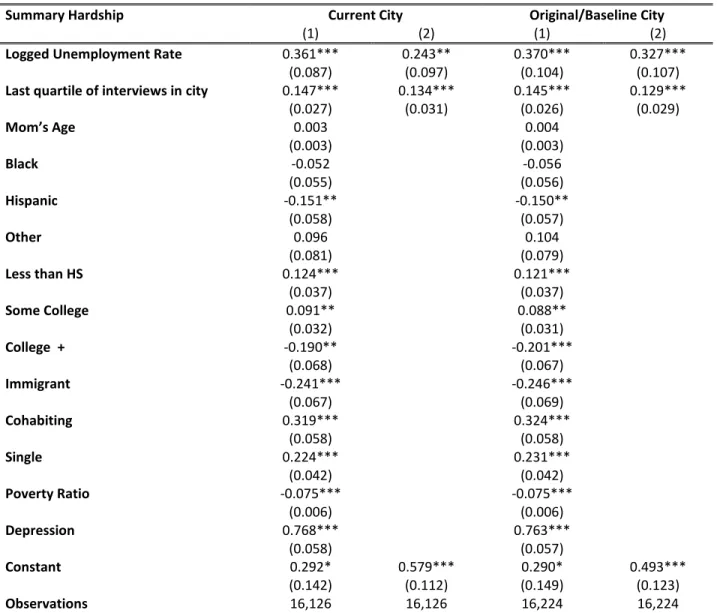
Results from pooled OLS models (1) and individual fixed effects models (2) of the effect of current city the unemployment rate and original/baseline city the unemployment rate on the summary material hardship measure are reported in Table 2. Turning to the current city results
(columns 1 and 2) a 100 percent increase in the unemployment rate (akin to moving from 5 to 10 percent unemployment) is associated with a .36 increase in the summary hardship measure in the pooled OLS or a .24 increase in the summary measure in the individual fixed effects model. The results for the original/baseline models (columns 3 and 4) are similar. We find a change from 5 to 10 percent unemployment is associated with a .37 increase in hardship in the OLS and a .33 increase in hardship in the fixed effects model.
A few covariates are significantly associated with material hardships in the OLS models. Hispanics have significantly lower levels of material hardship. Education is associated with material hardship, those with lower levels of education are more likely to experience hardship whereas those with a college degree or higher are less likely. Being an immigrant is associated with a lower likelihood of experiencing hardship. Respondents who are single or cohabiting are significantly more likely to report experiencing material hardships than those who are married. An increase in the income to needs ratio measured at baseline is significantly associated with a decrease in the summary hardship measure. Depression is also significantly associated with higher levels of hardship.
[Table 2 about here]
The individual fixed effects model is a more conservative test of the association between the unemployment rate and hardship because it controls for all fixed characteristics of the respondent, measured and unmeasured. In general, we find that the size of the coefficient on logged the unemployment rate is somewhat attenuated in the fixed effects models. We focus our discussion on the individual fixed effects results moving forward. We also concentrate on the analyses using the original/baseline city unemployment rate for the remaining analyses as we feel it is a better test of the relationship between the unemployment rate and material hardship.
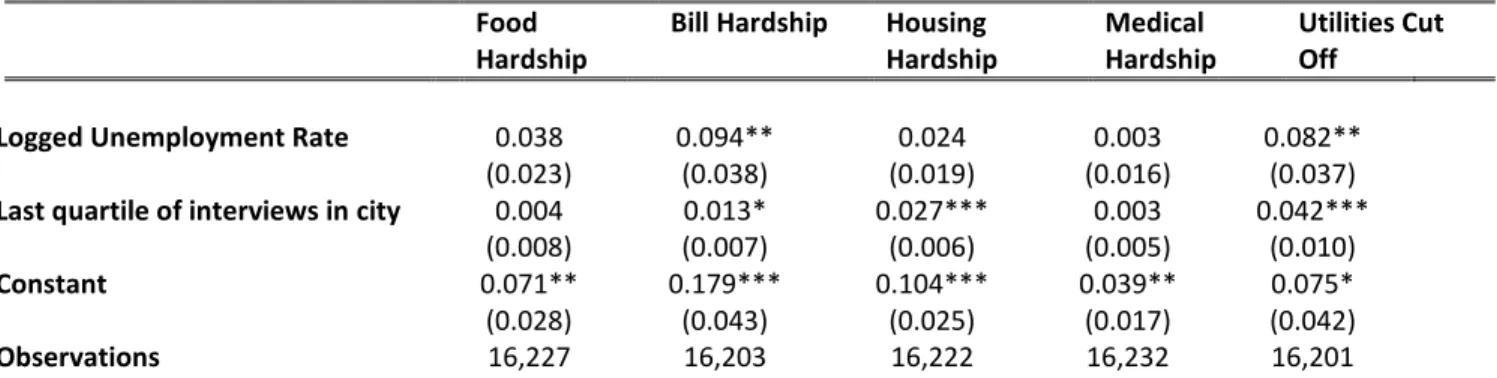
Table 3 reports the results of the individual fixed effects regression of the log
unemployment rate in the original/baseline city on individual hardships. As predicted, some hardships are more strongly associated with the unemployment rate than others. Inability to pay bills and having utilities cut off are the only two individual hardships that are significantly related to the unemployment rate. A doubling of the unemployment rate is associated with a 9.4 percent increase in the probability of experiencing a bill hardship and a 8.2 percent increase in
the probability of having your utilities cut off. Food insecurity, housing hardship and medical hardships are not significantly associated with the unemployment rate. It may be that safety net programs such as SNAP and Medicaid are doing a good job of preventing hardship, a hypothesis that is investigated further below.
[Table 3 about here]
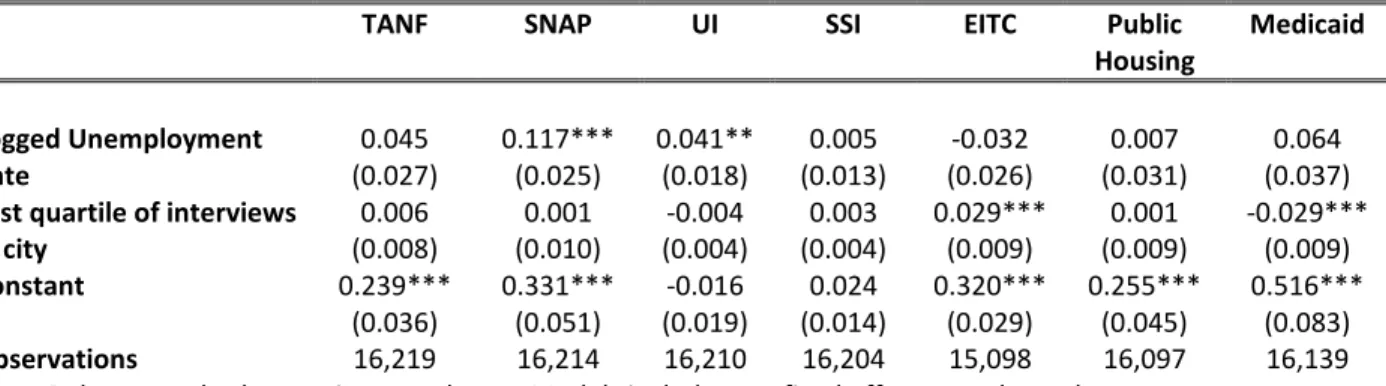
Table 4 shows the results of the individual fixed effects regressions on sources of government support programs. SNAP and UI receipt are significantly associated with the unemployment rate. A move from 5 to 10 percent unemployment would be associated with a 12 percent increase in the probability of receiving SNAP and a 4.1 percent increase in the
probability of receiving UI. The receipt of TANF, SSI, EITC, and public housing are not associated with the unemployment rate.
[Table 4 about here]
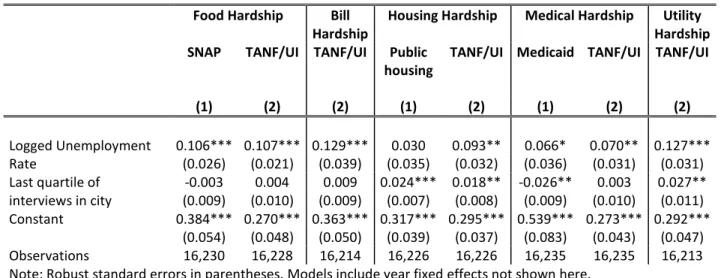
In order to explore how government safety net programs may be helping families avoid hardship we conducted a series of counterfactual analyses. We created ―counterfactuals‖ by generating new measures of hardship using the assumption that had an individual not received government aid they would have experienced a hardship. For example, if an individual reported receiving Medicaid but did not report experiencing a medical hardship, in the counterfactual model we assigned them a medical hardship. We recognize that this is a rough approximation of the effectiveness of the government program in assisting families because we cannot know for certain that someone who received SNAP would have in the absence of that government assistance experienced food insecurity, however it provides an upper bound estimate of the ability of that program to aid families in avoiding hardship. A mother who receives government assistance may still experience hardship. We estimated both the pooled OLS and the individual fixed effects for these models (including the same covariates as in the previous models) for both the original/baseline city unemployment and the current city unemployment. We report the fixed effects results for the original/baseline city the unemployment rate in Table 5. Again, we found that the differences between the OLS and the individual fixed effects models were minimal as well as the difference between current and original/baseline city unemployment.
First we looked at individual government programs that were related to the individual hardships. Model (1) in Table 5 shows these counterfactual models. The first column of the table assigns mothers who received SNAP but did not report a food hardship a point on the food hardship scale. We then regress food hardship on the log of the unemployment rate. We find that if we assign respondents who receive SNAP a food hardship (41 percent of the sample) the unemployment rate is associated with experiencing food insecurity (coefficient of 0.106). Looking at model (1) under housing insecurity we find no statistically significant relationship between the unemployment rate and housing insecurity when mothers who receive public
housing (14 percent of the sample) are assigned a housing hardship. When mothers who received Medicaid (59 percent of the sample) are assigned a medical hardship the association between the unemployment rate and medical hardship is marginally significant with a coefficient of 0.066.
[Table 5 about here]
Model (2) shows the results of a counterfactual model where we combined the receipt of TANF and UI into ―cash assistance‖. As in previous analyses, we assign mothers a hardship if they report receiving cash assistance (19 percent of the sample). Starting with food hardships we find a statistically significant relationship between the unemployment rate and food insecurity in the cash assistance counterfactual (coefficient 0.107). Bill hardships are also associated with the unemployment rate in the cash assistance counterfactual model. A change in the unemployment rate from 5 to 10 percent is associated with a 13 percent increase in the probability of
experiencing a bill hardship. Similarly we find a statistically significant relationship between the unemployment rate and housing, medical and utility hardships. A doubling of the
unemployment rate is associated with a 0.093 increase in the probability of experiencing a housing hardship, a 0.07 increase in the probability of experiencing a medical hardship and a 0.127 increase in the probability of having utilities cut off.
We estimated a number of other counterfactual models not reported here. We estimated the same models where we created a SNAP counterfactual for bills, housing, medical and utility hardships. The results from the SNAP counterfactuals were almost identical to the cash
assistance counterfactuals. Although SNAP is in kind assistance, receipt of SNAP appears to help families avoid other non-food related hardships as well. We estimated an additional model where we combined TANF, UI, SNAP, SSI and EITC receipt into a single counterfactual. The
results from these models are less conclusive and none of the models reached statistical
significance. This result may in part be because assistance like EITC is generally collected in a lump sum (although individuals can get funding back in parts over the year) and therefore we do not see the same relationship with material hardships.
Summary and Conclusion
This paper looks at the effect of the unemployment rate on material hardships and various government safety net measures as well as the role that government aid plays in mitigating the effect of unemployment on material hardship. Focusing on the unemployment rate allows us to exploit an exogenous economic shock to families and neighborhoods. To our knowledge, ours is the first analysis to have focused on the relationship between the unemployment rate and
material hardship as well as on particular dimensions of hardship. Another important contribution of this study is that we examine the relationship in a panel data context, so that many unobservable characteristics of households that might be correlated with the propensity to experience hardship are controlled. Lastly, the last wave of our data was collected during the Great Recession providing us with large variation in the unemployment rate. These data also focus on mostly low-income families, households we might expect to be most affected by a recession.
Our results show that material hardship increases with the unemployment rate. Moreover, the results are generally very similar in pooled OLS models and individual fixed effects models, and are robust to various ways of treating movers suggesting that they are not driven by unobserved characteristics of families or migration. We find that the summary measure of hardship is strongly related to the unemployment rate; when we look at individual hardships, only utilities and bills are associated with the unemployment rate though this may be because safety net programs buffer the effects higher unemployment rates on some types of hardship.
We find that use of SNAP and UI increases with the unemployment rate but other safety net programs are surprisingly unresponsive. However, our counterfactual analyses suggest that government safety nets may play an important role in mitigating the effects of unemployment on material hardship. In particular, the counterfactual models show that cash assistance programs like UI and TANF play a large role in helping families avoid hardships. The counterfactual
models suggest that cash assistance helps families avoid food, bill, housing, medical, and utility hardships. Our analyses suggest that SNAP similarly plays a role in mitigating food hardship, as well as other hardships, but that Public housing and Medicaid do little to mitigate the effects of housing instability and medical hardship respectively. Public housing and Medicaid may not have the ability to be as responsive to macroeconomic changes as other government policies such as SNAP. In addition, we may not be able to pick up effects of Medicaid because if you are eligible for Medicaid and you have a medical problem, you are likely to be signed up for Medicaid upon admission to a hospital. Conversely, many individuals who are signed up for Medicaid use it for preventive care and may not experience any severe medical episode. Medical hardships are more unpredictable than bill, food or utility hardships. An individual may or may not have a medical need arise during a given period, whereas individuals must regularly pay bills, purchase food and pay for utilities. The episodic nature of medical needs makes it harder to detect any relationship between medical needs and use of Medicaid in our data. Lastly, the lack of a relationship between the unemployment rate and Medicaid may be due to measurement error in this variable, as discussed above.
Our study has some other limitations. First, our sample is restricted to mothers who gave birth in large cities in the US and over-samples those who were unmarried at the time of the birth. Hence, it is not a nationally representative sample though it does focus on a group who are likely to be particularly vulnerable to hard times. Second, fixed effects models, although they control for time invariant unobservable characteristics, cannot account for unobserved time varying individual characteristics that may be associated with both the unemployment rate and material hardship. However, the small differences between the OLS and the individual fixed effects estimates provide some reassurance that such unobservables are unlikely to be driving the relationship between the unemployment rate and material hardship. Lastly, although our
counterfactual analyses suggest that government programs have mitigated the effects of the Great Recession, they do not provide a direct test of that hypothesis.
Our findings are suggestive for public policy and future research. We find that the receipt of SNAP and UI increase with the unemployment rate suggesting that these policies may be more responsive than other programs. Our counterfactual models suggest that SNAP and cash assistance (through UI and TANF) are providing a real bridge in income for low income families
and helping them pay bills, avoid food insecurity, and avoid having their utilities shut off. Extending unemployment insurance could have real implications in terms of the frequency with which families go without food, electricity, or other basic needs. As Federal, state and local governments face the need to make budget cuts, reducing funding to programs like SNAP, UI or TANF could have real effects on the material hardships families will face. We also find that the unemployment rate is most strongly associated with difficulty paying bills and with utilities being cut off. This may be because very few government programs directly provide assistance with utility payments (phone, gas, or electric) or general bill payments. Hence, in times of economic crisis families may be more likely to experience these hardships than other hardships. Programs currently available in some locations allow low income families to lower their gas or electric rates, and may help families avoid having their utilities disconnected. Research that further investigates the role of public safety net programs would provide valuable information to policymakers.
Future research should also investigate the effect that hardship has on families and children. Some research suggests that material hardships – utilities cut off in particular – have effects on child aggressive behaviors (Zilanawala and Pilkauskas, 2011). Material hardships may affect many aspects of the family unit. Given the growing literature linking childhood
circumstances to adult outcomes, mitigating the effects of hardship on children should be a particular priority for public policy (c.f. Currie, 2010).
References
Allison, P. D. (2002). Missing data (Vol. 136). Thousand Oaks, CA: Sage.
Bauman, K. J. (2002). Welfare, work and material hardship in single parent and other households. Journal of poverty 6(1).
Beverly, S. (2001). Material hardship in the United States: Evidence from the Survey of Income and Program Participation. Social Work Research 25(3).
Blank, R.M. (1989). Disaggregating the effect of the business cycle on the distribution of income. Economica, 56: 141-163.
_________ (1993.) Why were poverty rates so high in the 1980s? In D. Papadimitriou and E. Wolff (Eds.), Poverty and Prosperity in the Late Twentieth Century. New York: St. Martin's Press.
__________ (2010). Economic change and the structure of opportunity for less skilled workers. In Cancian M. and S.H. Danziger (Eds.), Changing Poverty. New York: Russell Sage Press.
Blank, R.M. and A.S. Blinder (1986). Macroeconomics, income distribution, and poverty. In S.H. Danziger (Ed), Fighting poverty: What works and what does not. Cambridge: Harvard University Press.
Blank, R.M. and D. Card. (1993). Poverty, income distribution and growth: Are they still related? Brookings papers on economic activity, 2:1993.
Blank, R. M. and H. Shierholz. (2006). Exploring gender differences in employment and wage trends among less-skilled workers. In Blank, R.M., Danziger, S. H. and R.F. Schoeni (Eds.), Working and poor: How economic and policy changes are affecting low-wage workers. New York: Russell Sage Foundation.
Carle, A. Bauman, K. and K. Short. (2009). Assessing the measurement and structure of material hardship in the United States. Social indicators research, 92 (1): 35-51.
Citro, C, Michael, R (1995). Measuring poverty: A new approach. Washington, DC: National Academy Press
Conger, R.D. and G.H. Elder, Jr. (1994). Families in troubled times: Adapting to change in rural America. New York: Aldine de Gruyter.
Currie, J. (2010). Inequality at birth: Some causes and consequences. American economic review papers and proceedings.
Cutler, David and Lawrence Katz. (1991). Macroeconomic performance and the disadvantaged. Brookings papers on economic activity 2:1991.
Danziger, S., M. Corcoran, et al. (2000). Work, income, and material hardship after welfare reform. Journal of consumer affairs 34(1): 6-30.
Edin, K., & Lein, L. (1997). Making ends meet: How single mothers survive welfare and low wage work. New York: Russell Sage Foundation.
Elder, G. H., Jr. (1999). Children of the Great Depression: Social change in life experience. Boulder, CO: Westview.
Federman, M., Garner, T. I., Short, K., Bowman Cutter IV, W., Kiely, J., Levine, D., McGough, D. and McMillen, M. (1996), What does it mean to be poor in America? Monthly labor review, 119: 5, 3–17.
Freeman, R.B. (2001). The rising tide lifts...? NBER working paper No. W8155.
Gunderson, C. and J. Ziliak. (2004). Poverty and macroeconomic performance across space, race and family structure. Demography, 41 (1): 61-86.
Haveman R. and J. Schwabish. (2000). Has macroeconomic performance regained its antipoverty bite? Contemporary Economic Policy, 18(4): 415-27.
Heflin, C., J. Sandberg, et al. (2009). The structure of material hardship in US households: An examination of the coherence behind common measures of well-being. Social problems 56(4): 746-764.
Heflin, C. M. and J. Iceland (2009). Poverty, material hardship, and depression. Social science quarterly 90(5): 1051-1071.
Hoynes, H. (2002). The employment, earnings, and income of less skilled workers over the business cycle, In Blank, R.M and D. Card (eds.) Finding jobs: Work and welfare reform. New York: Russell Sage Foundation
Iceland, J. and K. Bauman (2007). Income poverty and material hardship: How strong is the association? The journal of socio-economics 36: 376-396.
Lerman, R. (2002) How do marriage, cohabitation, and single parenthood affect the material hardships of gamilies with children? Urban Institute and American University. Lovell, V. and G. T. Oh (2005). Women's job loss and material hardship. Journal of women
Mayer, S. E. and C. Jenks (1988). Poverty and the distribution of material hardship. The journal of human resources XXIV(1).
Meyer, B. and J.X. Sullivan (2003). Measuring the well-being of the poor using income and consumption. NBER working papers 9760.
Mirowksy, J. and C. Ross (1999). Economic hardship across the life course. American sociological review, Vol. 64 (4): 548-569
Moffitt, R. and A. Cherlin (2002). Disadvantage among families remaining on welfare.The hard to employ and welfare reform. Joint Center for Poverty Research.
Nepomnyaschy, L. and I. Garfinkel (2008). Nonresident father involvement and children's material hardship. Association for public policy analysis and management 2008 annual conference. Los Angeles, CA.
Osborne, C., Berger, K. and Magnuson, K. (in press). Family structure transitions and changes in maternal depression and parenting. Demography.
Ouellette, T., Burstein, N., Long, D., & Beecroft, E. (2004). Measures of material hardship: Final report. Washington, DC: Office of the Assistant Secretary for Planning and Evaluation, Office of the Secretary, U. S. Department of Health and Human Services.
Reichman, N. E., J. O. Teitler, et al. (2005). TANF sanctioning and hardship. Social service review 79(2): 215-236.
Rector, R, Johnson, K, Youssef, E. (1999) The extent of material hardship and poverty in the United States. Review of social economy, 57(3): 351-358.
Rose, R., S. Parish, et al. (2009). Measuring, material hardship among the US population of women with disabilities using latent class analysis. Social indicators research, 94 (3): 391-415
Rubin, D. (1976). Inference and missing data. Biometrika, 63, 581-592.
Short, K ( 2005) Material and financial hardship and income-based poverty measures in the USA. Journal of social policy: 34,1,21-38
Shwartz-Soicher, O., A. Geller, et al. (2009). The effect of paternal incarceration on material hardship. FF working paper WP09-11-FF. Princeton.
Sullivan, J. X., L. Turner, et al. (2008). The relationship between income and material hardship. Journal of policy analysis and management 27(1): 63-81.
Sum, A. and I. Khatiwada (2010). Labor underutilizaiton problems of U.S. workers across household income groups at the end of the Great Recession: A truly great depression among the nation's low income workers amidst full employment among the most affluent. Boston, MA, Center for labor market studies, Northeastern University.
Teitler, J. O., N. E. Reichman, et al. (2004). Sources of support, child care, and hardship among unwed mothers, 1999-2001. Social service review 78(1): 125-148.
Tobin, J. (1994). Poverty in relation to macroeconomic trends, cycles, and policies. In Danziger, S.H., Sandefur, G. and D. Weinberg (Eds.), Confronting poverty. Cambridge: Harvard University Press.
Zilanawala, A., and N.V. Pilkauskas (2011). Low income mothers material hardship and children’s socioemotional wellbeing. FF working paper.
Table 1: Sample Descriptives (means and frequencies) by the Unemployment Rate (N=16,245) Unemployment Rate < 4% 4-4.9% 5 -5.9 % 6-6.9% 7-8.9% 9+% (n=4,320) (n=4,015) (n=3,471) (n=2,757) (n=1,358) (n=324) M or % M or % M or % M or % M or % M or % Material Hardships Aggregate Hardship (0-10) 0.95 0.95 1.00 1.03 1.23 1.39 SD (1.46) (1.42) (1.47) (1.03) (1.63) (1.39) Food Hardship 12.00 12.00 12.00 12.74 16.84 17.95 Bill Hardship 29.00 29.00 30.00 28.19 35.42 38.14 Housing Insecurity 12.00 10.00 11.00 10.98 12.68 15.06 Medical Problems 6.00 5.00 6.00 6.75 6.93 8.97
Utilities Cut Off 18.00 21.00 21.00 22.40 26.25 28.53 Government Safety Nets
TANF 22.00 22.00 19.00 18.33 16.42 16.67 SNAP 38.00 40.00 41.00 43.91 43.76 44.23 UI 4.00 5.00 7.00 7.01 10.06 10.58 SSI 4.00 5.00 6.00 5.92 8.54 7.74 EITC 39.00 46.00 46.00 45.61 51.00 48.07 Public Housing 20.00 17.00 14.00 14.81 13.06 10.51 Medicaid 57.00 58.00 57.00 61.42 62.53 61.22 Covariates Age 24.94 25.20 25.37 25.18 25.46 25.11 SD (5.97) (6.04) (6.17) (6.01) (6.03) (6.03) White 22.00 22.00 24.00 18.61 18.18 25.00 Black 52.00 58.00 43.00 40.33 46.59 27.22 Hispanic 22.00 17.00 29.00 37.77 30.64 42.09 Other 4.00 3.00 4.00 3.28 4.60 5.70
Less than High School 36.00 31.00 30.00 34.89 36.50 40.51 HS graduate/GED 31.00 32.00 32.00 29.75 28.41 30.06
Some college 22.00 26.00 26.00 26.14 25.07 23.42
College and above 11.00 11.00 12.00 9.22 10.01 6.01
Immigrant 15.00 12.00 13.00 17.30 19.94 27.22 Married 24.00 24.00 26.00 23.14 23.28 21.84 Cohabiting 36.00 35.00 36.00 37.98 36.99 41.46 Single 40.00 41.00 38.00 38.88 39.73 36.71 Poverty Ratio (0-12) 2.20 2.31 2.30 2.11 2.39 2.09 SD (2.40) (2.47) (2.47) (2.37) (2.51) (1.91) Depression 13.00 12.00 13.00 10.78 12.37 12.80
Note: Data is in person-years. TANF= Temporary Aid to Needy Families, SNAP= Supplemental Nutrition Assistance Program, UI=unemployment insurance, SSI=Supplemental security income, EITC=Earned income tax credit. All covariates are measured at the baseline survey with the exception of depression which is measured at year 1.
Table 2: Pooled OLS (Model 1) and Individual Fixed Effects (Model 2) Regressions of Summary Hardship: The Unemployment Rate in Current City and Original/Baseline City
Summary Hardship Current City Original/Baseline City
(1) (2) (1) (2)
Logged Unemployment Rate 0.361*** 0.243** 0.370*** 0.327*** (0.087) (0.097) (0.104) (0.107) Last quartile of interviews in city 0.147*** 0.134*** 0.145*** 0.129***
(0.027) (0.031) (0.026) (0.029) Mom’s Age 0.003 0.004 (0.003) (0.003) Black -0.052 -0.056 (0.055) (0.056) Hispanic -0.151** -0.150** (0.058) (0.057) Other 0.096 0.104 (0.081) (0.079) Less than HS 0.124*** 0.121*** (0.037) (0.037) Some College 0.091** 0.088** (0.032) (0.031) College + -0.190** -0.201*** (0.068) (0.067) Immigrant -0.241*** -0.246*** (0.067) (0.069) Cohabiting 0.319*** 0.324*** (0.058) (0.058) Single 0.224*** 0.231*** (0.042) (0.042) Poverty Ratio -0.075*** -0.075*** (0.006) (0.006) Depression 0.768*** 0.763*** (0.058) (0.057) Constant 0.292* 0.579*** 0.290* 0.493*** (0.142) (0.112) (0.149) (0.123) Observations 16,126 16,126 16,224 16,224 Note: Robust standard errors in parentheses. OLS models also include city fixed effects and all models include year fixed effects not shown here.
Table 3: Individual Fixed Effects Regressions of Individual Hardships on the Unemployment Rate in Original/Baseline City
Food Hardship
Bill Hardship Housing Hardship
Medical Hardship
Utilities Cut Off
Logged Unemployment Rate 0.038 0.094** 0.024 0.003 0.082** (0.023) (0.038) (0.019) (0.016) (0.037) Last quartile of interviews in city 0.004 0.013* 0.027*** 0.003 0.042***
(0.008) (0.007) (0.006) (0.005) (0.010) Constant 0.071** 0.179*** 0.104*** 0.039** 0.075* (0.028) (0.043) (0.025) (0.017) (0.042) Observations 16,227 16,203 16,222 16,232 16,201
Note: Robust standard errors in parentheses. Models include year fixed effects not shown here. *** p<0.01, ** p<0.05, * p<0.1
Table 4: Individual Fixed Effect Regression Models of Government Safety Net Programs on the Unemployment Rate in Original/Baseline City
TANF SNAP UI SSI EITC Public Housing Medicaid Logged Unemployment Rate 0.045 0.117*** 0.041** 0.005 -0.032 0.007 0.064 (0.027) (0.025) (0.018) (0.013) (0.026) (0.031) (0.037) Last quartile of interviews
in city 0.006 0.001 -0.004 0.003 0.029*** 0.001 -0.029*** (0.008) (0.010) (0.004) (0.004) (0.009) (0.009) (0.009) Constant 0.239*** 0.331*** -0.016 0.024 0.320*** 0.255*** 0.516*** (0.036) (0.051) (0.019) (0.014) (0.029) (0.045) (0.083) Observations 16,219 16,214 16,210 16,204 15,098 16,097 16,139 Note: Robust standard errors in parentheses. Models include year fixed effects not shown here.
Table 5: Individual Fixed Effects Regressions of Government Safety Net Hardship Counterfactuals on the Unemployment Rate in Original/Baseline City
Food Hardship Bill Hardship
Housing Hardship Medical Hardship Utility Hardship SNAP TANF/UI TANF/UI Public
housing
TANF/UI Medicaid TANF/UI TANF/UI
(1) (2) (2) (1) (2) (1) (2) (2) Logged Unemployment Rate 0.106*** 0.107*** 0.129*** 0.030 0.093** 0.066* 0.070** 0.127*** (0.026) (0.021) (0.039) (0.035) (0.032) (0.036) (0.031) (0.031) Last quartile of interviews in city -0.003 0.004 0.009 0.024*** 0.018** -0.026** 0.003 0.027** (0.009) (0.010) (0.009) (0.007) (0.008) (0.009) (0.010) (0.011) Constant 0.384*** 0.270*** 0.363*** 0.317*** 0.295*** 0.539*** 0.273*** 0.292*** (0.054) (0.048) (0.050) (0.039) (0.037) (0.083) (0.043) (0.047) Observations 16,230 16,228 16,214 16,226 16,226 16,235 16,235 16,213 Note: Robust standard errors in parentheses. Models include year fixed effects not shown here.