Car Driver Attitude towards Road Safety Measures
(Kelakuan Pemandu Kereta ke Arah Pengukuran Keselamatan Jalan) Hussin A.M Yahia*, Sina Safinia, Noof Khamis Al Musharfi & Saband S.I.A. AliABSTRACT
Road traffic accidents (RTA) constituted a severe public problem in all countries of the world. Roughly about 1.5 million
people around the world die in traffic-related accidents. Its absolute impact is exacerbated by the fact that RTA have become
the leading cause of death, especially among young adults who constitute the most economically productive age groups of the larger society. Road traffic accidents also prove to be an issue of economic and social. More than 70% of the injuries and victims of accidents were in low and middle-income countries. The integral role of knowledge and practice of road safety
measures necessitate further emphasis in the RTA prevention. The present study seeks to evaluate the road safety measures’
knowledge among car drivers in Tripoli-Libya. A total of 389 drivers had taken in this study. A questionnaire was used to
gather some relevant information from the participants. The data collected was run in analysis using SPSS version 19. From
the 389 drivers, 310 (79.7%) were male and 79 (20.3%) female. The study results have shown that gender differences in attitudes towards traffic law indicate that there is no significant difference between both sexes. Female had a marginally higher awareness than males with regard to certain substantial issues such as eating, drinking or smoking while driving and using cassette / radio or using the telephone while driving were particularly significant ( P-value = 0.04). Explanations and results of the behaviors of the drivers about safety measures on the roads are discussed.
Keywords: Road accidents; Knowledge; Awareness; Attitudes; Traffic law INTRODUCTION
Road accidents are a considerable concern in both developed and developing countries because of their impact on social, economic and health issues. The World Health Organization
(WHO 2015) every year an estimated 1.5 million people are
killed and up to 50 million are injured or disabled on the world’s roads, 70 percent of those accidents occurring in developing countries. The problem of road traffic accidents is now acknowledged to be a global phenomenon. In all
countries of the world has been noted road safety is a serious public problem. Worldwide, more than half of all road traffic
deaths occur among young adults ages 15-44, over 90% of all road fatalities occur in low and middle-income countries, which have less than half of the world’s vehicles. This
disparity is prominent when considering the distribution of the population; the traffic fatality rate in low- and middle-income countries is 20.2 deaths per 100,000 populations,
while the rate is only 12.6 for high-income countries. In
addition, more than half of the victims are vulnerable road users, such as bicyclists, and pedestrians (WHO 2010).Traffic safety and efficiency have become important indexes for assessing the performance of transportation. Consequently, many efforts have been undertaken to improve transportation systems in the world with respect to these indexes. It is obvious that driver behavior plays an important role in traffic safety and efficiency. In the past decades, much researches related to driver behavior has been done in the world. In the
1970s, major studies on identifying the factors associated
with crashes were done in the United Kingdom (Sabey &
Staughton 1975) and United States (Treat 1980) Both of these studies obtained remarkably similar findings. The UK study found road users to be the sole factor in 65% of crashes whereas the roadway and the vehicle each were identified as the sole factors in 2% of cases. The corresponding values
from the US study were 57%, 3% and 2% respectively. In
nearly all cases involving a vehicular cause, the issue was
vehicle maintenance problem, such as bald tires or worn brake linings. The road user was identified as a sole or contributing
factor in 95% of crashes in the UK study and in 94% of crashes
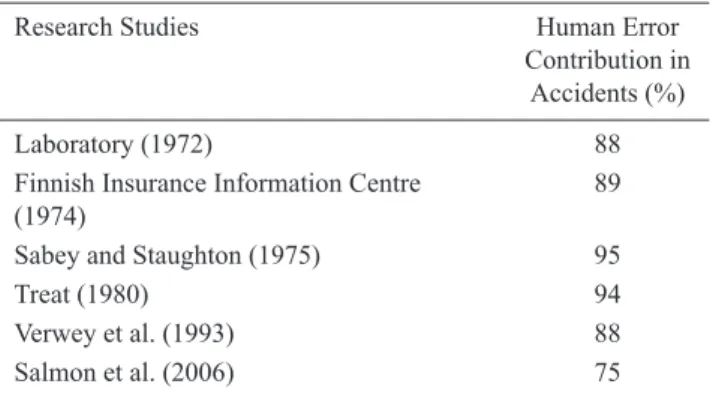
in the US study (Evans 1996). Table 1 summarises the findings
of some other studies that investigated the involvement of human error in accident causation around the world. In these studies, 75-95% of RTA occurrence is attributed to human
error.
TABLE 1. Contribution of human error in road accidents
Research Studies Human Error
Contribution in
Accidents (%)
Laboratory (1972) 88
Finnish Insurance Information Centre 89
(1974)
Sabey and Staughton (1975) 95
Treat (1980) 94
Verwey et al. (1993) 88
Given that risky driving is a major contributor in
road accidents, for reducing levels of risky driving should
understand the behavior of drivers. However, the successful manipulation of risky driving requires a good understanding of its contributing factors (Fernandes et al. 2007) A large volume of research has therefore been conducted into car driver behaviours to provide a better understanding of why they are carried out and how they can be changed to improve safety (Elliott et al. 2002) From one such initial attempt, (Stanton & Salmon 2009) identify four primary groups of
incident causation factors. These are:
1. Human conditions and states ( physical / physiological, mental/emotional, experience/exposure),
2. Human direct causes (recognition errors, decision errors,
performance errors),
3. Environmental factors (highway related, ambient
condition), and 4. Vehicular factors.
EXPERIMENTAL DESIGN
This study was done in Tripoli, due to the population’s car possession, high rate of accidents and a very high population growth, where in estimation 30% of the total Libyan populations have accommodation in Tripoli. Ethical clearance was obtained from General Directorate for Traffic Tripoli, before the study began. The objectives and purpose of the study were briefed to all drivers. The data were gathered through the use of the questionnaire, containing four parts, namely, demographic, knowledge, awareness, attitude and practice. The information collected was analyzed aided by SPSS version 19.
RESULTS AND DISCUSSION
Based on the results of the descriptive analysis, out of a total of 500 questionnaires distributed on respondents, just 389 had completed the administered questionnaire and were considered to constitute the chosen sample in the city of Tripoli. Respondents consisted of 310 male and 79 female. The survey response rate was noted as 76.8%.More than half (81.7%) of respondents (318) are Libyan citizens and 18.3 % of respondents (71) are non-Libyan citizens. As for age groups, the number of respondents was divided almost equally into four groups (25.2%, 31.6%, 26.2% and 17.0%). The largest part of the respondents (41.6%) was secondary school graduates, but 26.0% of them were university graduates. 37.8% of respondents (147) were business men, while 26.5% of respondents (103) were already retired. 68 respondents (17.5%) worked in the government sector, while 71 persons (18.3%) were still studying. An investigation of the marriage status points to the fact that the proportion of single and married respondents (53.0% and 47.0%) was equal. 28.0% of respondents were the most experienced (>12 years); respondents with 6-12 years and 1-5 years of
experience were 31.4% and 40.6%, respectively.The study
participants then offered opinions and views regarding the key behaviors which can cause accidents on the roads? 35% answered lack of experience among young drivers, 26.7% stated that there was excess speed and violation of traffic light, 14.9% claimed that drivers could easily fall asleep at
the wheel, 12.1% linked this to elderly drivers aged 60 and
above and 11.3% owed this to Road and vehicle conditions. Knowledge levels among participants, regarding road safety measures for drivers observed to be considerably accepted; see Table 2.
To draw the comparison between genders for knowledge of awareness and attitudes of traffic safety among drivers,
the statistical results (means and standard deviations) reveal
that in general the differences between genders were far from significant (p < 0.05). Gender differences in attitudes towards the traffic law indicate that there is no significant difference between both sexes (M = 4.14 for females compared with M = 4.11 for males) but it is a fact that females had a
marginally higher traffic culture than males. However,
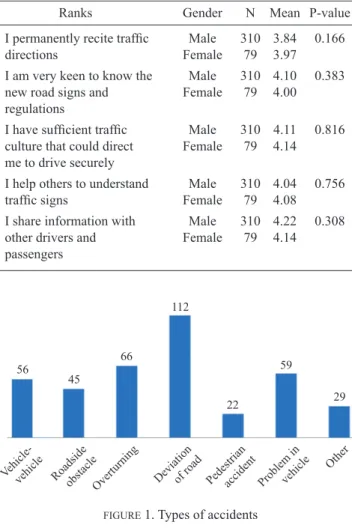
the differences in the traffic culture for genders were not statistically significant. Respondents confirmed that the most common type for traffic accidents is road deviations accidents due to speeding as shown in Figure 1.
TABLE 2. Road safety measures
Ranks Gender N Mean P-value
I permanently recite traffic Male 310 3.84 0.166
directions Female 79 3.97
I am very keen to know the Male 310 4.10 0.383
new road signs and Female 79 4.00 regulations
I have sufficient traffic Male 310 4.11 0.816
culture that could direct Female 79 4.14 me to drive securely
I help others to understand Male 310 4.04 0.756
traffic signs Female 79 4.08
I share information with Male 310 4.22 0.308
other drivers and Female 79 4.14
passengers
FIGURE 1. Types of accidents
56 66 45 112 22 59 29 Problem in vehicle Other Pedestrian accident Deviation of road Overturning Roadside obstacle Vehicle-vehicle
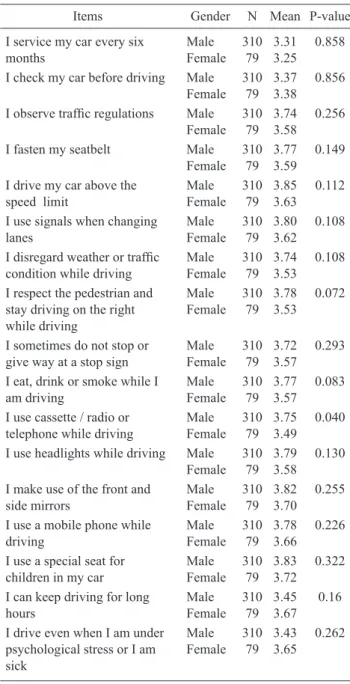
Drivers’ behavior and knowledge levels among the study participants were considerably lower; as shown in Table 3 as the attitude and knowledge levels on the respect for pedestrians and keeping to the right while driving, for males M = 3.78 and females M = 3.53 (P-value = 0.072), eating, drinking or smoking while driving for male M = 3.77 and for females M = 3.57 (P-value = 0.083) and using cassette / radio or telephone while driving was found to be significant (P-value = 0.04) for males M = 3.75 and females M = 3.49.
As shown previously, there is no dramatically significant difference between the genders in gender differences in attitudes towards traffic law. Results of the statistical analysis for driver’s respondents within the age groups 18-25 lower age group did not show much respect towards adhering to the traffic lights and using seat belts while driving. Men
TABLE 3. Drivers’ behavior and knowledge levels among the
study participants
Items Gender N Mean P-value
I service my car every six Male 310 3.31 0.858
months Female 79 3.25
I check my car before driving Male 310 3.37 0.856 Female 79 3.38 I observe traffic regulations Male 310 3.74 0.256
Female 79 3.58
I fasten my seatbelt Male 310 3.77 0.149
Female 79 3.59
I drive my car above the Male 310 3.85 0.112
speed limit Female 79 3.63
I use signals when changing Male 310 3.80 0.108
lanes Female 79 3.62
I disregard weather or traffic Male 310 3.74 0.108
condition while driving Female 79 3.53
I respect the pedestrian and Male 310 3.78 0.072
stay driving on the right Female 79 3.53 while driving
I sometimes do not stop or Male 310 3.72 0.293
give way at a stop sign Female 79 3.57
I eat, drink or smoke while I Male 310 3.77 0.083
am driving Female 79 3.57
I use cassette / radio or Male 310 3.75 0.040
telephone while driving Female 79 3.49
I use headlights while driving Male 310 3.79 0.130
Female 79 3.58
I make use of the front and Male 310 3.82 0.255
side mirrors Female 79 3.70
I use a mobile phone while Male 310 3.78 0.226
driving Female 79 3.66
I use a special seat for Male 310 3.83 0.322
children in my car Female 79 3.72
I can keep driving for long Male 310 3.45 0.16
hours Female 79 3.67
I drive even when I am under Male 310 3.43 0.262
psychological stress or I am Female 79 3.65
sick
were more commonly found to tend to use the phone while
driving than women. Furthermore, almost one-third of the
participants confirmed that they have crossed the speed limit
while driving in many times. These results are similar to those
found by Gharaibeh 2012. The speed and the use of mobile phone while driving and also a lot of risk behaviors are not on the driver only but also a danger to others. Hence, should be improve the behavior of drivers and behavior and attitudes patterns need to be addressed, especially if are related to the behavior of the driver via proper educative and legislative approaches. It was observed there is no difference between males and females in safety precautions for vehicle as check car before driving, service car every six months and used seatbelt, but observed there is the significant difference (P-value = 0.04) in use cassette / radio or telephone while driving between males and females. Although the government has permitted foreign car imports, the specifications in the import have not been stated clearly. Many of the vehicles are not according to the technical specifications and unusable were the reason for traffic accidents on the roads, therefore, the practices with regard to road safety should be promoted
to curtail RTA.
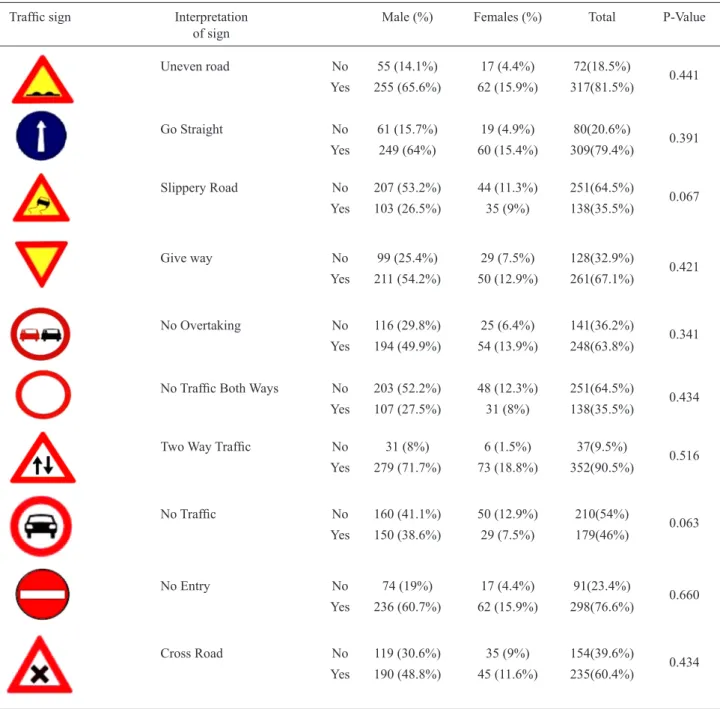
The study participants evidently did not have a better awareness and knowledge for the traffic signs as show in Table 4. The awareness and knowledge for ten traffic signs offered on respondents, the signs most comprehensible for drivers were signs of uneven road (81.5%) and signs of two way traffic (90.5%). Traffic signals of less knowledge by women drivers were sign of no Traffic Both Ways (64.5%) and sign of no Traffic (54%). There is no difference in knowledge for the traffic signs between genders, the knowledge and awareness for traffic signs among drivers as a result of daily exposure to traffic lights on the roads.
The present study aims at assessing the knowledge, awareness about traffic signals as well as practice of safety measures among drivers. The participants’ men were more than women 80% males, due to the customs and traditions. More than 30% of study participants were from the age Group 26-33 years old. 8% of study participants who used government vehicles compared to those who used their own vehicles 92%, similar results had been noted in Saudi Arabia a study done by Al-Khaldi, he found that 70% of study participants used
their own vehicles. Daily congestion and high vehicle usage
rate among the study participants can be explained because the cheap prices of gasoline, making some families possess 3 or 4 vehicles. Even though 17.5% of the study participants
were government servants and they have very convenient
transport facilities provided by the institution not to mention the availability of the public transport, they resorted to use personal vehicles. Even the students who represented 18% of the study participants tended to use their own personal
vehicles. To cushion the congestion, save the environment
and control the pollution all should be motivated to use either the transport facilities provided by government institutions or the public transport. The statistical results for the 5 items on self-reported knowledge of attitudes and awareness of traffic safety among gender have been established. The overall
awareness and knowledge of road safety measures were
convergent between genders, but it is a fact that females had a marginally higher traffic culture than males. Our finding does not deviate much from the observation in the study conducted by Raj et al. (1970) this gender difference in awareness might be explained by the study settings; this study is conducted mainly with the urban population in mind. However, the differences in behavioral and cultural aspects between the rural background and urban population must not escape our consideration. Respecting the law and being exposed better
to media sources (TV, magazines, and radio and roads ads) might offer some justification to the better performance of the female participants in our study.
CONCLUSION
To control the number of road traffic accidents, undertaking proper road safety measures can be seen as the best available interventions. The results indicate that the entire comprehension level for Libyan drivers was low somewhat. Generally, it means connecting with the comprehension level and efficiency level of education. However, the efforts should be made more intense to teach drivers to understand the role of the traffic lights. Driver education and the use of a driver’s handbook can be maximised to teach the meaning of traffic signs as well as rationalizing over the use of seat belts and why we are not allowed to speed more than it is allowed in the
TABLE 4. Awareness among study participants regarding road traffic signs
Traffic sign Interpretation Male (%) Females (%) Total P-Value
of sign Uneven road No 55 (14.1%) 17 (4.4%) 72(18.5%) 0.441 Yes 255 (65.6%) 62 (15.9%) 317(81.5%) Go Straight No 61 (15.7%) 19 (4.9%) 80(20.6%) 0.391 Yes 249 (64%) 60 (15.4%) 309(79.4%) Slippery Road No 207 (53.2%) 44 (11.3%) 251(64.5%) 0.067 Yes 103 (26.5%) 35 (9%) 138(35.5%) Give way No 99 (25.4%) 29 (7.5%) 128(32.9%) 0.421 Yes 211 (54.2%) 50 (12.9%) 261(67.1%) No Overtaking No 116 (29.8%) 25 (6.4%) 141(36.2%) 0.341 Yes 194 (49.9%) 54 (13.9%) 248(63.8%)
No Traffic Both Ways No 203 (52.2%) 48 (12.3%) 251(64.5%) 0.434
Yes 107 (27.5%) 31 (8%) 138(35.5%)
Two Way Traffic No 31 (8%) 6 (1.5%) 37(9.5%) 0.516
Yes 279 (71.7%) 73 (18.8%) 352(90.5%) No Traffic No 160 (41.1%) 50 (12.9%) 210(54%) 0.063 Yes 150 (38.6%) 29 (7.5%) 179(46%) No Entry No 74 (19%) 17 (4.4%) 91(23.4%) 0.660 Yes 236 (60.7%) 62 (15.9%) 298(76.6%) Cross Road No 119 (30.6%) 35 (9%) 154(39.6%) 0.434 Yes 190 (48.8%) 45 (11.6%) 235(60.4%)
traffic rules and regulations. The traffic department in Libya also has a role to play. Licensing should be made a serious requirement. Traffic signals as well as the visibility and impact should be increased, wherein periodic and permanent warning signs should be enforced particularly in specific areas, like residential areas, school crossings, school bus stops, and a few others. These recommendations should be pursued or implemented with the cooperation given by traffic-safety officials in Tripoli, Libya, law-enforcement agencies, and transportation professionals. Intensive programs of traffic regulations and safety on road users, should be carried out on users especially those aged 18 to 33 years, and each medium should be utilized to raise the traffic awareness among people in general, and drivers in particular
ACKNOWLEDGEMENTS
The research was conducted in collaboration with the Department of Civil Engineering, Middle East College/ Knowledge Oasis Muscat, Oman.
REFERENCES
Ajzen, I. 2002. Perceived behavioural control, self-efficacy, locus of control, and the theory of planned behavior. Journal of Applied Social Psychology 32: 665-683. Ajzen, I. 1991. The Theory of Planned Behaviour.
Organizational behavior and human decision processes
50: 179-211.
Darby, P., Murray, W. & Raeside, R. 2009. Applying online fleet driver assessment to help identify, target and reduce occupational road safety risks. Safety Science 47(3): 436-442.
Elliott, M., Armitage, C. & Baughan, C. 2002. Changing Drivers ‘attitudes: Is there potential for changing drivers ‘behaviour? Behavioural Research in Road Safety:
Twelfth Seminar.
Evans, L. 1996. The dominant role of driver behavior in traffic safety. American Journal of Public Health 86(6): 784-786.
Farah, H. 2011. Age and gender differences in overtaking manoeuvres on two-lane rural highways. Transp. Res. Record 2248: 30-37.
Fernandes, R., Job, R. & Hatfield, J. 2007. A challenge to the assumed generalizability of prediction and
countermeasure for risky driving: Different factors
predict different risky driving behaviors. Journal of Safety Research 38(1): 59-70.
Hussein A.M Yahia & Amiruddin Ismail 2013. Causes and effects of road traffic accidents in Tripoli-Libya. Proceeding the 6th Civil Engineering Conference in Asia
Region: Embracing the Future through Sustainability.
Jakarta, Indonesia.
Mekky, A. 1984. Road traffic accidents in rich developing countries: The case of Libya. Accident Analysis &
Prevention 16(4): 263-277.
Sabey, B. & Staughton, G. 1975. Interacting roles of road
environment vehicle and road user in accidents. CESTE
I MOSTOVI.
Sabey, B.E. & Taylor, H. 1980. The known risks we run: the highway Ed.: Springer.
Salmon, P.M., Regan, M.A. & Johnston, I. 2006. Human error and road transport: Phase two – A framework for
an error tolerant road transport system Ed.
Stanton, N. A. & Salmon, P.M. 2009. Human error taxonomies applied to driving: A generic driver error taxonomy and its implications for intelligent transport systems. Safety
Science 47(2): 227-237.
Syed & Shamsul 2003. Study of heavy vehicles driver behavior in road accidents of Bangladesh, 26th Australian Transport Research Forum. New Zealand 1-3 October 2003.
Treat, J.R. 1980. A study of precrash factors involved in traffic
accidents. HSRI Research Review.
Varhelyi, A. 1997. Dynamic speed adaptation in adverse
conditions. Proceedings, 4th World Congress on Intelligent Transport Systems. pp. 21-24.
WHO (World Health Organization). 2010. Global status
report on road safety: time for action. World Health
Organization, Geneva.
*Hussin A.M Yahia, Sina Safinia, Noof Khamis Al Musharfi
Department of Civil Engineering, Middle East College Knowledge Oasis Muscat
Sultanate of Oman Saband S.I.A. Ali
Department of Civil Engineering Near East University
Lefkoşa, North Cyprus
*Corresponding author; email: hyahia@mec.edu.om
Received date : 3rd August 2017
Accepted date : 19th August 2017 In Press date : 16th October 2017