Modeling an Intelligent Variable Power Supply Device
Shoewu, O. and Makanjuola, N.T.
Department of Electronic and Computer Engineering, Lagos State University, Epe Campus, Lagos, Nigeria. *Corresponding author: Shoewu, O. E-mail: [email protected],
Received: June 2, 2015, Accepted: July 18, 2015, Published: July 18, 2015
ABSTRACT
This paper presents the design and development of a simple but efficient digitally controlled regulated power supply of a variable voltage ranging from 0v to 15v with a maximum output current of 5A is presented in this paper. The approach employed here is generally an embedded system, designed around an intelligent microcontroller which is provided with a digitized reference voltage to control the input and the output liquid crystal display for the provision of greater precision, stability and accurate results for electronic engineering laboratory experiments. The model developed is significant with a mean square of 12.43. The pure error obtained from the analysis of variance is 3.77, while the percentage regulation is 41.12%.
Keyword: Intelligent, PSU, Voltage, Microcontroller, Precision
INTRODUCTION
In most developing countries, like Nigeria, the electricity from the power grid is an alternating current (a.c). Most walls outlets carry an effective a.c voltage of 220V with the frequency of 50Hz. The energy from the wall outlet is practically limited, but it must be converted from the alternating current (a.c) to direct current (d.c) and tailored to permit the right voltage suitable for electronic equipment. This can be achieved by using a dc power supply unit (Power Supply Unit or PSU)[4]. The PSU is a device that supplies electrical power to a device or group of devices. The term is most commonly applied to units that are integrated with the devices they supply power to, such as computers and household electronics. Usually, the PSU used in the laboratory for experimental purpose is called a laboratory bench supply. It is a variable output power supply unit that can supply either a uni- or bi- polar power to the load connected. The need to carry out experiments on electronic devices to ascertain its characteristics and specifications is mandatory [12]. This makes the bench power supply important equipment in the laboratory for testing low power devices. In carrying experiments, accuracy and stability is required. Errors can be introduced into an experiments by the inaccuracy of the voltage (or current) supplied by the power supply unit [4] .To eliminate such deficiencies, the power supply unit is required to be as accurate as possible. In this design, a microcontroller is utilized as a control unit to make the power supply unit programmable and more precise in the value of the output voltage. The challenge of calibration in the output is therefore overcome by calibrating the output voltage digitally. This gives the programmable power supplies an advantage in precision. Consequently, the internal complexity of a microcontroller used in digitizing the reference voltages reduces the number of components in the
circuit and also increases the functionality of the power supply unit.
Basic Overview of the Unit
The requirement of a regulated dc power supply differs widely among the various electronic and laboratory devices. The primary characteristics that need to be considered in the design of a regulated power supply are the output dc voltage (Vdc), maximum current (Imax) required by the load, the
tolerance level and the percentage regulation (%Reg) allowable[2,4,10]. Using the block diagram in figure 2.1, the various stages of the variable power supply circuit are briefly described as follows:
Fig. 2.1 Intelligent PSU Block diagram
The Transformer
The transformer takes the input supply from A.C mains voltage of 220v and steps it down to a lower voltage level of 24V.
The Bridge Rectifier
The ac voltage from the transformer is rectified using a full-wave bridge rectifier to give equal positive and negative voltages, which is needed in many circuits example, the operational amplifier circuits. The output is d c in a sense that it does not change polarity, but it has periodic variations in voltage about a steady value called ripples[18].
The Smoothing Circuit
The ripples are smoothened using a low-pass filter in the form of a shunt capacitor. Choosing capacitors that are
JOURNAL OF ADVANCEMENT IN
ENGINEERING AND TECHNOLOGY
Journal homepage: http://scienceq.org/Journals/JAET.php
sufficiently large, the ripple voltage is reduced to a low level [4].
The Voltage Regulator
This is the stage that delivers a stabilized D.C voltage to the output as set by the control Unit[15]. The regulator circuit provides a fixed voltage to power the intelligent microcontroller unit (MCU) and the reference voltage for stable calibrated output voltage.
The Fixed Voltage Regulator
This unit regulates the 24V D.C output to 5V used to power the control unit, the MCU, and the display unit.
The Reference Voltage regulator
The reference voltage regulator provides an eighteen volt (18V) reference voltage needed for monitoring and displaying the output voltage by the MCU.
The Intelligent Control Unit
The digital control of the output voltage, the input, as well as the output display is achieved by the use of PIC18F2620 microcontroller unit. The PIC is a 28 pin chip in a surface mount package, powered by a 5 volt source that is derived fixed Regulator Unit [5,8,13]. This particular microcontroller was chosen due to the relatively large number of input/ output pins, which enable it to be used with a lot of peripherals like the LCD displays, keypads and other low power electronic components. Depending on the resolution of the microcontroller, the output voltage can be made to be very accurate by setting a suitable reference value from 0 to 255 for the digital to analogue converter (ADC) [8,13].The intelligence of the control unit was achieved by writing the appropriate code for the chip to accept signals from the keypad and deliver the appropriate voltage reference and also, to display the output voltage.
Input Unit
The value of the output that is desired was keyed into the power supply unit using the input key buttons. The key buttons of normally opened switches were connected to the input port of the microcontroller. The microcontroller uses the code written for the key button to scan input port to detect when a switch has been depressed and then, it carries out the necessary instruction that is programmed for the key [8].
Liquid Crystals Display unit
LCD displays are commonly used in electronics as a method of displaying decimal numeric feedback on the internal operations of devices [9,12]. LCD is a thin, flat panel used for electronically displaying information such as text, images, and moving pictures. Its uses include monitors for computers, televisions, instrument panels, and other devices ranging from aircraft cockpit displays, to every-day consumer devices such as video players, gaming devices, clocks, calculators, and
telephones. Among its major features are its portability, and its ability to produce output in much larger screen sizes [9].
Design Considerations
The Intelligent laboratory bench supply proposed in this work obeys the following hardware and software design considerations for individual sub units.
Hardware Design Considerations Voltage Transformation:
A 220v/24v step-down transformer was used to bring down the voltage to a conveniently low value for the PSU circuit. The transformer offers the special advantage in that it electrically isolates the power supply circuit from the main input supply and therefore eliminates risks that could occur as a result of working with the mains directly. The transformer used consists of two coils that are electrically insolated and arranged such that a changing magnetic field in the secondary coils is set up by an alternating electromotive force (EMF) in the secondary coils[17]. The frequency of the 24v transformer is 50Hertz.The power output is given by relation:
P=IVCosФ (1)
Rectification
Rectification is obtained with the aid of rectifier bridge diodes which have current ratings going from 14 to 25A and breakdown voltage between100v to 1000v. Basically, the design considerations for a rectifier is the load current and the Peak Reverse Voltage (PRV)[3,6,16 ].Therefore for the design of a power supply with a maximum load current of 5A with a PRV of vpeak which is equal to 24√2 v.The
rectifier G13N251 single chip bridge rectifier was chosen.
Filtering
The dc voltage generated from the ac line by rectification usually contains residue of the 50Hz input voltage and this can be reduced as much as desired by means of a suitable by-pass filter capacitor. The chosen filter capacitor to be large enough to provide acceptably low ripple voltage rating sufficient to handle the worst-case combination of no-load and secondary transformer voltage. The ripple voltage was calculated by assuming a constant load current equal to the maximum output load current [4]. The ripple factor (Kr)
which is the ratio of the ripple voltage to the peak secondary voltage of the transformer is design to a value of 10% since the worst-case line voltage variation to contend with is 10%[6,18]. Hence, the filtering capacitance is obtained from the equation given below:
C = C1= C2 ≥ IDCMAX / 2√3.kr..vpeak.2.fsupply (2)
5/2√3 X 0.1 X 12 √2 X 2 X 50= 8505µF
Since the capacitor is to withstand a peak voltage of about 24√2v (peak voltage of a 24 volts transformer), hence, its value was chosen as: C = C1 = C2 = 10,000µF, 50V, a
standard value obtainable in the market.
Static and Reference Voltage Static Voltage
This is responsible for providing required power supply to the controller block as well as the display. A fixed three-terminal LM7805 voltage regulator was used. It has a maximum input voltage of 35V, a minimum input voltage of 7.2V, an output voltage of 5V and a current rating of 500mA [4,10]. The input supply to it in this circuit is 24V and the current requirement is not more than 250mA, hence its choice for the task.
Reference Voltage
The PIC18F2620 requires 18V reference voltage for comparison and monitoring of the output voltage [1,7,8,13 ]. The LM317, an adjustable voltage regulator, was used for this purpose. The LM317 operates with a voltage difference
of 1.2 between the output terminal and adjustment terminal and requires a minimum load of 10mA, so a 100ohm resistor was chosen which will draw (1.2/100 = 12mA). This same current flows through R2, R3 and R4 to ground [2, 6] . The output was set by adjusting R3 to the desired voltage.
Intelligent Control Unit
The control section of the hardware comprises mostly of digital components which require little or no calculations for the derivation of the components used. The main component of this section is the microcontroller. The PIC18F2620 microcontroller was chosen because of the large number of input/output data pin (28) which is required for this project. The large memory size (4k byte) and the ability to be reprogrammed via a programmer was also part of the design considerations [1,8,13]. It has an analog to digital converter, PWM module, USART and extended instruction set. Other components of the control section are the digital to analogue converters (AD557JN) and the LM458 operational amplifier. The micro controller generates the appropriate digital signal that feeds the Digital-to-Analog converter which is eventually amplified by the Op-Amp.
The Digital-To-Analog Converter (DAC) and Op-Amp design considerations
The Vcontrol needed to program the power supply is obtained
from the DAC used- AD557JN. The AD557JN is an 8 bit input DAC which gives maximum full scale voltage of 2.5V. The reference voltage (Vref) was designed to have a
variation from 0v to 15v but the DAC can only supply 2.5V. This was amplified by the OP-Amp as shown in figure 3.1 to get 15V. This implies that in order to get 15V at the output of the OP-Amp, it must provide a gain of 6, to the input signal[3,16]. i.e.
Gain = Rf/R1. (3)
If gain = 6, and R1 is chosen to be 1KΏ, then Rf was
calculated as: 6= Rf/1, therefore, Rf = 6 i.e. 6K Ώ. The 1Mn resistor, set the biasing current at the order of micro amperes. The overall circuit diagram is as shown in figure 3.2.
Figure 3.1: The Analogue to Digital Conversion
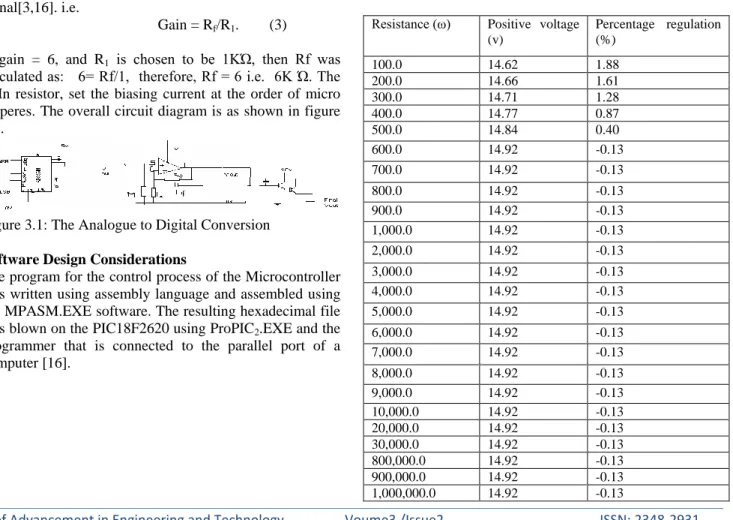
Software Design Considerations
The program for the control process of the Microcontroller was written using assembly language and assembled using the MPASM.EXE software. The resulting hexadecimal file was blown on the PIC18F2620 using ProPIC2.EXE and the
programmer that is connected to the parallel port of a computer [16].
Figure 3.2: The overall circuit diagram for the intelligent PSU
TESTING AND RESULTS
The intelligent PSU was calibrated and tested for the voltage regulation when subjected to varying loading conditions at an output voltage of 14.9v. The aim of the experiment is to determine the difference in the output voltage when on-load from no-load conditions. For the voltage regulation test, the output is kept constant at 14.9v and connected to varying resistive loads. The percentage difference in voltage is tabulated in table 1 for the voltage of 14.9v and the corresponding graph is plotted on graph 1.
Table I: Values for the percentage regulation output voltages for varying loads
Resistance (ω) Positive voltage (v) Percentage regulation (%) 100.0 14.62 1.88 200.0 14.66 1.61 300.0 14.71 1.28 400.0 14.77 0.87 500.0 14.84 0.40 600.0 14.92 -0.13 700.0 14.92 -0.13 800.0 14.92 -0.13 900.0 14.92 -0.13 1,000.0 14.92 -0.13 2,000.0 14.92 -0.13 3,000.0 14.92 -0.13 4,000.0 14.92 -0.13 5,000.0 14.92 -0.13 6,000.0 14.92 -0.13 7,000.0 14.92 -0.13 8,000.0 14.92 -0.13 9,000.0 14.92 -0.13 10,000.0 14.92 -0.13 20,000.0 14.92 -0.13 30,000.0 14.92 -0.13 800,000.0 14.92 -0.13 900,000.0 14.92 -0.13 1,000,000.0 14.92 -0.13
The percentage regulation is calculated as follows:
Percentage Regulation (%)= (Voltage on no-load-Voltage on load) x 100% Voltage on no-load
From table 1, the graph of the percentage voltage regulations for both positive and negative voltage is plotted against load for both the positive and negative side of the power supply unit.
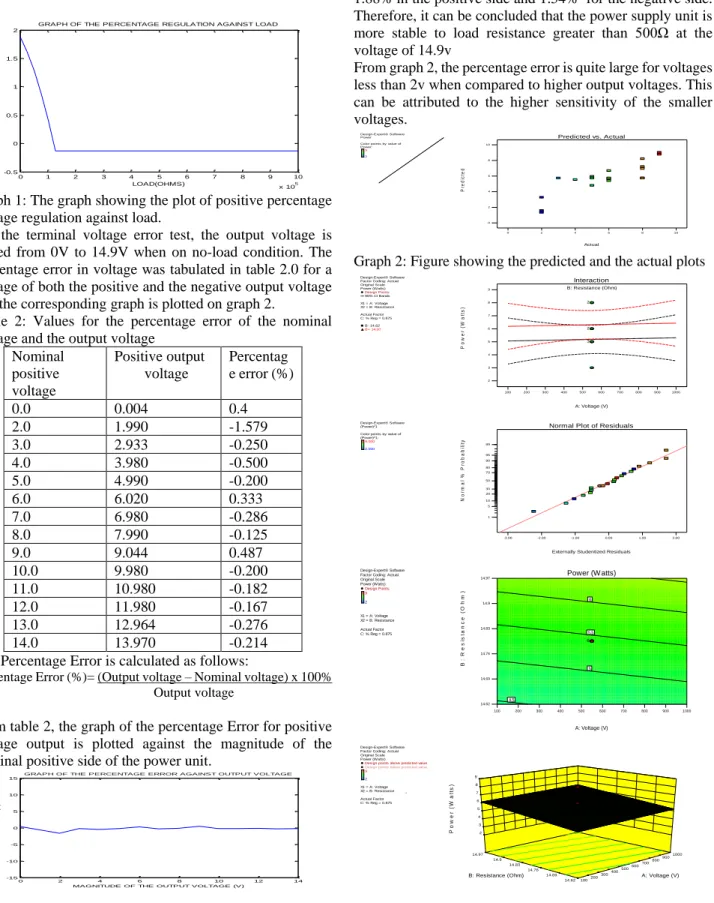
Graph 1: The graph showing the plot of positive percentage voltage regulation against load.
For the terminal voltage error test, the output voltage is varied from 0V to 14.9V when on no-load condition. The percentage error in voltage was tabulated in table 2.0 for a voltage of both the positive and the negative output voltage and the corresponding graph is plotted on graph 2.
Table 2: Values for the percentage error of the nominal voltage and the output voltage
Nominal positive voltage Positive output voltage Percentag e error (%) 0.0 0.004 0.4 2.0 1.990 -1.579 3.0 2.933 -0.250 4.0 3.980 -0.500 5.0 4.990 -0.200 6.0 6.020 0.333 7.0 6.980 -0.286 8.0 7.990 -0.125 9.0 9.044 0.487 10.0 9.980 -0.200 11.0 10.980 -0.182 12.0 11.980 -0.167 13.0 12.964 -0.276 14.0 13.970 -0.214
The Percentage Error is calculated as follows:
Percentage Error (%)= (Output voltage – Nominal voltage) x 100% Output voltage
From table 2, the graph of the percentage Error for positive voltage output is plotted against the magnitude of the nominal positive side of the power unit.
Graph 1: The graph showing the percentage error against output voltage.
From the result obtained from the graph, it can be observed that the percentage voltage regulation for the power supply unit is constant for values of resistance not lower than 500Ω, because these values cause the voltage to vary as much as 1.88% in the positive side and 1.54% for the negative side. Therefore, it can be concluded that the power supply unit is more stable to load resistance greater than 500Ω at the voltage of 14.9v
From graph 2, the percentage error is quite large for voltages less than 2v when compared to higher output voltages. This can be attributed to the higher sensitivity of the smaller voltages.
Graph 2: Figure showing the predicted and the actual plots
0 1 2 3 4 5 6 7 8 9 10 x 105 -0.5 0 0.5 1 1.5 2 LOAD(OHMS) PE RC EN TA G E RE G UL ATI O N (% )
GRAPH OF THE PERCENTAGE REGULATION AGAINST LOAD
0 2 4 6 8 10 12 14 -15 -10 -5 0 5 10 15
MAGNITUDE OF THE OUTPUT VOLTAGE (V)
PE RC EN TA GE ER RO R ( %)
GRAPH OF THE PERCENTAGE ERROR AGAINST OUTPUT VOLTAGE
Design-Expert® Software Power Color points by value of Power: 9 2 Actual P re d ic te d Predicted vs. Actual 0 2 4 6 8 10 0 2 4 6 8 10 Design-Expert® Software Factor Coding: Actual Original Scale Power (Watts) Design Points 95% CI Bands X1 = A: Voltage X2 = B: Resistance Actual Factor C: % Reg = 0.875 B- 14.62 B+ 14.97 A: Voltage (V) B: Resistance (Ohm) 100 200 300 400 500 600 700 800 900 1000 P o w e r (W a tt s ) 2 3 4 5 6 7 8 9 3 2 2 Interaction Design-Expert® Software (Power)^1 Color points by value of (Power)^1:
9.000
2.000
Externally Studentized Residuals
N o rm a l % P ro b a b il it y
Normal Plot of Residuals
-3.00 -2.00 -1.00 0.00 1.00 2.00 1 5 10 20 30 50 70 80 90 95 99 Design-Expert® Software Factor Coding: Actual Original Scale Power (Watts) Design Points 9 2 X1 = A: Voltage X2 = B: Resistance Actual Factor C: % Reg = 0.875 100 200 300 400 500 600 700 800 900 1000 14.62 14.69 14.76 14.83 14.9 14.97 Power (W atts) A: Voltage (V) B : R e s is ta n c e ( O h m ) 4.5 5 5.5 6 6 Design-Expert® Software Factor Coding: Actual Original Scale Power (Watts)
Design points above predicted value
Design points below predicted value
9 2 X1 = A: Voltage X2 = B: Resistance Actual Factor C: % Reg = 0.875 14.62 14.69 14.76 14.83 14.9 14.97 100 200 300 400 500 600 700 800 900 1000 2 3 4 5 6 7 8 9 P o w e r ( W a tt s ) A: Voltage (V) B: Resistance (Ohm)
ANOVA for Response Surface 2FI model
Analysis of variance table [Partial sum of squares - Type III]
Sum of Mean F p-value
Source Squares df Square Value Prob > F
Model 74.58 6 12.43 5.95 0.0035 significant
A-Voltage 1.697E-005 1 1.697E-005 8.121E-006 0.9978
B-Resistance 5.50 1 5.50 2.63 0.1288
C-% Reg 41.12 1 41.12 19.68 0.0007
AB 2.984E-013 1 2.984E-013 1.428E-013 1.0000
AC 2.984E-013 1 2.984E-013 1.428E-013 1.0000
BC 40.50 1 40.50 19.38 0.0007
Residual 27.17 13 2.09
Lack of Fit 8.33 8 1.04 0.28 0.9476 not
significant
Pure Error 18.83 5 3.77
Cor Total 101.75 19
CONCLUSION
This work has successfully presented a functional, low-cost intelligent laboratory bench power supply unit using the PIC18F2620 microcontroller. The use of the microcontroller for this design reduces the size and hence the cost of the unit. The PIC was successfully programmed to facilitate control of both the input and the output voltages. The tests carried out on the project proved that the project is stable, reliable and accurate.
Recommendations
It is recommended that future work should improve on the voltage variation of the output. Also, the voltage variation could be made to vary in fractions of voltage in order to make it more sensitive.
REFERENCES
1. Smith D.W, (2002). PIC in Practice. Burlington: Newness publishers
2. Horowitz P and Hill W (1980), Art of Electronics. Cambridge :Cambridge Press.
3. Donald A. N, (1996). Electronic Circuit Analysis and Design. Osborne : McGraw-Hill Company Inc. 4. Williams O.A, (1995). Design and Construction of a
regulated Power Supply Unit. Cambridge : Cambridge Press.
Des ign-Expert® Software Factor Coding: Actual Des irability 1.000 0.000 X1 = A: Voltage X2 = B: Res is tance Actual Factor C: % Reg = 1.88 14.62 14.7075 14.795 14.8825 14.97 100 325 550 775 1000 0.000 0.200 0.400 0.600 0.800 1.000 D e s ir a b il it y A: Voltage (V) B: Resistance (Ohm) Design-Expert® Software Factor Coding: Actual Original Scale Power (Watts) Design Points 95% CI Bands X1 = A: Voltage Actual Factors B: Resistance = 14.795 C: % Reg = 0.875 A: Voltage (V) 100 200 300 400 500 600 700 800 900 1000 P o w e r (W a tt s ) 2 3 4 5 6 7 8
9 Warning! Factor involved in multiple interactions.
2
2
One Factor
Design-Expert® Software Factor Coding: Actual Std Error of Design Std Error Shading 1.500 0.500 X1 = A: Voltage X2 = B: Resistance Actual Factor C: % Reg = 0.875 14.62 14.69 14.76 14.83 14.9 14.97 100 200 300 400 500 600 700 800 900 1000 0.000 0.200 0.400 0.600 0.800 1.000 S td E rr o r o f D e s ig n A: Voltage (V) B: Resistance (Ohm)
5. Fredko M., (2000). Customizing PIC Microcontrollers. Osborne : McGraw- Hill Company Inc .
6. Theraja B.L. and Theraja A.K., (2002), A Textbook of Electrical Technology, S. Chand, New Delhi.
7. Penfold R.A., (1997). An Introduction to PIC Microcontrollers. Babani Electronic Books Publishers. 8. Bates M., (2000). Introduction to Microelectronic
Systems : The PIC16F84A Microcontroller. London : Arnold Publishers.
9. Ronald J. T and Neal S. W, (2004). Digital Systems: Principles And Applications. Bombay : Prentice Hall Publishers.
10. Berkowitz S., (2003). Powering Digital Circuits and Systems. Toronto, Canada: Orbit Educational Book Publishers.
11. Williams B.W., (2002). Power Electronics, Devices, Applications and Passive Components. Toronto, Canada : Orbit Educational Books Publishers.
12. Austender D. and Saues P., (1998). Microprocessors For Measurement and Control. New Jersey : Prentice-Hall International .
13. PIC18F2620 Datasheet, Retrieved September 15th , 2009 from : www.microchip.com
14. Wikipedia (2009), “Power Supplies”, Retrieved
October 2009 from :
http://en.wikipedia.org/wiki/power_supply
15. Penfold R, (2007). Everyday Practical Electronics Magazine, February 2007. Dorset, U.K : Wimborne Publishing Ltd.
16. Proteus Software, Retrieved October 2009 from : www.Labcenter.com
17. Osuwa J.C,C.I Oriaku and E.O Abgoma.2008.”Logic Indicating Device for Trouble hooting Non-Pulsed Output Signals of Integrated Circuits(ICs)”.Pacific Journal of Science and Technology.9(2):294-301 18. Hammed O.S and Ademola A.K. 2008.”Design and
Construction of an Emergency Rechargeable Lamp Incorporated with a Battery Overcharging Preventer Circuit”.Medwell Journal of Engineering and Applied Sciences.3(9):684-687
Citation: Shoewu, O. and Makanjuola, N.T (2015). Modeling an Intelligent Variable Power Supply Device. J. of Advancement in
Engineering and Technology. V3I2. DOI: 10.15297/JAET.V3I2.03
Copyright: © 2015 Shoewu, O. This is an open-access article distributed under the terms of the Creative Commons Attribution License,