Using Multimodal Learning Analytics to Identify Aspects of
Collaboration in Project-Based Learning
Daniel Spikol, Malmö University, Sweden, [email protected] Emanuele Ruffaldi, Scuola Superiore Sant'Anna, Italy [email protected]
Mutlu Cukurova, University College London, UK, [email protected]
Abstract: Collaborative learning activities are a key part of education and are part of many common teaching approaches including problem-based learning, inquiry-based learning, and project-based learning. However, in open-ended collaborative small group work where learners make unique solutions to tasks that involve robotics, electronics, programming, and design artefacts evidence on the effectiveness of using these learning activities are hard to find. The paper argues that multimodal learning analytics (MMLA) can offer novel methods that can generate unique information about what happens when students are engaged in collaborative, project-based learning activities. Through the use of multimodal learning analytics platform, we collected various streams of data, processed and extracted multimodal interactions to answer the following question: which features of MMLA are good predictors of collaborative problem-solving in open-ended tasks in project-based learning? Manual entered scores of CPS were regressed using machine-learning methods. The answer to the question provides potential ways to automatically identify aspects of collaboration in project-based learning.
Introduction
Collaborative learning activities are key part of education and are part of many common teaching approaches including problem-based learning, inquiry-based learning, and project-based learning. Such constructivist teaching approaches have the potential to help foster the 21st-century learning skills we require of young people across subject domains (Banks & Barlex 2014). Particularly within the context of computer science education, most of these activities take place as open-ended, collaborative, small group work where learners make unique solutions to tasks that involve robotics, physical computing, and programming code as well as designing artefacts. However, the evidence on the effectiveness of using such teaching methods to satisfy common learning outcomes is rare (Klahr & Nigam 2004; Kirschner et al. 2006). Blikstein and Worsley (2016) argue that one reason for this be that evaluation in this context is notoriously laborious and requires measurement methods that the current standardised testing strategies and psychometrics cannot provide. Learning analytics research, particularly multimodal learning analytics (MMLA) can offer novel methods that can generate distinctive information about what happens when students are engaged in collaborative project-based learning activities (Worsley & Blikstein 2014). In this paper, we focus on collaborative problem-solving (CPS). We present an empirical study through which we explored CPS in groups of university engineering students (aged 20-22 years) through the use of specially designed workstation and MMLA system that collected diverse multimodal interaction data.
MMLA offers researchers new tools to capture different types of data from these complex learning activities (Ochoa et al. 2013). The ability to collect multimodal data from bodily movements, face tracking, affective sensors, log files from the hardware and software, user and research generated data provide opportunities to obtain useful features for understanding collaborative learning. Through the use of multimodal learning analytics platform, we collected diverse streams of data from learning activities. We processed and extracted multimodal interactions to answer the following question: which features of MMLA are good predictors of CPS in open-ended tasks in project-based learning? In particular, we performed a regression task over human evaluated CPS scores by means of machine learning techniques. The answer to the questions provides ways to automatically identify aspects of students CPS practices and provides means for different types of interventions to support and scaffold the students and inform teaching practices.
Collaborative problem-solving
CPS is a term that is increasingly used to refer to the process of people working together to solve a problem with equivalent roles. It brings together individual problem-solving and the social collaborative process of more than one individual learner working together. Both the subject of problem-solving and the subject of collaborative learning have a substantial research history in their right. However, it is important that we make clear what we mean by the term CPS, because, as learning analytics developers, we rely on effective frameworks to drive the
analysis of our data that answers the research questions we pose. Research questions that are themselves shaped by our theoretical understanding, which enables us to make sense of our data, to identify data sets that indicate the effective implementation of the educational construct under investigation and differentiate them from data sets that evidence a less effective implementation. The OECD Collaborative Problem Solving Framework, for example identifies three dimensions for understanding and assessing problem solving: context, task and process (2015).
Context in CPS is described as the circumstances of the problem being solved. Context consists of the resources that are available to learners to support their collaborative learning activity (Luckin, 2010). A CPS task can be thought of as a set of features that represent a gap or crossroads where the way forward to solve the problem is to an extent unknown and must be generated and/or co-constructed by two or more participants. CPS might be as much about identifying a possible solution as about identifying and producing the solution. The process of CPS requires the combination or the inter-relation of social and cognitive processes. Ideally, interaction and joint problem-solving will centre on a number of parallel cognitive activities, such as understanding the problem situation, clarifying sub goals and reflecting on assumptions. In addition to the OECD approach, which was developed for assessment of individual student capacities, we can also consider CPS as a tuition approach (Cukurova et al. 2016) and at groups and communities’ levels (Dillenbourg, & Jermann, 2007). These considerations would also increase the complexity further.
CPS is a complex concept with multiple dimensions. In the literature, many variables have been identified as indicators of successful CPS, or collaborative learning and warrant further investigation. These variables include equality and mutuality (Damon & Phelps 1989), symmetry (Dillenbourg 1999), synchrony of groups’ actions and gaze (Schneider & Blikstein, 2015; Schneider & Pea, 2013), individual accountability of participants (Johnson, & Johnson, 2003; Springer, Stanne, & Donovan, 1999), reaction time of participants to the actions of members of the the group (Raca, Tormey, & Dillenbourg, 2014), and reaction of students to the prompts of teachers (Sharma, Jermann, & Dillenbourg, 2014). In this paper, we further explore synchrony and individual accountability as independent variables to identify CPS. It is important to note here that the results on synchrony of groups’ body actions are not conclusive. Although, overwhelming majority of existing evidence suggests that synchrony can predict collaboration in Educational Psychology research (cf. Lakens, & Stel, 2011; Wiltermuth, & Heath, 2009), this may not be the case for all data sets and interpretations of synchrony. For instance, although Schneider and Blikstein (2015) find that synchrony in groups’ actions may not predict collaborative learning, their gaze synchrony does predict it. Therefore, in our interpretation, we used a combination of their hand movements and head direction (where they are looking) to interpret synchrony. In addition to these two variables, we use the amount of physical engagement of students as this is an important aspect of project-based learning environments.
Multimodal learning analytics
To better accommodate learning in small groups, researchers typically use low-cost sensors and inexpensive computational power for obtaining data from diverse sensors that include computer vision, audio, biometric, and data from the learning objects (like physical computing components or laboratory equipment) to collect insights. The multimodal data from these sensors provides new opportunities for investigating learning activities in the real-world between small groups of learners working on tasks with physical objects (Halverson & Sheridan 2014; Blikstein & Worsley 2016).
There is an emerging body of work with MMLA to capture small group work on project-based learning that has grown out of the work of (Blikstein & Worsley 2016; Chen et al. 2014; Ochoa et al. 2013) explored multimodal techniques for capturing code snapshots to investigate students learning computer programming and video and gesture tracking for engineering tasks. Worsley and Blikstein (2014) presented different approaches for data integration and fusion and how these can have a significant impact on the relation of research and learning theories. These approaches provided the means for other researchers to begin to explore MMLA with small groups of students across different subjects. Ochoa et al. work (2014) used existing multimedia processing technologies to produce a set of features for accurate predictions of experts in groups of students solving math problems. Grover et al. (2016) have explored how to develop test computational models of social in CPS learning environments. Their approach has been to classify the quality of collaboration from body movement and gestures of pair programmers working together. Drawing from the literature we can observe that MMLA has a role to play to support CSCL in project-based learning through looking at what types of multimodal interaction is relevant for understanding CPS. Additionally, opportunities exist for more investigation with MMLA to gain insights into CPS.
The work discussed in this paper is based on the European project Project-based Learning Analytics for Research and Support (PELARS1). One of the aims of the project is to develop learning analytics tools for
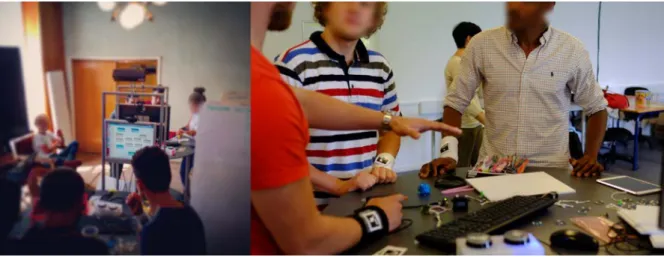
hands- on, open-ended STEM and STEAM learning activities using physical computing. The current system includes customised furniture with an integrated Learning Analytics System (LAS) such as tracking hands, faces and other objects and the Arduino platform with a visual web-based Integrated Development Environment (IDE) that captures interaction information of physical computing. The learners and observers use mobile devices to capture multimedia data (text, images, and video) to self-document the learning activities (Ruffaldi et al. 2016). See the system in action in Figure 1 below.
Figure 1. Different views of the PELARS system.
The PELARS LAS collects captures data streams from face and hand tracking, the ARDUINO IDE that includes hardware and software log-files, and audio levels that more fully explained in the next sections. Datasets
The data employed in this paper is based on 12 sessions of 3 students studying engineering at a European University (average age 20 years old with 17 and 1 woman). Each student group used the system over 3 days completing 3 open-ended tasks. The students were introduced to the system and then their task was to prototype an interactive toy. No specific instructions about the timing of the sessions were given to students. Each session required between 60 and 80 minutes for the students to complete the task.
Evaluation of CPS
The starting point of the automatic assessment is the expert coding of the students’ sessions based on video captured with the LAS. The coding scheme makes use of three levels (0, 1 and 2) to represent passive, semi-active and semi-active student states, one for each student of the team. The semi-active code (2) is used whenever a student's hand is active on an object; the semi-active code (1) is used when a student is not physically active but his head is directed towards a peer, or teacher, whatever is active. Finally, the passive code (0) is used if student’s hands are not physically active with any object and their head is directed away from the active position of the peers. The combination of the three codes of each student provides a synthetic representation of collaboration.
Students’ behaviours have been coded in 30-second windows. To validate the coding actions, two researchers applied this coding scheme to all video data. This procedure has been used as a way of testing the validity of the coding system generated. Where there was disagreement, the researchers discussed the data and revised their coding accordingly.
Figure 2. Students from left to right have a coding of 122 meaning that leftmost student is looking, and the other two are working together.
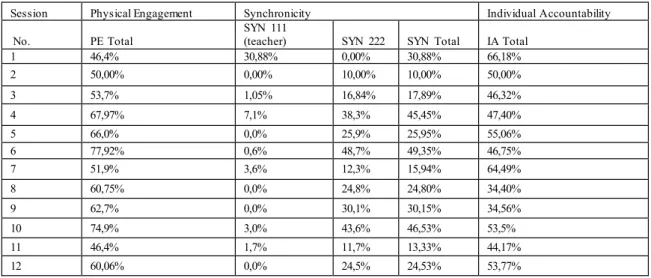
The per time-window coding has been used to compute three aggregate scores for the whole session based on the semantics of the encoding. Physical engagement is measured by the percentage of code 2 over the total. Synchronisation is measured by the combined percentage of 222 and 111 codes. These are the two situations in which all students are active or all semi-active. The 111 code corresponds to the specific case in which a facilitator or teacher enters the scene and the students are looking (semi-active) at him/her. Finally,
individual accountability has been measured by the total number of situations in which at least one student is looking at another student actively working: that is all the combinations of a 2 with two 1 code, and two 2 codes with one 1 code (e.g. 211, 221). These are the situations in which at least one student is paying attention to the physical actions of another student. Table 1 presents the summary of the CPS evaluation results based on this coding for the 12 sessions. Each score is presented as a percentage of the whole time.
Table 1: Researchers’ Coding of the student sessions with the three CPS scores as percentages of the total session duration
Session Physical Engagement Synchronicity Individual Accountability
No. PE Total SYN 111 (teacher) SYN 222 SYN Total IA Total
1 46,4% 30,88% 0,00% 30,88% 66,18% 2 50,00% 0,00% 10,00% 10,00% 50,00% 3 53,7% 1,05% 16,84% 17,89% 46,32% 4 67,97% 7,1% 38,3% 45,45% 47,40% 5 66,0% 0,0% 25,9% 25,95% 55,06% 6 77,92% 0,6% 48,7% 49,35% 46,75% 7 51,9% 3,6% 12,3% 15,94% 64,49% 8 60,75% 0,0% 24,8% 24,80% 34,40% 9 62,7% 0,0% 30,1% 30,15% 34,56% 10 74,9% 3,0% 43,6% 46,53% 53,5% 11 46,4% 1,7% 11,7% 13,33% 44,17% 12 60,06% 0,0% 24,5% 24,53% 53,77% Acquired data
For each of the sessions recorded, the LAS system collected data from the students comprising activity performed, user generated content (text and multimedia) and actions on the Arduino visual Integrated Development Environment (IDE). In particular, the following data has been acquired:
Face Tracking - Using a frontal camera and the Viola-Jones algorithm the face of students was tracked and thanks to camera calibration and assumptions about sizes it was possible to estimate the 3D position from the
camera. This means that the position of the face is computed in 3D coordinate. Two metrics have been identified: the first is the count of Faces Looking at the Screen (FLS), the second is the average between all the faces pairs providing an indicator called Distance between Learners (DBL). The measure DBL could be seen as a marker of collaboration obtained when DBL is a small value.
Hand Tracking - A top down camera, instead, monitored the motion of the hands of the students that were wearing fiducial markers that disambiguate each primary hand. Again, thanks to the calibration of the camera and the size of the markers the 3D pose of the hands was obtained. The resulting metrics were the Distance between Hands (DBH) and the Hand Motion Speed (HMS), respectively as the average distance between all the hands, and as the average motion speed.
Other Data collected but not analysed in this paper - The interface between the Arduino visual IDE and the data collection system provided information about the types of physical and software blocks used in the project and their connections. Audio Level - By means of the microphone included in one of the cameras and Fast Fourier Transformation (FFT) we compute the sound level during the session. The resulting feature is a value sampled at 2Hz called Audio Level (AUD).
Methods
This section presents how we approached investigating which multimodal features are good predictors for CPS for the PELARS LAS. Data pre-processing and data analysis methods are explored based on the coding scheme results. The hypotheses rest on creating a set of regressors (independent variables) of the CPS scores and testing how the different observed features affect the quality of the regressors. This approach provided information on sensors and measures that can be as strong predictors for collaboration in the group.
Preprocessing
Data has been collected at variable data rates (around 2 Hz) but without relative time offset of few seconds, and for this reason the pre-processing aggregates indicators from the different variables in large windows of same durations. The aggregation performed was based on counting for most of the variables, except for the distance/proximity functions for which we employed averaging, maximum and minimum. For taking into account the different durations of the sessions (average 63min, min 40, max 79min, std 15min). we employed zero padding for sessions that were too short. Additionally, the individual sessions where then broken down into three phases, planning, work, and reflection to help analyse the workflow of the student groups. Work phase lasted 42min in average, min 14, max 65, std 15. The overall recording time of 12.5 hours.
Additionally, these phases were coded by research observers during the sessions using the mobile component of the LAS (see Spikol et al., 2016). The data acquired by the PELARS LAS was exported from the server and then processed in Python using the sklearn toolkit2 that provided state of the art machine learning
techniques integrated with a common interface.
Fiducial markers were relatively reliable in positioning but they were subject to visual blockage. We considered the amount of time between marker presence greater than 2 seconds. This resulted visual occlusion in 65% of time in average during work phase (min 21%, max 94%, std 20%) in particular we are interested in the presence of all the three hands at once (every 20s in average, min 5s, max 33s, std 8s). Face tracking faces similar difficulties with an average of 55% of time in average during work phase (min 0%, max 97%, std 30%).
Machine learning
This initial approach was based on regression task that used as inputs the features and as output the coding based scores (PE, SYN, IA) with the purpose of identifying which are the input features that can support the CPS framework. Among the different families of regressors we opted for Linear Regression (LR), Bayesian Ridge Regression (BRR) and Support Vector Machine Regression (SVR). A Ridge regression introduces parameters for keeping the size of the weights small, while BRR performs a regression based on the Bayesian framework so that it is possible to better handle ill posed problems. Then we statistically modelled the effect features over the outcomes using a General Linear Model provided by the Python state-model package: we use the GLM because we have a large number of variables with possible non-trivial interactions. Indeed, some of the employed regressors were not linear.
Data obtained from the sensors have been standardized to improve the learning rate. When considering a global window only 8 features were available, then 24 for 1800s, 32 for 1200s and 64 for 600s. We have manually explored the feature selection process by backward processing.
We used cross-validation (k=4) for evaluation of the regression because due to the number of samples (12) the use of a leave-one-out scheme would bring to perfect regression. This means that 7 subjects were used for the training and 5 for testing. We compared the quality of the different regressors by using the R2 chi square metric, accepting regressions only in the range 0.1.
We also explored the effect of different parameters such as window size and the inclusion of different phases. Tested window sizes were 10,20 and 30 minutes (600,1200 and 1800 seconds), in addition to the case of one single window for the whole session. Such large window sizes allow to keep small the number of inputs to the regressor in comparison to the sample size. Fine-grained temporal analysis is discussed in the Next Steps section.
Results
Phase information is useful for differentiating the different moments of the sessions, and as from the visual inspection, there are large differences in behaviour between different phases. In particular, the regressors scored badly when considering the Reflect phase, while the Planning phase can be aggregated with the Work phase without major disruptions. Relying less on phases was a good strategy because it avoided the need for an automatic segmentation tool. Table 2 shows the conditions for which there is a reliable regression for the given data (R2 > 0.1), this means that PE Total never provided reliable regression, and only the listed windows were successful (e.g. no regression when using the whole window).
Table 2: Results of the Regression Analysis – Scores of R2 for features Hand Distance, Speed and Face Count. Only the reliable regressions are reported.
Window (s) SYN222 IA211
Linear 1200 0.28 0.17 Bayes Ridge 1200 0.28 - SVMR 1200 - - Linear 1800 0.48 - Bayes Ridge 1800 - - SVMR 1800 - -
The regression tests gave unsatisfactory results, so we proceeded with statistical modelling using Generalized Linear Models. And we obtained the following results for window of 1800 seconds:
• IA 222 has Hand Distance (Max and Min) as regresssor (with significance p < 0.05) • SYN Total has Hand Distance (Min) as regressor (with significance p < 0.05)
• SYN 111 has Face Count and Hand Distance (Min and Max) as regressor (with significance p < 0.05) If instead we look at the overall window duration, we obtain:
• PE level can be regressed by Hand Max Distance (significance p < 0.005)
Discussion
In this paper, we investigated what multimodal learning analytics features could be identified and used to support CSCL through the use of the PELARA LAS. Our primary aim was to identify the MMLA features that can be used to determine aspects of collaboration in project-based learning. The purpose of this work is to develop CSCL that can aid in the assessment of CPS and to determine how different MMLA interactions can be automated to support and understanding collaborative learning. As discussed by Blikstein and Worsley (2016) existing evidence about the effectiveness of constructivist learning activities including project-based learning is rare. These teaching and learning approaches are notoriously hard to be evaluated via standardised measurements due to open-ended and dynamic nature of their implementations. However, MMLA provides new methods and methodologies with relevant potentials to provide evidence about the impact of such teaching approaches. In this research study, we presented that where the students are looking, the distance between them, the motion of their hands our key features for a learning analytics system to be effectively used to identify collaboration in small groups of Engineering students. These results are significant for the CSCL community as a starting point to investigate further what features of MMLA can be used to support collaborative learning providing insights about the physical and embodied processes involved in hands-on learning and how.
Amount of occluded hand pose due to the orientation of the fiducial markers will require to approach the hand tracking in a different way with the aim of extracting hand pose directly from video without the use of
such fiducial markers. The distance in the video space will be sufficient. This operation can be applied on these same sessions for which we have collected the original video stream.
Starting from the results of this work we are moving toward the reduction of the window size down to the fine-grained coding of the sessions at 30-seconds intervals. This coding will allow to train a machine learning classifier to recognize, from the video recording and the other multimodal data, the 3-number coding. For this purpose, we employed a deep neural networks (DNN) that are composed of a long sequence of linear matrix multiplications followed by non-linear activation functions. This supervised learning approach will be important for automating the scoring of students’ session and providing assessment in the context of the CPS framework.
Conclusion
The PELARS project is limited to the context of the study engineering students performing an open-ended task about physical computing and the relatively small sample size currently make it hard to generalise. However, the finding show similar results to other findings in MMLA (Blikstein & Worsely 2016; Ochoa et al., 2013; Grover et al., 2016) that begin to show that physical aspect of collaborative is an important part of this type of learning and that learning analytics systems can identify features that are relevant for helping researchers, teachers, and learners unpack what is happening.
Several questions are raised about the PELARS LAS exploratory approach on the physicality of the learners, the log files of the hardware and software, and the user generated data without a deeper connection to the students’ conversation or an inquiry-like system to support the learning. However, the project and this paper have focused on the investigating other processes around face-to-face collaboration, which have can now be collected as demonstrated. Additionally, in classroom and lab contexts collection audio from learners provide new challenges for accurate audio processing (ASR) and the act of making things needs to be balanced with more traditional textual input. The next steps for the project are to explore how to integrate more user generated content from learning activities like virtual internships (Arastoopour & Shaffer, 2015) and how directional audio and automatic speech recognition could be utilised.
Endnotes
(1) http://pelars.eu/
(2) http://scikit-learn.org/stable/
References
Arastoopour, G., & Shaffer, D. W. (2015). Epistemography and Professional CSCL Environment Design. In International Conference on Computer Supported Collaborative Learning. Gothenberg, Sweden. Banks, F. and Barlex, D. (2014). Teaching STEM in the secondary school: Helping teachers meet the challenge.
Routledge.
Blikstein, P. and Worsley, M. (2016). Multimodal Learning Analytics and Education Data Mining: using computational technologies to measure complex learning tasks. Journal of Learning Analytics. Available at: http://epress.lib.uts.edu.au/journals/index.php/JLA/article/view/4383/5596.
Chen, L., Feng, G., Joe, J., Leong, C.W., Kitchen, C. and Lee, C.M. (2014). Towards Automated Assessment of Public Speaking Skills Using Multimodal Cues. In: Proceedings of the 16th International Conference on Multimodal Interaction - ICMI ’14. New York, New York, USA: ACM Press, pp. 200–203. Cukurova, M., Avramides, K., Spikol, D., Luckin, R. and Mavrikis, M. (2016). An analysis framework for
collaborative problem solving in practice-based learning activities: A mixed-method approach. In: Proceedings of the Sixth International Conference on Learning Analytics & Knowledge - LAK ’16. New York, New York, USA: ACM Press, pp. 84–88.
Damon, W. and Phelps, E. (1989). Critical distinctions among three approaches to peer education. International Journal of Educational Research 13(1), pp. 9–19.
Dillenbourg, P. 1999. What do you mean by collaborative learning? In: Dillenbourg, P. ed. Collaborative-learning: Cognitive and Computational Approaches. Oxford: Elsevier, pp. 1–19.
Dillenbourg, P., & Jermann, P. (2007). Designing integrative scripts. In Scripting Computer-supported Collaborative Learning. (pp. 275-301). Springer US.
Grover, S., Bienkowski, M., Tamrakar, A., Siddiquie, B., Salter, D. and Divakaran, A. (2016). Multimodal analytics to study collaborative problem solving in pair programming. In: Proceedings of the Sixth International Conference on Learning Analytics & Knowledge - LAK ’16. New York, New York, USA: ACM Press, pp. 516–517.
Halverson, E.R. and Sheridan, K. 2014. The Maker Movement in Education. In Harvard Educatioal Review 84(4), pp. 495–504.
Johnson, D. W., & Johnson, R. T. (2003). Assessing students in groups: Promoting group responsibility and individual accountability. Corwin Press.
Kirschner, P.A., Sweller, J. and Clark, R.E. (2006). Why Minimal Guidance During Instruction Does Not Work: An Analysis of the Failure of Constructivist, Discovery, Problem-Based, Experiential, and Inquiry-Based Teaching. Educational Psychology 41(2), pp. 75–86.
Klahr, D. and Nigam, M. 2004. The equivalence of learning paths in early science instruction: effect of direct instruction and discovery learning. Psychological Science 15(10), pp. 661–667.
Kotsiantis, S., Kiriakos Patriarcheas, and M. Xenos. (2010). "A combinational incremental ensemble of classifiers as a technique for predicting students’ performance in distance education." Knowledge-Based Systems 23(6). pp. 529--535.
Lakens, D., & Stel, M. (2011). If they move in sync, they must feel in sync: Movement synchrony leads to attributions of rapport and entitativity. Social Cognition, 29(1), 1-14.
Luckin, R. (2010). Re-designing Learning Contexts: Technology-Rich, Learner-Centred Ecologies. London: Routledge.
Ochoa, X., Chiluiza, K., Méndez, G., Luzardo, G., Guamán, B. and Castells, J. (2013). Expertise estimation based on simple multimodal features. In: Proceedings of the 15th ACM on International conference on multimodal interaction - ICMI ’13. New York, New York, USA: ACM Press, pp. 583–590.
Xavier Ochoa, Marcelo Worsley, Katherine Chiluiza, and Saturnino Luz. (2014. MLA'14: Third Multimodal Learning Analytics Workshop and Grand Challenges. In Proceedings of the 16th International Conference on Multimodal Interaction (ICMI '14). ACM, New York, NY, USA, 531-532. DOI: http://dx.doi.org/10.1145/2663204.2668318
OECD (2015). PISA Draft Collaborative Problem Solving Framework 2015. Available at: http://f1000.com/work/item/2523209/resources/1902358/pdf.
Spikol, D., Avramides, K., & Cukurova, M. (2016). Exploring the interplay between human and machine annotated multimodal learning analytics in hands-on STEM activities. In Proceedings of the Sixth International Conference on Learning Analytics & Knowledge - LAK ’16 (pp. 522–523). New York, New York, USA: ACM Press. http://doi.org/10.1145/2883851.2883920
Raca, M., Tormey, R., & Dillenbourg, P. (2014). Sleepers' lag-study on motion and attention. In Proceedings of the Fourth International Conference on Learning Analytics And Knowledge LAK’14 (pp. 36-43). ACM.
Ruffaldi, E., Dabisias, G., Landolfi, L. and Spikol, D. (2016) . Data collection and processing for a multimodal learning analytic system. In: 2016 SAI Computing Conference (SAI). IEEE, pp. 858–863.
Schneider, B., & Blikstein, P. (2015). Unraveling students' interaction around a tangible interface using multimodal learning analytics. Journal of Educational Data Mining, 7(3). Pp. 89-116.
Schneider, B., & Pea, R. (2013). Real-time mutual gaze perception enhances collaborative learning and collaboration quality. International Journal of Computer-Supported Collaborative Learning, 8(4), 375-397.
Sharma, K., Jermann, P., & Dillenbourg, P. (2014). “With-me-ness”: A gaze-measure for students’ attention in MOOCs. In International conference of the learning sciences (No. EPFL-CONF-201918).
Springer, L., Stanne, M. E., & Donovan, S. S. (1999). Effects of small-group learning on undergraduates in science, mathematics, engineering, and technology: A meta-analysis. Review of educational research, 69(1), 21-51.
Wiltermuth, S. S., & Heath, C. (2009). Synchrony and cooperation. Psychological science, 20(1), 1-5.
Worsley, M. and Blikstein, P. (2014). Analyzing Engineering Design through the Lens of Computation. Journal of Learning Analytics 1(2), pp. 151–186.
Acknowledgments
We would like to thank all the teachers, students and facilitators involved in the data collection of this research study. This work was funded by European Commission, FP7Technology Enhanced Learning (GA No. 619738).