Procedia - Social and Behavioral Sciences 176 ( 2015 ) 52 – 59
1877-0428 © 2015 The Authors. Published by Elsevier Ltd. This is an open access article under the CC BY-NC-ND license (http://creativecommons.org/licenses/by-nc-nd/4.0/).
Peer-review under responsibility of the Sakarya University. doi: 10.1016/j.sbspro.2015.01.443
ScienceDirect
IETC 2014
Scientific visualizations based on integrated model of text and
picture comprehension via eye-tracking
Azam Majooni
a, Mona Masood
a*, Amir Akhavan
baCentre for Instructional Technology and Multimedia, Universiti Sains Malaysia, Malaysia bSchool of Computer Sciences, Universiti Sains Malaysia, Malaysia
Abstract
This study investigates the “color combination effect” and the “sequence of pictures and text effect” in the “Integrated Model of Text and Picture Comprehension” (ITPC) on the formation of the mental model and cognitive load in both desktop and mobile devices. These effects are studied using an experiment including scientific contexts with specific color combinations and different picture and text sequences. The participants of this experiment are graduate students from different fields of science in Universiti Sains Malaysia. Four tasks are assigned for each participant in each phase and every task includes a scientific context accompanied with visualization. After each task the participant is asked to answer a set of questions related to the context. Eye-tracking methods are adopted to record gaze data of the participants while reading each context. Analysis of the gaze data and the percentage of the correct answers to the questions indicate that the sequence of picture and text and use of color in the visualizations results in reduction of the cognitive load of the participants.
© 2015 The Authors. Published by Elsevier Ltd.
Selection and peer-review under responsibility of The Association of Science, Education and Technology-TASET, Sakarya University, Turkey.
Keywords: eye tracking; picture-text sequence; visualization; cognitive load
1. Introduction
The main intention of information visualization is to provide insight about the information in order to solve some prominent problems such as information overload and misinterpretation of data. Several empirical studies have shown the superiority of the visual representations versus the sequences of verbal representations in different tasks such as trend recognition and relation illustration. In the Integrated Model of Text and Picture Comprehension (ITPC), developed by Schnotz, it is claimed that formation of the comprehension of text and visuals are considered as active processes of “coherence formation”, but at the same time it mentions that combination of textual and visual data should be implemented carefully, as it might cause interference in
* Mona Masood. Tel.: +6012 423 2559; fax: +604 657 6749. E-mail address: [email protected].
© 2015 The Authors. Published by Elsevier Ltd. This is an open access article under the CC BY-NC-ND license (http://creativecommons.org/licenses/by-nc-nd/4.0/).
the learning of the users because of inappropriate graphics (Schnotz & Kürschner, 2007). In the scientific domains, information visualization is used extensively to provide better representation for the verbal contents (Börner, Chen, & Boyack, 2005; Ware, 2012). The terms, “better representation” is not a precise explanation and there exist a demand for a more explicit comparison parameter to describe the quality and effectiveness of the visualization (Few, n.d. pp.24-26). In order to achieve a general instruction in this study, effect of the parameters, color and the sequence of pictures and text in the formation of the mental model is studied. To provide a comparison between desktop and mobile devices the experiment is conducted on both mediums as nowadays, millions of people use mobile devices for different tasks such as browsing the Internet, reading email, books, blogs and even scientific papers (Maurer, Hausen, De Luca, & Hussmann, 2010). The participants of this experiment are graduate students from different fields of science at Universiti Sains Malaysia. The first phase of the experiment studies the “Picture-text sequencing effect” and “Color combination effect” in scientific contexts containing visualizations on the desktop computer. At the same time the participants are asked to read four short scientific contexts and their gaze data is collected using the eye-tracking devices. Also participant’s comprehension from the context is evaluated using a set of questions at the end of each context. The second phase of the experiment aims to study the “Picture-text sequencing effect” and “Color combination effect” on the mobile devices of small and medium-sized screen. In the second phase, the steps of the first phase are repeated on the mobile devices and likewise the gaze data and the answers to the questions are collected and analyzed. In the final phase the participants are asked to complete the Felder-Silverman learning style model test in order to identify preferred learning style of the participants.
1.1. Related work
In the past decades, a great amount of research has shown that the combination of text and picture provides better learning compared to text only and picture only situations (Anglin, 2004; Fletcher & Tobias, 2005). Several research also is conducted to answer this question that if the text and picture appear in sequence, which model would be more effective. Some of these studies have provided experiments, to study the effect of picture and text sequencing (Canham & Hegarty, 2010; Eitel, Scheiter, Schüler, Nyström, & Holmqvist, 2013; McCrudden, Magliano, & Schraw, 2011; Shaw, Nihalani, Mayrath, & Robinson, 2012). The results of the conducted experiments varies for each study, meaning that some of the experiments concluded in the effectiveness of picture before text sequence (Borges & Robins, 1980; Dean & Enemoh, 1983; McCrudden et al., 2011; McCrudden, Schraw, & Lehman, 2007; Salmerón, Baccino, Cañas, Madrid, & Fajardo, 2009; Ullrich, 2007), and also almost equally a big body of research have achieved positive results on behalf of the text before picture or text only model (Bransford & Bransford, 1972; Canham & Hegarty, 2010; O’Keefe & Solman, 1987; Robinson, Katayama, Dubois, & Devaney, 1998; Robinson & Kiewra, 1995; Simmons, Griffin, & Kameenui, 1988). The Picture-text sequencing effect mentioned in the ITPC model, claims that the presentation of the picture before text, provides the mind preliminary visual information that helps with the creation of the mental model (Schnotz & Kürschner, 2007).
1.2. Picture and text sequencing effect on desktop and mobile devices
This study is important because, it investigates effect of picture and text sequencing on both the desktop and mobile devices side by side, while examining the influence of color on it. The effect of picture and text sequencing on mobile devices can be of more importance, as the screen size of the mobile devices are generally smaller than the desktop computers; which in this case when the picture is accompanied by text (or vice versa), the content producer is limited in the display size, thus there is no other way but to present picture and text in a sequential format.
2. Experiment
This study aims to determine the effect of color combination and image/text sequencing on the
mobiles devices. In order to investigate the effect of these variables, an experiment is designed with two parts including four tasks to examine the cognitive load of the students using the desktop monitor and a mobile device.
2.1. Participants
Participants of this study are 10 third year Universiti Sains Malaysia postgraduates with a science background aged between 29 to 35 years old. The participants are assured that their test results would be anonymous and their score will not be disclosed. The participants are divided into 2 groups, each group with eight similar texts but different sequence of picture and text.
2.2. Apparatus
In this experiment, the main goal was to investigate the cognitive load, of the participant in the picture first, followed by text and then text first followed by picture, on both desktop and mobile devices. In order to achieve this goal, Gaze data was collected using SMI Red, remote eye-tracking device in the desktop based tasks and SMI eye-tracking glasses (ETG) for the mobile device based tasks. The calibration of the devices are renewed after each task and the participants are asked to answer a set of questions related to the tasks.
After completing the tasks the participants are given the Felder-Silverman learning style questionnaire, to determine if they are visual or verbal learners.
2.3. Materials
Material used in this experiment, are eight simple passages which provides description on the results of the survey conducted on the academic databases. The length of each passage is between 150 to 210 words and the readability score for each of the passages is calculated using the readability formula (Kincaid, Fishburne Jr, Rogers, & Chissom, 1975) and the mean of the readability score is 14.2 with below 10% standard deviation. The material is accompanied with diagrams related to the context.
2.4. Procedure
The participants, initially are informed that they would read four tasks which include a short passage with a picture before or after the passage, on desktop computer and four tasks on mobile device and after each task they will answer a few questions related to each task.
The experiment includes three major sections:
(a) Reading tasks with questions on the desktop with remote eye-tracking device (RED):
Four reading tasks are assigned for each participant and after each task participants are asked to answer a set of questions about the context and their gaze data are recorded using the remote eye-tracking devices.
(b) Reading tasks with questions on the mobile devices with eye-tracking glasses (ETG):
The same procedures in step (a) are implemented, except this time the tasks and the questions are provided using small and medium-size screen devices and their gaze data are recorded using eye-tracking glasses.
(c) Felder-Silverman learning style model test:
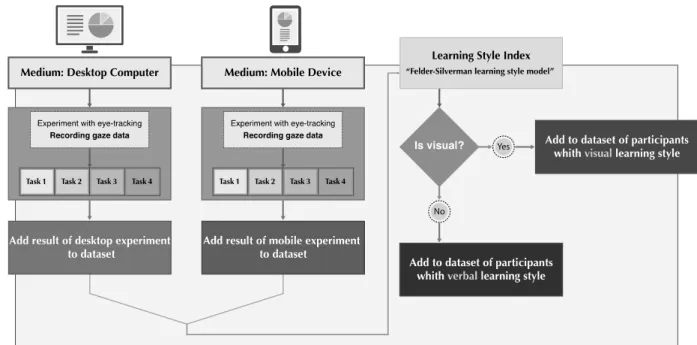
In the final step, the participants are asked to answer 44 questions of the “Felder-Silverman learning style model” to identify their Learning Style Index (LSI) for further analysis. Fig. 1 demonstrates the schematic process of the experiment.
Fig 1. Schematic process of the experiment 3. Results
The collected information from the experiment can be divided into four categories:
x Scores of the questions about the context on the desktop and mobile device
x Eye-tracking results of the experiment on the context on the desktop
x Eye-tracking results of the experiment on the context on the mobile device
x Results of the Learning Style Index test
The analysis of the collected information is completed in three steps, firstly, the learning style of the participants is identified and the attributes of the visual/verbal learner are added to the database of the collected information. In the second phase, the mean score of the questions for all the participants for each test is calculated. Later the mean results for each group of visual and verbal learners are also calculated separately. Then the gaze data are plotted using the heat map and the scan path visualization methods to investigate the fixations and movement sequence of the eyes collected by the eye-tracking devices.
3.1. Gaze data
For further analysis, the scores and gaze data collected from the desktop and mobile devices are clustered and the results are analysed using classification method. The eye-tracking data provides information about the time needed for the participant to read and recognize each part of the context. It can also help estimate the cognitive load of the participant while going through the context. The collected eye tracking data are usually visualized either by heat map and scan path or by analysing the number and duration of the fixation on an Area of Interest (AOI) or POI. However the other eye tracking parameters such as blinking, pupil size variation and length of the saccades, ratio of fixations, are also very important parameters (Bixler & D’Mello, 2014). In this study, the parameters for each task and for each participant are put into a matrix of the eye tracking data, and 50% of all the features are recorded in this matrix are used for training the model using a supervised learning method. In the next step, the rest of the records are used for testing the hypothesis on the effectiveness of picture-text sequencing model.
3.2. Collected data on the experiment
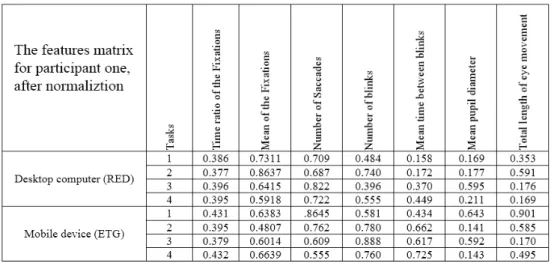
The analysis of the results are completed using a method based on the records of the fixation, saccades, blinks and pupil size on two large AOIs. In order to investigate the relation of the cognitive load and gaze data in a quantitative manner, all the eye tracking data are summarized into 7 features and 2 matrices. This matrix of gaze data contains: (1) Time ratio of the Fixations, (2) Mean of the Fixations, (3) Number of Saccades, (4) Number of blinks, (5) Mean time between blinks, (6) Mean pupil diameter, and (7) Total length of eye movement. The results of the answers to the questions are used as the classifier attribute for the training step, and then this attribute is again used for testing the model. The ZeroR classifier in the WEKA data mining toolkit (Hall et al., 2009) is used for the training and testing. In this process, 50% of the participant’s data (attribute matrices) are selected randomly for training purpose, 10% for validation and 40% for testing.
3.3. Normalization of the data
The data in the matrices for each participant are not all in one range, as each attribute represents one different feature, also physical characteristics (such as pupil diameter) vary for each participant, which leads to a bias in the modeling. In order to avoid this, the data inside the matrices are all normalized using a common method of normalization (in this case Hyperbolic Tangent function) therefore all the parameters will have values in the same range of 0 and 1. Fig. 2 is the matrix of the normalized features for participant one from group one.
Fig 2. The features matrix for participant one after normalization for modelling 3.4. Results of the questions
The participants are asked to answer questions related to the context in each task, and the results of these questions are used as a measure of the understanding of the participants from the context. The mean of the results for all the participants is presented in Table 1 and Table 2. Although the number of participants was not too many, the results provide clues about the effectiveness of the use of color. Also, better results are achieved in the Picture first cases compared to the Text first cases, which supports the ITPC theory.
Table 1. Results of the questions on Mobile device (Mean results of Groups 1 and 2)
Group 1 Group 2
Context Colored Black and White Colored Black and White
Picture first 90% 80% 80% 80%
Table 2. Results of the questions on Desktop computer (Mean results of Groups 1 and 2)
Group 1 Group 2
Colored Black and White Colored Black and White
Picture first 90% 70% 85% 73%
Text First 67% 65% 75% 67%
3.5. Analysis of the pupillary response
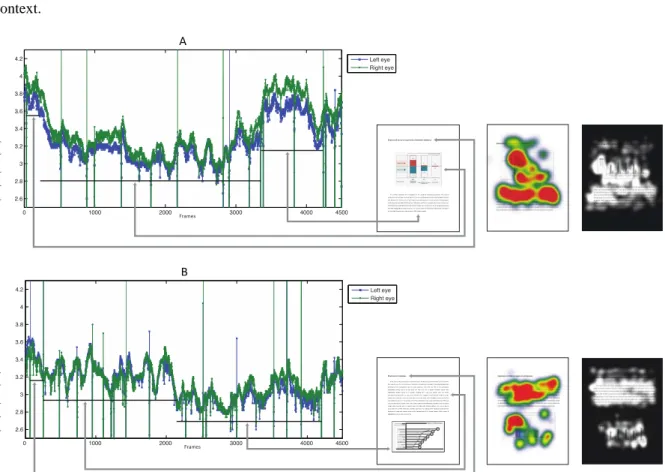
According to Klingner, Kumar, and Hanrahan (2008), pupil diameter increases with the difficulty of the context. In this experiment, the pupil data for each of the participants, for each task on two main AOIs are collected and analyzed, the Fig 3 demonstrates changes of the pupil size while the participant is reading the context.
Fig 3. (a) the pupil diameter increases while reading the text and (b) during the process of reading pupil diameter is higher than while gazing at the figure
3.6. Analysis and classification
A parameter, representing the cognitive load is presented in this section which represents the cognitive load score (CLS). This parameter, is achieved by normalizing the maximum score of the parameters monitoring the cognitive load (number of blinking, size of pupil and fixation). In other words, values of the eye tracking features while watching a black space and while trying to read and understand a difficult section of the tasks is scored (between 0% and 100%). The mean value of the all features are tested using the model
and the similarity factor is considered as the mean cognitive load for the tested tasks. Table 3 shows the results of the analysis.
The results of the cognitive load score, reflects the difficulty of the contexts for all the participants (Table 3), the scores suggests that, sequence of picture before text, can reduce the mean of the cognitive load. Also the mean of CLS in the contexts with colored figures is noticeably lower than the contexts with black and white figures.
Table 3. Mean cognitive load score from testing of the model trained by 50% of the participants
Device Tasks Cognitive load score Tasks Cognitive load score
Mobile device Picture first, Colored 69% Picture first, B/W 67% Text first, Colored figures 74% Text first, B/W 81% Desktop computer Picture first, Colored 59% Picture first, B/W 65% Text first, Colored figures 70% Text first, B/W 78%
4. Discussion
In this work, the effect of the color and the sequence of picture and text in the formation of the mental model and cognitive load is investigated for both the desktop and mobile device. The results support the Integrated Model of Text and Picture Comprehension on the effect of the sequence of the picture and text in both mobile devices and desktop computers. Also the results confirm the positive effect of color in the reduction of cognitive load in all the cases. Results of the Felder-Silverman test, provided that 75% of the participants were visual learners and 25% verbal learners. Nevertheless, in this experiment both verbal and visual participants had better scores on the picture first tasks.
5. Conclusion
The effect of sequence of pictures and text in the cognition load and the formation of the mental model in the scientific contexts in the Integrated Model of Text and Picture Comprehension is a rarely investigated issue and in this experiment, the authors try to conduct an analysis regarding this effect on both the desktop and mobile devices. The contribution of this study is both on the investigation of the theory and also technically analyzing the effect of using mobile devices versus desktop computers.
Acknowledgements
This research is supported by the Center for Instructional Technology and Multimedia and the Research University Grant awarded by Universiti Sains Malaysia.
References
Anglin, G. (2004). Visual representations and learning: The role of static and animated graphics. Handbook of Research on Educational Communications and Technology,2, 865–916.
Borges, m. a., & Robins, s. l. (1980). Contextual and motivational cue effects on the comprehension and recall of prose. Psychological Reports,47(1), 263–268. doi:10.2466/pr0.1980.47.1.263
Börner, K., Chen, C., & Boyack, K. W. (2005). Visualizing knowledge domains. Annual Review of Information Science and Technology, 37(1), 179–255. doi:10.1002/aris.1440370106
Bransford, J. D., & Bransford, M. K. (1972). Contextual prerequisites for understanding: Some investigations of comprehension and recall. Journal of Verbal Learning and Verbal Behavior,11(6), 717–726. doi:10.1016/S0022-5371(72)80006-9
Canham, M., & Hegarty, M. (2010). Effects of knowledge and display design on comprehension of complex graphics. Learning and Instruction,20(2), 155–166. doi:10.1016/j.learninstruc.2009.02.014
Dean, R. S., & Enemoh, P. A. C. (1983). Pictorial organization in prose learning. Contemporary Educational Psychology,8(1), 20–27. doi:10.1016/0361-476X(83)90031-0
Eitel, A., Scheiter, K., Schüler, A., Nyström, M., & Holmqvist, K. (2013). How a picture facilitates the process of learning from text: Evidence for scaffolding. Learning and Instruction,28, 48–63. doi:10.1016/j.learninstruc.2013.05.002
Few, S. (n.d.). Information Dashboard Design: The Effective Visual Communication of Data, 2006.O’Reilly Pub. Fletcher, J., & Tobias, S. (2005). The multimedia principle. The Cambridge Handbook of Multimedia Learning,117, 133.
Hall, M., Frank, E., Holmes, G., Pfahringer, B., Reutemann, P., & Witten, I. H. (2009). The WEKA data mining software. ACM SIGKDD Explorations Newsletter,11(1), 10. doi:10.1145/1656274.1656278
Kincaid, J. P., Fishburne Jr, R. P., Rogers, R. L., & Chissom, B. S. (1975). Derivation of new readability formulas (automated readability index, fog count and flesch reading ease formula) for navy enlisted personnel.
Klingner, J., Kumar, R., & Hanrahan, P. (2008). Measuring the task-evoked pupillary response with a remote eye tracker. In Proceedings of the 2008 Symposium on Eye Tracking Research & Applications, ACM.
Maurer, M., Hausen, D., De Luca, A., & Hussmann, H. (2010). Mobile or desktop websites? In Proceedings of the 6th Nordic Conference on Human-Computer Interaction Extending Boundaries - NordiCHI ’10 (p. 739). New York, New York, USA: ACM Press. doi:10.1145/1868914.1869018
McCrudden, M. T., Magliano, J. P., & Schraw, G. (2011). The Effect of Diagrams on Online Reading Processes and Memory. Discourse Processes,48(2), 69–92. doi:10.1080/01638531003694561
McCrudden, M. T., Schraw, G., & Lehman, S. (2007). The use of adjunct displays to facilitate comprehension of causal relationships in expository text. Instructional Science,37(1), 65–86. doi:10.1007/s11251-007-9036-3
O’Keefe, E., & Solman, R. (1987). The influence of illustrations on children’s comprehension of written stories. Journal of Literacy Research,19(4), 353–377. doi:10.1080/10862968709547611
Robinson, D. H., Katayama, A. D., Dubois, N. F., & Devaney, T. (1998). Interactive Effects of Graphic Organizers and Delayed Review on Concept Application. The Journal of Experimental Education,67(1), 17–31. doi:10.1080/00220979809598342
Robinson, D. H., & Kiewra, K. a. (1995). Visual argument: Graphic organizers are superior to outlines in improving learning from text. Journal of Educational Psychology,87(3), 455–467. doi:10.1037//0022-0663.87.3.455
Salmerón, L., Baccino, T., Cañas, J. J., Madrid, R. I., & Fajardo, I. (2009). Do graphical overviews facilitate or hinder comprehension in hypertext? Computers & Education,53(4), 1308–1319. doi:10.1016/j.compedu.2009.06.013
Schnotz, W., & Kürschner, C. (2007). External and internal representations in the acquisition and use of knowledge: visualization effects on mental model construction. Instructional Science,36(3), 175–190. doi:10.1007/s11251-007-9029-2
Shaw, S., Nihalani, P., Mayrath, M., & Robinson, D. H. (2012). Graphic organizers or graphic overviews? Presentation order effects with computer-based text. Educational Technology Research and Development,60(5), 807–820. doi:10.1007/s11423-012-9257-2 Simmons, D., Griffin, C., & Kameenui, E. (1988). Effects of teacher-constructed pre-and post-graphic organizer instruction on
sixth-grade science students’ comprehension and recall. The Journal of Educational Research,82(1), 15–21. Ullrich, M. (2007). Einflüsse der Verarbeitungsreihenfolge auf den Wissenserwerb mit Texten und Bildern. Ware, C. (2012). Information visualization: perception for design. Morgan Kaufmann.