A Case Study on Cross-Platform Development
Frameworks for Mobile Applications and UX
Esteban Angulo
DLSllS - ETSI lnformaticos Universidad Politecnica de MadridCampus de Montegancedo s/n E-28660 - Boadilla del Monte (Madrid)
[email protected]
ABSTRACT
Cross-platform development frameworks for mobile applications promise important advantages in cost cuttings and easy maintenance, posing as a very good option for organizations interested in the design of mobile applications for several platforms. Given that platform conventions are especially important for the User eXperience (UX) of mobile applications, the usage of a framework where the same code defines the behavior of the app in different platforms could have a negative impact in the UX. This paper describes a study where two independent teams have designed two different versions of a mobile application, one using a framework that generates Android and iOS versions automatically, and another team using native tools. The alternative versions for each platform have been evaluated with 37 users with a combination of a laboratory usability test and a longitudinal study. The results show that differences are minimal in the Android platform, but in iOS, even if a reasonably good UX can be obtained with the usage of this framework by an DX-conscious design team, a higher level of UX can be obtained directly developing with a native tool.
1. INTRODUCTION
In recent years, the growth and usage of smartphones and mobile devices has changed the communication habits of the population and the development of mobile applications is supporting their daily life activities. There are over a million apps (for mobile applications) available to download in the Apple's App Store for iOS devices alone [2], so competition is fierce to get users' interest and loyalty in the app market. In this scenario, UX is the key differentiator [13].
The market offers a great vanat10n of mobile devices and platforms, and the challenge for development teams is being able to create mobile applications that can be used and run seamlessly on different devices and platforms. In order to cover all these potential markets, specific versions of the application need to be developed for each target platform.
Xavier Ferre
DLSllS - ETSI lnformaticos Universidad Politecnica de MadridCampus de Montegancedo s/n E-28660 - Boadilla del Monte (Madrid)
[email protected]
Cross-platform development frameworks offer a way of saving resources in the aim of covering different platforms. Madaudo et al. highlight that these tools provide developers the flexibility to create an app than runs across several mobile platforms based on the ideal principle of "write-once-run-everywhere" [15]. According to Humayoun et al., plenty of frameworks for mobile cross-platform development have been released in the last few years to deliver overall cost-effective and better solutions [12]. The advantages of these tools for software development organizations include the potential to: reuse developer skills; share codebases; synchronize releases; and reduce support costs. As stated in the IDC market forecast, Android and iOS together cover the 92.2% of the 2013 smartphone market share [14]. Therefore, for an organization choosing to develop only for two platforms, Android and iOS would be the best choice in order to aim for the biggest user base. We have chosen these two platforms for this study.
Each mobile platform has its own style for how the interaction between the user and the application happens, defined in its specific UI (User Interface) design guidelines [10] [3], and through informal platform conventions. Thus, the user experience for Android and iOS devices is different [9]. App designers need to take into account the particular flavor or interaction for iOS or Android in order to design the app consistent with standard/typical interaction strategies in each platform. This is emphasized by design recommendations for app designers to follow platform consistency [7], valid also for any kind of handheld devices expressed as "conform to platform conventions"
[11]. When an app is designed following platform standards and usual interaction strategies, users will be able to build on their previous app usage experience, therefore improving their learning curve and their overall satisfaction.
Given this state of affairs, what happens when using a cross platform development framework with the differences in terms of interaction design between platforms? From a UX point of view, we would expect that these frameworks would take this into account, but to which extent? Our hypothesis is that a design team opting for the usage of a framework will obtain an impoverished UX in the final product, even if they have an appropriate HCI background and there is a focus on UX in the interaction design efforts. The objective of this work is to explore this hypothesis
and surrounding questions, by studying how the usage of a cross platform development framework affects the UX in terms of consistency with platform-specific standards and conventions. The rest of this paper is structured as follows: next section explores UX considerations for cross-platform development and the usage of cross-platform development frameworks. Section 3 is dedicated to the selection of one of these frameworks. Section 4 describes the methodological approach for the study carried out, and section 5 details the results. These results are discussed in section 6, and, finally, conclusions are gathered in section 7.
2. CROSS-PLATFORM DEVELOPMENT, UX AND DEVELOPMENT FRAMEWORKS
According to David [8], the mobile user experience is totally different from the one in traditional desktop applications, due to the differences in screen size, portrait/landscape and input devices, among others. This is also true when considering the design of a mobile app to be developed for multiple platforms, since Uis must look and behave like other apps in the same platform [11]. While for desktop applications the issue of respecting platform conventions in cross-platform development is of lesser importance, in mobile app development it is a key aspect. Having a look to how Facebook, Twitter and WhatsApp, companies with millions of users for their apps, have taken into account the interaction design of their Android vs. iOS 2013 versions, we see three different strategies [5]: Facebook has chosen to develop the same interaction design over the two platforms, disregarding some platform conventions; WhatsApp has chosen to elaborate a different design for each platform, highly compliant with platform standards; and Twitter has taken a middle road considering an adapted cross-platform design, where the two versions share the same basic design and a compromise has been made by considering only common characteristics in both platforms, while maintaining a high consistency with platform conventions.
In the first approach (cross-platform same design) using a cross platform development framework delivers very good results in terms of savings of development resources, since it automatically delivers the same UI for both platforms; nevertheless, there is a high risk of providing a UX that will depart from user expectations.
In the second approach (different design for each platform), the
UX is maximized, but the development effort is directed to the development of separated native versions. In this case, opting for a cross-platform framework would require a lot of tweaking in order to cater for all the differences between platforms, reducing the advantages that these tools provide.
In the case of opting for an adapted cross-platform design, the ideal from a UI designer point of view would be that cross platform development tools took care of the main differences in platform conventions and standards, to require only minimal tweaking to obtain a high level UX.
The decision to use a cross-platform development framework or developing native code directly is not an easy one. Madaudo et al. [15] compare both approaches, stating that native apps provide better UX, by means of more fluid and responsive Uis, because cross-platform frameworks may not offer access to the full device APis (Application Programming Interfaces). Their work is just a position paper based on the experience of the authors, without experimental validation.
Humayoun et al. [12] evaluate three cross-platform frameworks with the development of three apps where the interaction is based in touch events (including gestures) and they access the device hardware (such as the accelerometer or the camera). Not all three apps were developed with the three frameworks. From an interaction point of view, the three apps are quite basic in terms of navigation, since they just have one or two screens, despite being navigation one of the main differences in interaction style between platforms. The authors also performed a user evaluation study in a controlled environment with 9 users, of which 3 were Android expert users, and 3 were iOS expert users. Test participants were asked to evaluate app response time and to grade their satisfaction in a 1-5 scale; and the results show a higher user preference for the native versions, but in two of the three scenarios with little difference. The results of this work are interesting as a first approximation to the problem at hand, but they are difficult to extrapolate to more complex applications, because the case studies considered are very basic applications, and the number of participants in the study who are platform experts is reduced (just 6).
3. FRAMEWORK SELECTION
Our starting point for studying the possible limitations of cross platform development frameworks in terms of UX of the developed apps was to select the best one from a mobile UX point of view.
At the beginning we found 19 options of cross-platform framework. We have discarded frameworks for specialized domains, like gaming, and we have considered the following available cross-platform development frameworks, organized according to Banerjee's classification of cross-platform frameworks [4]:
Mobile Web (combination of HTML5, JavaScript and CSS): jQuery Mobile, Sencha Touch.
App Generator (specific language to code but the deployment is done as native applications of the different platforms): Titanium Appcelerator, RhoMobile, Xamarin Mono, MoSync.
Hybrid App (platform-specific shell application that renders prepackaged HTML pages extending them through APis to access non-HTML features): PhoneGap, Intel XDK.
We studied the information available for each framework, considering the following criteria:
To offer support for Android and iOS native app development, to be able to compete with directly developed native apps.
To be based in a well-known programming language, to ease adoption by developers.
Free availability.
To include its own IDE (Integrated Development Environment) or to be compatible with widespread IDEs, to ease development.
To offer access to device APis, to be able to offer the same level of functionality than native code.
To have a high use rate among developers.
After analyzing the characteristics and properties of the eight candidates, only the following three tools complied with all the requirements: Titanium Appcelerator, PhoneGap and Intel XDK. These three tools were evaluated with a case study, consisting on an app to show the bus timetable for a campus, in order to base
the evaluation in hands-on experience with each framework. The test app interaction design included several screens, so that to be able to evaluate how each framework deals with navigation issues. While developing the test app with each one of the three frameworks, we evaluated both the tool advantages for the developer and how well it produced an interaction design in concordance with Android and iOS conventions.
The three tools offered a good perspective of usage for developers, excelling Titanium Appcelerator and Phonegap in this respect. Titanium Appcelerator (referred as Titanium in the rest of the paper) was finally chosen because it adapts the UI for the generated apps to some differences between Android and iOS UI guidelines. Titanium offers this differentiated behavior in the code generated for each platform automatically. For example, the tab bar: On iOS the tab bar always appears at the bottom edge of the screen [3]; alternatively, tabs on Android are placed on a Top Bar, just below the Action Bar in the top part of the screen [10]. We consider Titanium the best choice between freely available cross platform development frameworks for the development of mobile apps, in the case where attaining a good UX is a relevant project objective.
All the details of the framework selection study are in [I].
4. EVALUATION METHODOLOGY
The study designed for evaluating the impact of using a framework into the UX was based in having two design teams working independently: one team designing the Titanium version, and the other one working on the two native versions. One graduate student developed the Titanium version, and three undergraduate students developed the native Android and iOS versions. Members of the two teams had followed a course on HCI (Human-Computer Interaction), usability and UX in their respective degrees, and each team had a responsible of the usability of the developed apps who had excelled in the grading of the HCI course.
The design efforts of both teams are based on a common user and task analysis, part of the UCD (User-Centered Design) process followed. Usability testing with 14 representative users was carried out with a first prototype for each one of the three versions, and the apps were redesigned according to the test results. This UCD approach, along with the HCI expertise in both teams, ensures that the app versions used for this study had a good usability level.
4.1
Prototype description
The application used as a case study is a real app under development. It is meant for students to access to university information that is needed on the fly, including professors' contact data, information about subjects, and bus timetables. In the above mentioned usability test carried out with the first prototype of the app, we obtained that the app was already useful at such stage, given the feedback provided through satisfaction questionnaires. The second prototype (the one used for this research study) has more than 15 different screens in every one of the three versions (Titanium, native Android, and native iOS). The information displayed is obtained via web services offered by university servers, and it includes accessing device location services, thus consisting on a full-scale app.
The app includes a bulleting board for news and events in the school; information about transport in Campus, a directory of personnel, and information about degrees and courses.
Regarding performance, the Titanium versions generated for Android and iOS worked smoothly on both platforms, with similar performance to the native versions in terms of response times. In the usage of Titanium, however, it was necessary to make some adaptations for certain behaviors to be adapted to both platforms. That is, platform-specific code was included to use certain properties and events that were not present in both platforms.
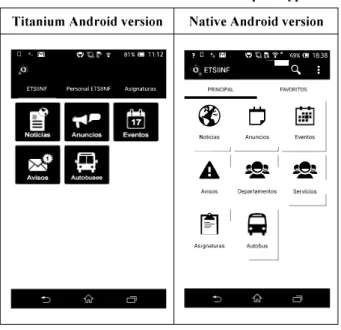
Table I and Table 2 show the screenshots of the home screen for the two different versions of each prototype (iOS and Android), where it can be appreciated that design differs between versions, as for example in the location of the directory of personnel: as part of the toolbar in the Titanium version, and as an additional icon in the native versions.
Table 1. Screenshots of the two iOS prototype versions
Titanium iOS version Native iOS version
Sin SIM 9 �· ETSllNF
rl�.!!
181 1111 -.
1111
Sm SIM 9 1759 - • ETSllNF® t) �
Noticias Anuncios Eventos.
A
---
@e�
---
@e�
Avisos Departamentos Servicios� (;)
Asignaturas Autobuses---Busqueda
Table 2. Screenshots of the two Android prototype versions Titanium Android version
D � i.:':I 'Q � � 81% (!!) 1112 /J
ETSllNF Personal ETSllNF As1gnaturas
11�11·!
.. �.
l!lf\l nl
... ..
4.2
Study design
Native Android version ? D • 1i:'i1 i:""J��?� 69%C!l 1838 O" ETSllNF ---0. ;
� L)
Noticias Anuncios�.:;:
Eventos--A �.!t.? �.!t.?
Avisos Departamentos�
�
AsignaturasI
A call for participants was made between students of the School of Computer Science at UPM. From the 68 respondents 38 were selected because they were experienced users of either iOS or Android devices (they had more than 6 months experience), and they had not participated in the usability tests of the first prototype
(so they had not previous knowledge of the logic of the applications). Of these 38, one of them did not finish with all the required participation, so the study was completed with 37 participants: 14 expert iOS users and 23 expert Android users. Participants did not know that they were participating in a study to compare an app developed with cross-platform framework with a native one, they only knew they were participating in a usability study to test two different versions of an app for the university. Participants were given a small present (a tee-shirt or a cap) to motivate them in the realization of the study.
The study consisted in the combination of 2 different usability evaluations for each version of the prototype:
Laboratory study: To evaluate users' first impression
when they have not interacted with the prototype before. In this usability test, participants were asked to perform five specific tasks that covered all the functionalities in the app. After each laboratory test, participants were asked to evaluate the prototype.
Longitudinal study: Participants had five days to use
the app freely under real circumstances. After finishing each 5-day period, users were asked to evaluate their satisfaction with the version of the app they had been using. Longitudinal studies are especially important in the testing of mobile applications, since the different contexts where mobile devices are typically used are difficult to reproduce in a controlled environment. To avoid adaptation times, the participants used their own smartphones where the app was installed. Half of the participants in each subgroup (Android vs. iOS users) tested first the Titanium version and then the native one, and the other half just the contrary, to compensate the effect of the order of evaluation of each version. Each participant did a laboratory test with the first version assigned, then he/she was asked to use it freely for five days, then a second laboratory test was carried out with the other version of the app, and there was an additional period of five days to use freely this other version of the app. At the end of the study, when they had used both versions, they were asked to fill m a
final comparison questionnaire.
The questionnaires used for gathering participants' impressions about each version are the System Usability Scale (SUS) [6] [17]; a customized and reduced version of the User Experience Questionnaire (UEQ) [16], to focus on the only aspects that were applicable to the app context of use; and an ad-hoe questionnaire where participants were asked to compare the version of the app tested with the look and behavior of a typical app in their platform (Figures 1 to 8 in the results section are the answers to this ad-hoe questionnaire).
5. RESULTS
The study was conducted in the two first weeks of April 2014. From the 37 participants, 86.5% were male and 13.5% were female, with an age average of 23 years old. The majority of the participants were undergraduate students (81%) and the rest were Master students (19%). 62% of the participants were Android users and 38% were iOS users. These values are representative to the reality of our university [5] and also to worldwide tendency of mobile platform usage [14].
5. 1 Laboratory Study (First Impression)
5.1.1
PerformanceMeasurement
Based on the global times obtained by the participants we could observe that there were not significant differences between
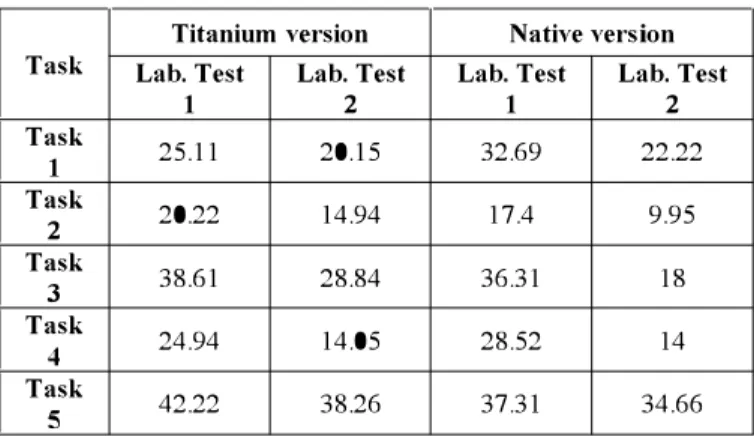
Android and iOS prototypes. Comparing Titanium and native versions there were some differences (see Table 3): two tasks were faster done in the Titanium versions and three in the native versions comparing participants that used each version in the first laboratory test, so we can conclude that in the first time each version was used (with no previous usage of the alternative version), results are comparable. In the usage of each version as the second one used, native versions obtain slightly better results, and global results are better than in the first laboratory test, as expected.
Table 3. Global average times for laboratory tests in seconds
Titanium version Native version
Task Lab. Test Lab. Test Lab. Test Lab. Test
1 2 1 2 Task 25.11 20.15 32.69 22.22 1 Task 20.22 14.94 17.4 9.95 2 Task 38.61 28.84 36.31 18 3 Task 24.94 14.05 28.52 14 4 Task 42.22 38.26 37.31 34.66 5
5.1. 2 UX
Measurement via Questionnaires
Titanium version: The majority of participants identify this
version as behaving like a native app, in general terms. 91 % of the Android participants and 79% of the iOS participants agree or totally agree with the fact that in general, the application looks and behaves as typical iOS or Android apps. Figures 1 and 2 illustrate the results obtained in the ad-hoe questionnaire for iOS and for Android, respectively.
When asked about specific issues, the generic approval rates lower in iOS, in particular about the controls and their position on screen, and also about the way of presenting information, since 71 % of the iOS participants believe that this version looks as any other application on their platforms with respect to these two concerns. 105 Lab. Test i •
!
& t---�----��---1---•rntallydl<"l•ee •Dl•agree!:
-lngenual Aramlln1tothecantrol•and llll kcord1ng to !he nillll£aDon pmjtlarlanlt.K,_,. tht,,...tittl>edofferent<ereens
Ac<<>tdlnstolhewayof pre<entinglnformanon
Figure 1. iOS Lab. Test Titanium version.
Android Lab. Test
u t---�----�---1--
{w
+---�----�----�---<--i
•+----�----�---' .
In general Accord111g to the conuols .t.cconlmg to the nil\llgatlon Acoordmg to the Wlfl/of
andrtsposltlonoothe throughtthedlfferent presentin1111format100
Fi!!:ure 2. Android Lab. Test Titanium version.
•TotallyAgrH ---� •rotaltvd1sagree •D1•agree •N/A ."''"'" •rotaltvJlirtt
It is noteworthy that for all the iOS part1c1pants (100%) who tested this prototype first, they agree or totally agree that the application looks and behaves as a normal iOS app. However, when the participants used this prototype after using the native one first, only 57% of the participants agree or totally agree with the statement of typical look and behavior in general lines. On the other hand, on Android the difference between the 1 st and the 2nd test is about 2% - 3 %, which is not relevant.
The satisfaction of the users was measured using the System Usability Scale (SUS), on which this prototype obtained an overall value of 82.7. This value represents that usability of the prototype in general is very good. The evaluated dimensions for the UEQ are shown in Table 4.
Table 4. UEQ Global Results for Titanium versions
Comparison
Dimensions Mean to Interpretation
benchmark
10% of results
Attractiveness 1.59 Good better, 75% of
results worse
Perspicuity 2.176 Excellent In the range of the
10% best results 10% of results
Efficiency 1.432 Good better, 75% of
results worse 10% of results
Dependability 1.486 Good better, 75% of
results worse Below 50% of results
Novelty 0.311 average better, 25% of
results worse The results show that the Titanium version is clear and easy to understand; meanwhile its attractiveness, dependability and efficiency are good. Moreover, the novelty dimension has the worst results, being below average.
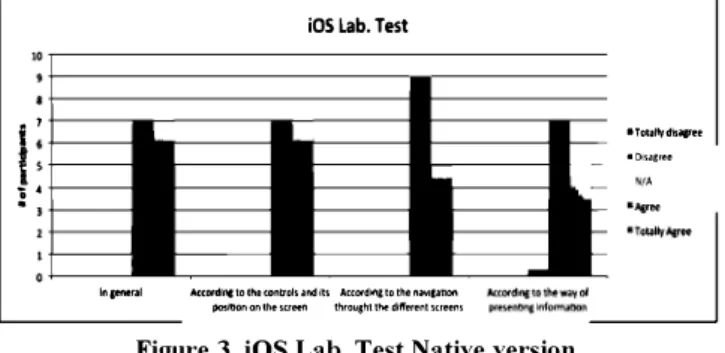
Native version: Based on the results, 100% of the iOS
participants and 91.30% of the Android participants agree or totally agree that on general terms the application looks and behaves as a typical iOS or Android app. Figures 3 and 4 show the results obtained with the native version for iOS and for Android, respectively.
i
1r
: ..
iOS Lab. Test
lngeneral Accord1rc101heoonb'olsandlts Acc0<d�tothenilV1ganon pm;ltlonontllemeen throughtthedlfferentsueem
Figure 3. iOS Lab. Test Native version.
•Totaltvd�agree
•Disagree
N/A
The results show a very small difference between the 1 st and 2nd laboratory tests.
The evaluation of user satisfaction performed with the System Usability Scale (SUS) overall resulted on a coefficient of 86.82 which means that the prototype has a very high degree of usability, in the top 10% of scores.
Android Lab. Test
u +---;---1---
i10
+----l---ll---�---I�
{
a+---1---! •+----•
lngenefi1I Acco1d1ngtothecontrols Accordmgtothena�lgation Acoord1ngtothewayof
and IU pa�lllon on the thtought the different prmnting Information
Figure 4. Android Lab. Test Native version.
Table 5 contains the summary of the results of the UEQ questionnaire and the dimensions measured for the native prototype. The results show that the native prototype of the application succeeds in all UX categories considered except m
Novelty, where users' score places it as just above average.
Table 5. UEQ Global Results for Native versions
Dimensions Mean Comparison Interpretation
to benchmark
Attractiveness 2.234 Excellent In the range of the
10% best results
Perspicuity 2.351 Excellent In the range of the 10% best results
Efficiency 1.797 Excellent In the range of the
10% best results
Dependability 1.743 Excellent In the range of the
10% best results 25% of results
Novelty 0.824 Above average better, 25% of
results worse
5.2 Longitudinal Study
The participants completed the longitudinal study surveys after having the application on their own smartphones and testing it on their own for 5 days. The same process was followed with both the Titanium and the native versions.
Titanium version: The perception of 71 % of the participants in
the iOS group, after testing and exploring the app on their own for 5 days, is that it looks and behaves in general lines as a typical iOS app; meanwhile, 91 % of the Android participants agree or totally agree with the same statement for their platform. Figures 5 and 6 show the results for the iOS and Android versions of the Titanium prototypes after the 5 days testing period.
105 Longitudinal
i•+---�----�----�---�
t•+---11
_____ __,,__ __ ----i ______ ��?4
+---�----�----�--�'""""" Acc:ordlnatotheeontroklllld AcawdlnatotheftiMlllMjon Acoordlrctothew"Vof IUposltiononthtwttn ttirou1htthtdlfl'er.tltSCl'HJ'IS pJ'fttfttlnclnf0tlftMlon
Figure 5. iOS Longitudinal Test Titanium version.
•Totallyd1'>ilgree
-N/A
... �
•TotallyAgree
The results on both platforms show that there is a significant variation between the values obtained on the first impression (laboratory) test and after 5 days. The results are much lower on iOS when participants are asked about how controls and their
pos1t10n on screen are the typical ones for an iOS app
(57%
agree), and about the way of presenting information (
43 %
agree).Android Longitudinal
{10
+---i---1---!
a +---1---11---•Totallydrs.agree •01s.aeree N/A : 6+----• •Agree -Totally AgreeIn general Accordlnc to the controls According to the navigation Accordmg to the wav of
and Its posrtlon on the thlought the different present1n1 Information
Figure 6. Android Longitudinal Test Titanium version.
For the Android prototype,
91 %
of participants agree or totally agree that the prototype behaves as a typical Android application. Meanwhile, the percentages of participants who agree or totally agree that this prototype's controls are they typical in an Android app is74%;
about the navigation, the result is65%
and according to the way of presenting information is78%.
As it happens with the iOS version, the values are reduced on20%
to30%
compared to the values obtained in the first impression (laboratory) test. The evaluation of user satisfaction performed with the System Usability Scale (SUS) overall resulted on a coefficient of82.70,
the same result obtained in the laboratory test.
In this case, there is not a big difference between the results from participants who tested this version as the first one or as the second one.
Table
6
shows the summary of the results of the UEQquestionnaire and the dimensions measured after five days of use.
Table 6. UEQ Global Results of Titanium version after five days of use
Dimensions Mean Comparison to Interpretation
benchmark
25%
of resultsAttractiveness
1.450
Above average better,50%
of results worse In the range ofPerspicuity
2.081
Excellent the10%
bestresults
25%
of resultsEfficiency
1.243
Above average better,50%
of results worse10%
of resultsDependability
1.486
Good better,75%
ofresults worse In the range of
Novelty
0.162
Bad the25%
worstresults
The results obtained show that most of the dimensions have lower qualifications after using the application
5
days. The efficiency and attractiveness on the first impression were Good and after using the app for5
days, the benchmark is above average. The perspicuity, dependability and novelty have the same values in both cases. Moreover, the novelty dimension still has the worst results on the test (Bad).Native version: The results of the test show that
100%
of the iOS participants and91 %
of the Android participants agree or totally agree that this prototype behaves as a typical application of eachplatform. Figures
7
and8
show the results for the iOS version and the Android version of the native prototype after the5
days testing period, respectively.iOS Longitudinal
In general According to the controk and According to the n�atloon According to tl\e way of
Its pOSltl()f' 0" t'1.<> crr<><>n th<r>••"hf th<> f1,ff<>•<>flf <rr»"'•' n'"'"'t1·1� 'r''"'fl' •ti,•r
•Totallydisagree •Disagree
•N/A
•Agree •TotallyAgree
Figure 7. iOS Longitudinal Test Native Prototype.
Android Longitudinal
[10
+---j---1---��---� •Totally disagreel
8 i 6 •Disagree •N/A •Agree •Totally AgreeFigure 8. Android Longitudinal Test Native. Prototype.
When asked about specific issues, the results on iOS are
8%
lower than the ones obtained in the first impression (laboratory) test. For Android, the results from the laboratory test and after the5
days are the same.In terms of usability, the evaluation of this prototype on the System Usability Scale (SUS) resulted on a coefficient of
89,12.
This very good result is slightly higher that value obtained in the first impression evaluation
(86.82).
From these results it can be inferred that the satisfaction of the users increased when they could explore the application by themselves.Table
7
contains the summary of the results of the UEQ questionnaire and the dimensions measured for the native version.Table 7. UEQ Global Results of Native Prototype after 5 days of use
Dimensions Mean Comparison to Interpretation benchmark
In the range of
Attractiveness
2.148
Excellent the10%
best results In the range ofPerspicuity
3.236
Excellent the10%
bestresults
10%
of resultsEfficiency
1.513
Good better,75%
ofresults worse In the range of
Dependability
1.783
Excellent the10%
best results25%
of resultsNovelty
0.891
Above average better,50%
of results worseThe results obtained on the attractiveness, perspicuity, dependability and novelty have the same benchmark value as the first impression of the participants. In the case of perspicuity the numeric value is better after using the application for 5 days. However, in the case of efficiency, the values are lower than the first impression tests. The results can be based on the fact that the users have more time to explore all the functionalities of the application on a real environment and maybe find some flaws. The novelty dimension has the same result as the first impression tests.
5.3 Final comparison questionnaire
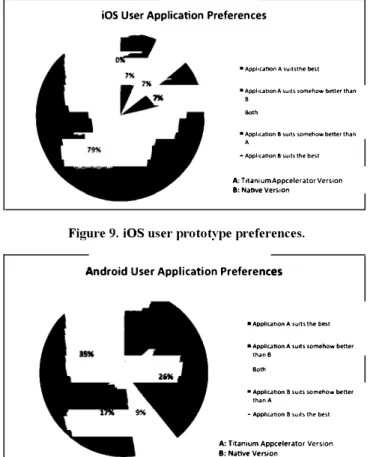
After using and testing every version of the app for five days, participants were asked to compare both applications and choose which option suits better to their idea of an iOS or Android app. Figure 9 and Figure 10 illustrate the answers and the preferences for iOS and Android participants, respectively.
iOS User Application Preferences
•Appl1canonAsu1tsthebest • Appl1canon A suits somehow better than
B
Both
•Application 8 suits somehow better than A
-Appl1canon 8 suoH the best
A: T1tan1um Appcelerator Version 8: Nahve Version
Figure 9. iOS user prototype preferences.
Android User Application Preferences
•Application A suits the b�t
•Appl le.anon A suits somehow better
thane Both
• Appllc.atlon B suits somehow better
than A
- Appllc.anon B suits the best
A: Titanium Appcelerator Version B: Native Version
Figure 10. Android user prototype preferences.
While iOS users clearly prefer the native version to the Titanium one as typical iOS app (79%+7% preferring native version vs. 7% preferring Titanium version), in Android the difference is smaller (35%+ 17% preferring native version vs. 13%+26% preferring Titanium version). Considering the global results, 51 % of participants think that the native version suits better than the Titanium version to their idea of a typical app for their platform, plus 14% who think that it suits somehow better, as opposed to 27% who think the contrary, and 8% who think both versions fit into their idea of a typical app in their platform.
6.
DISCUSSIONThe results show that there is not an extreme difference in terms of usability and UX between the versions generated by a cross platform framework and the native ones, even if the latter have obtained better results in this respect than the former.
The differences between the results of the laboratory tests on i OS with both prototypes (see Figure 1 and Figure 3) are probably caused by the known fact of iOS platform having higher homogeneity between apps thank Android.
On Android, the results of the laboratory tests are almost the same or have a small variation (see Figure 2 and Figure 4). The perception of participants is that the native version and the cross platform one behave as natural as any other Android application and the user experience generated is very good.
The longitudinal study results show a stronger preference for the native version, which is again higher between iOS users than between Android users
About the UX measured with the UEQ questionnaire, native versions obtain better scores than the framework-generated ones. Results for the longitudinal study are in both cases lower than the ones obtained in the first impression laboratory test. This may be caused because during the 5 days testing period, the users were able to explore the different options of the application on their own and also use it under real circumstances, which can cause a change in their perception as they found it difficult to use or not so much attractive any more.
Regarding the usability of the application measured with the SUS questionnaire, the tendency is the same (native better than cross platform) but the difference is not too big. Most of the results (laboratory and longitudinal studies) are on the 10% top scores of the SUS scale. In this case, the tendency is that results after the 5 days testing period are better than the ones from the first approach. This result may mean that the application is useful for the participants and has helped them to solve specific problems or have been integrated seamlessly in the student daily life.
The main indication about the adherence to platform conventions, as perceived by the user, comes from the final comparison questionnaire. Participants have been asked to choose the version that better suits their idea of an iOS or Android app, and the results show that there are important differences between iOS and Android users (see Figure 9 and Figure 10): While iOS users clearly prefer the native version to the Titanium one as typical iOS app (86% vs. 7%), in Android the difference is much smaller (52% vs. 39%). Given that some participants commented they preferred how some functionality was designed in the Titanium version, this big difference between platforms could be affected by this bias.
As a threat to the validity of the results, there is the issue of design decisions affecting the UX. We tried in our study to balance usability expertise between the two independent development teams, but there can always be individual differences that affect the quality of each design solution. This problem is intrinsic to experimentation with design processes, and very difficult to tackle. Given that users scored highly both versions of the app in terms of usability, we expect to have been successful in limiting the impact of this question into validity.
The previous training in HCI by members of the design teams in our study does not correspond to the standard developers population. For teams with no UX expertise, a hypothetic framework that provides automatically differences in control
positions and similar issues (like Titanium does on a very basic level), could provide a better UX than the one obtained developing a native app, but we expect that the lack of a UCD process would have a much bigger negative effect on the overall
UX.
The observations in our study go in the same line as the results obtained in [12], even if such work presents a more limited evaluation and the applications consisted on touch-events and accessing to hardware resources as camera, accelerometer, etc. In terms of performance and response time, [12] mentions that the native versions presented better response times than the cross platform ones; in our case, the results show that there are not representative differences in terms of performance of the UI. It is remarkable too that our application is more data focused that the ones in [12], which were focused on the usage of hardware resources of the mobile devices.
We can say that there appears to be some evidence that the usage of a cross-platform development framework, even when considering the one available that provides a better support in terms of particularizing for the specific UX of each platform, affects negatively to the UX of the resulting app in the case of the iOS platform. For the Android platform this effect also appears but with a minimal impact. The exact quantification of this negative effect would require further experimentation.
7.
CONCLUSIONSA case study has been presented for evaluating how the decision to develop a mobile app using use a cross-platform framework impacts the UX of the resulting app, against developing with native code for each platform considered.
The advantages of this kind of frameworks from a development point of view are well known, but for the first time it has been evaluated in terms of the UX of the produced app with a longitudinal study, with an app with enough functionality to be considered a full-scale app, and with a number of test participants to provide a minimum coverage of the two main mobile platforms: Android and iOS.
The results show that a good level of UX can be obtained if the cross-platform development framework is chosen carefully in terms of providing adapted interaction styles for each platform, and the development team has UX expertise. But there are more possibilities of getting a better UX by maintaining the control over interaction issues that provides the development of an app with native code. These results are stronger for the iOS platform than for the Android one, where users may be accustomed to a higher diversity of interaction styles.
Further research is needed to tackle the specific interaction design issues that will be difficult to cover in framework-generated apps, in order to help the design teams using them, and to establish a framing theory that offers software engineers a way of balancing the advantages that using these tools offers from a development point of view, with the loss in overall product quality that a lesser
UX implies.
Further experimentation with apps in different domains will be needed to refine the results of the study.
8.
ACKNOWLEDGMENTSThe authors would like to thank Google and the direction of the School of Computer Science at the Universidad Politecnica de Madrid for their support to this research project.
9.
REFERENCES[l] Angulo, E., Ferre, X., Alonso, J. UX & Cross-Plaiform Mobile Application Development Frameworks. 2014. DOI� http: //raptor.ls .fi. upm.es/techreports/ studyCPF rameworks. pdf [2] Apple. 2014. App Store Sales Top 10$ Billion in 2013.
Apple Press Release. DOI�
http://www.apple.com/pr/library /2014/01/07 App-Store Sales-Top-10-Billion-in-2013 .html
[3] Apple. 2014. iOS Human Interface Guidelines. DOI� https ://developer.apple .corn/Ii brary Ii os/ documentation/User E xperience/Conceptual/MobileHIG/MobileHIG.pdf
[4] Banerjee, U. A Tool Comparison, Technology Trend Analysis. 2012. DOI� http: //setandbma.wordpress.com/2012/ 02/20/mobile-hybrid-tool-comparison/
[5] Barea, A., Ferre, X., and Villaroel, L. 2013. Android vs. iOS Interaction Design Study for a Student Multi platform App.
HCI International 2013 -Posters' Extended Abstracts Communications in Computer and Information Science,
Volume 374, 2013, pp 8-12.
[6] Brooke, J. 1996. SUS - A quick and dirty usability scale. In P. W. Jordan, B. Thomas, B. A. Weerdmeester, & A. L. McClelland. Usability Evaluation in Industry. pp. 189--194. Taylor & Francis, London, UK, 1996.
[7] Clifton, I. G. 2013. Android User Interface Design: Turning Ideas and Sketches into Beautifully Designed Apps. Addison Wesley Professional, Upper Saddle River, NJ, USA, 2013. [8] David, M. 2011. Building Websites with HTML5 to Work
with Mobile Phones. Focal Press, Oxford, UK.
[9] Fling, B. 2009. Mobile Design and Development. O'Reilly Media, Inc., Sebastopol, CA, USA.
[10] Google Inc. and the Open Handset Alliance. 2014. Android User Interface Guidelines. DOI�
http: // <level oper. android. corn/ design/
[11] Hartson, R., and Pyla, P. S. The UX Book. Morgan Kaufmann, Amsterdam, The Netherlands, 2012. [12] Humayoun, S. R., Ehrhart, S. and Ebert, A. 2013.
Developing Mobile Apps Using Cross-Plaiform
Frameworks: A Case Study. University of Kaiserslautern. [13] IBM Corporation. 2012. Creating a Compelling Mobile User
Experience. IBM Global Business Services White Paper. http: //www-935.ibm.com/services/uk/cio/pdf/Mobile _ UX
_ Whitepaper _ 02May 12 _ VK. pdf
[14] IDC.2013. Worldwide Mobile Phone Market Forecast to Grow 7.3% in 2013 Driven by 1 Billion Smartphone Shipments. DOI�
http://www.idc.com/getdoc.j sp?containerid�prUS243028 l 3 [15] Madaudo, R., and Scandurra, P. 2013. Native versus Cross
platform frameworks for mobile application development. In:
VIII Workshop of the Italian Eclipse Community (September, 2013). DOI�
http://2013.eclipse-it.org/proceedings/6_ Madaudo-Scandurra.pdf
[16] UEQ-Online. The User Experience Questionnaire (UEQ).
Accessed January 2014. DOI� http://www.ueq-online.org/ [17] Usability.gov. 2014. System Usability Scale (SUS). Accessed
January 2014. DOI� http://www.usability.gov/how-to-and tools/resources/templates/system-usability-scale-sus.html