Report
Prepared by: Sophie van den Berg April 2020
“Make
Lake C
ity zero plastic waste”
Municipal solid waste management
in Udaipur, Rajasthan
2 | P a g e
Table of Contents
Table of Contents ... 2
SUMMARY ... 3
1.
Introduction ... 5
2.
Project area and waste generation ... 6
3.
Findings ... 8
3.1 Segregation at source, communication and satisfaction of residents ... 8
3.2 Collection of segregated waste and transport to zero waste center/MRF ... 9
3.3 Zero waste center/MRF ... 9
3.4 Commercialization of recyclables ... 12
3.5 Institutional ... 13
3.6 Financial ... 13
4.
Discussion and recommended next steps ... 15
5.
Conclusions ... 20
Annex 1: Example of app to teach children about waste segregation ... 21
3 | P a g e
SUMMARY
Since September 2018, FINISH Society started the collection of solid waste from 16,500 households in 15 wards of Udaipur. An assessment of the SWM collection and treatment system showed impressive results achieved in a relatively short period of operations:
• Zero waste center fully operational with sorting in place, ensuring almost zero disposal of waste.
• In one year 4000 tons of waste handled of which 880 tons of plastics saved from entering the environment.
• Supporting sustainable employment of almost 65 green workers (collection and sorting). • High satisfaction of the served residents and trust in the established system with a feedback
system in place and a helpline for complaints implemented.
• Residents state to be pleased with the cleaner environment of their neighborhood. • High participation of residents that segregate their waste (estimation of 85% of residents
segregate their waste).
• Since January 2020 a user fee has been charged to the residents (20 Rs./month). Other findings include:
• Residents do not always understand the reason why they have to segregate their waste in dry waste and wet waste.
• The way waste collection is implemented at this moment, is time consuming and therefore very costly (7 days per week, and a time slot for residents to hand over segregated waste). • In the zero waste center/MRF machines (shredder, agglomerator, extruder and air cleaner)
are installed but are not used. Sorting is done manually.
• Composting is not practiced in a proper way and needs improvement.
• Total costs of collection, transporting and sorting the waste is 2419 Rs./ton (31 US$/ton). Extrapolating this to the whole city of Udaipur shows that a user fee of at least 148 Rs./hh/month (2.03 US$/month) is needed to cover all costs (depreciation costs not yet taken into account and assuming that 80% of the households pay the user fee).
• Cost recovery by sales of recyclables is only 6%. Total cost recovery (including fee collection) is 20%. The finance gap is currently covered by UMC (Udaipur Municipal Corporation). To transfer the Udaipur system in a model SWM system that can be replicated to the whole of Udaipur and other secondary cities in India, the following adaptions are recommended by WASTE (short term and long term actions):
Short term
• Emphasize the importance of recycling in the communication strategy so residents understand better why they need to segregate their waste.
• Carry out the 100-household composition analysis yearly to get a better understanding of how much waste is generated and how much is really recyclable.
• Improve efficiency of waste collection, 2 trips per vehicle per day are possible. This will lower the collection costs considerably.
• Improve logistics and productivity of the sorting by installing a conveyor belt and improve material flows in the MRF/zero waste center, at the same time working conditions of the sorters will improve.
• Increase cost recovery by selling secondary raw materials by using the provided machines, gain more insight in the market of recyclables and secondary raw materials and establish small scale recycling enterprises run by women Self Help Groups.
4 | P a g e
• Partner with a Producer Responsibility Organisation (PRO)1 to be able to use EPR (extended Producer Responsibility) funding.
• Use key benchmark figures (general, resource recovery and financial) to monitor the effectiveness of the system and to be able to compare different SWM systems and models. Long term
• Provide residents with 2 waste bins with a lid (wet waste and dry waste). This will enable them to store their waste for a longer time and the waste collection can be lowered to every other day or to 3 times per week.
• To obtain financial sustainability: Increase the user fee and complement user fee with revenues collected through property tax. Or implement a cross-subsidy scheme.
To obtain a FINILOOP “Make Lake City zero plastic waste!” model SWM system:
• Include prevention of single use plastics in communication campaigns.
• Determine leakages of (plastic) waste to waterways, lakes and environment and implement activities to stop these leakages.
• Introduce innovations to manufacture products out of low value plastics.
• Monitor the cleanliness of the city (develop a method in case there is no method available). • UMC can support the market for recycled products by purchasing recycled products for
their own implementation projects (tiles, bricks, road construction).
• Turn the present zero waste center/MRF into a model recycling center where recycling can be demonstrated and recycled products are sold (compost bins, waste bins, flower pots, etc.), with an educational center where training courses about recycling and (home) composting can take place, provide tours to interested residents. Improve surroundings by planting trees and plants.
1A PRO is a professional organization that helps Producers/Brand Owners meets their EPR targets
through various processing technologies for plastic waste including MLP or its End of Life applications like Waste to Energy, Waste to fuel, Waste to Road and Waste to cement kiln in the country.
5 | P a g e
1.
Introduction
Municipal solid waste (MSW) continues to be a severe problem in India not in the last place because the increasing quantities of waste are also becoming more and more complex with the new types of wastes such as the fast growing quantity of plastics. Along the whole chain, from the collection of wastes to its final disposal, many Indian cities are struggling to implement an affordable and sustainable model. In 2018, FINISH Society won the contract with the Udaipur Municipal Corporation (UMC) to implement door to door collection of segregated waste (dry waste and wet waste) and to transport the waste to a designated site (MRF) for sorting and composting.
Udaipur is the first city selected by WASTE (www.waste.nl) to be included in the FINILOOP program. FINILOOP partners with cities to reduce, redesign and improve management of plastics. Through an integrated model, FINILOOP is addressing inadequate waste management in cities focusing on plastic pollution.
This report shows the findings of a rapid assessment of the Udaipur SWM system implemented by FINISH Society. The main goals of the rapid assessment were:
• To gain a better understanding of the waste management system in Udaipur implemented by FINISH Society.
• To identify key issues and challenges with focus on plastic waste.
• To formulate recommendations for system improvement and scaling up, actions to increase effectiveness and sustainability in the short- and medium-term.
The rapid assessment was a 2-day consultation (January 24-25 2020) that put Sophie van den Berg of WASTE in the field to talk with stakeholders; observe interactions and operations in the field; reflect on the situation, and make preliminary recommendations.
Information was collected via:
• Meetings with project implementers of FINISH Society
• Visits of the collection of segregated waste in the wards and talks with citizens, (IEC) supervisors, waste collectors and alike
• Meeting with UMC commissioner
• Documentation such as reports, mass balances, sales records, tender document, presentations.
Chapter 2 gives information about the project area and the amount of waste generated, chapter 3 shows the findings and these are discussed in chapter 4. The final conclusions can be found in chapter 5.
6 | P a g e
2.
Project area and waste generation
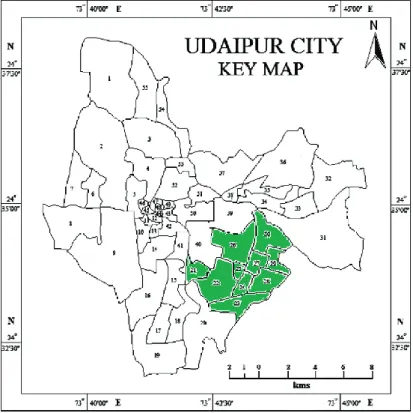
Udaipur is situated in the Rajasthan State, also known as the "City of Lakes" and has a total of 468,904 habitants (20132). Since September 2018 FINISH Society started the collection of segregated waste from 10 wards in Nagar Nigam (see figure 1). Each person is estimated to produce approximately 300 gram per day of which 60% is wet waste and 40% is dry waste. Table 1 presents the number of households and a calculation on the waste they generate in the project area.
Table 1: Demographic profile and highest potential waste generation of the project area No of wards served No. households Population in 10 wards Waste generation (gr/day/person) in served area Total generation of waste (ton/day) Wet waste generation (ton/day) Dry waste generation (ton/day) 10 (No. 21 to 30) 16,500 66,000 300 19.8 11.9 7.9
The estimation has not taken producers into account such as schools, shops, restaurants, offices or hotels. The following activities are not included in the contract with UMC:
• Sweeping of main and internal roads, open plots and parks, markets.
• Collection and transportation of biomedical waste and industrial hazardous waste. • Collection of waste from industrial units.
• Collection of waste from bulk generators (above 100 kg/day).
Figure 1: Map of Udaipur with the collection area in green
7 | P a g e
Roads in the collection area are narrow, making it sometimes difficult for the collection vehicles to enter. Empty plots in the project area are used by residents to dump garbage. Before starting this collection system, 30 containers were present in this area. This number has been reduced with 15 and the area is planned to be container free in the coming year. The set up of the system started in September 2018 by educating the staff and creating awareness on segregation of waste at source through community meetings, door-to-door visits and demonstrations. Sweeping the roads and cleaning gutters is not part of the contract between FINISH Society and UMC.
8 | P a g e
3.
Findings
This section presents the main findings of the analysis of the received information about the SWM system in the project area combined with observations during the field visit. They are grouped around the following issues:
1. Segregation at source, communication and satisfaction of residents 2. Collection of segregated waste and transport to zero waste center/MRF 3. Zero waste center/MRF
4. Commercialization of recyclables 5. Institutional
6. Financial
3.1
Segregation at source, communication and satisfaction of residents
Households segregate their waste into wet waste and dry waste. A waste bin has not been provided, the households use a bucket, bag or bin from their own utensils. Observation of the segregated waste handed over to the collection vehicle showed that segregation is done properly. And if not done properly the green worker segregates the waste while emptying the bin or bucket. It is estimated that 85% of the participating households segregate their waste. An extensive awareness programme was executed to explain the inhabitants how and why they should segregate the waste into wet waste and dry waste. The slogan used was “My waste, my responsibility”. Awareness was created through community meetings, door-to-door visits, folk shows, spreading a leaflet and demonstrations by 3 IEC (Information, Education, Communication) workers from which 2 are women. During the visit, I asked some participants
why they are segregating the waste. The answers were various: “Because they asked me to do it”, “The green waste is for composting, the blue waste is burned”, “For the recycling”.
Participants are able to make complaints by using the phone number placed on the collection vehicle or directly to the workers. A feedback register is present and satisfaction of the inhabitants is monitored regularly. During the visit various participants of the system expressed their satisfaction with the waste collection system: “Before we just dumped the waste into an
open area in the neighborhood.”, “Very pleased with the service”, “The neighbourhood is cleaner than before”.
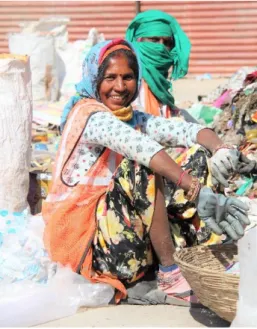
Kanta (40 years old) has 2 children is very pleased with the waste collection service offered by FINISH Society. Before, she just threw her waste outside on an open area. Now, the neighborhood is much cleaner than it used to be. On the question why she segregates the waste in dry waste and wet waste she says: “ Because they ask
me to do it.” She sells her plastic bottles
9 | P a g e
3.2
Collection of segregated waste and transport to zero waste center/MRF
Daily collection of the segregated waste takes place in the residential area from 6:30 to 11:30. The collection vehicles have a green compartment for wet waste and a blue compartment for dry waste. Routes can be followed using GPS. Audio jingle on Swatchhatta (cleanliness) awareness plays in vehicle throughout the route of collection. Each route has a strict time schedule, the residents bring their sorted waste when hearing the song played by the collection vehicle. Each vehicle makes one trip per day, after special days such as festivals, two trips are needed due to the large amount of waste generated. A constraint in this type of collection system is that residents need to be at home at the designated time of waste collection. When they are not present and cannot hand over their waste, their waste is not collected that day.
Figure 2: Example of GPS tracking during collection
Collection is done with 17 motorized vehicles, each vehicle has one driver and one green worker. The work is supervised by 5 supervisors. Drivers and green workers are allowed to sort out recyclables that they themselves sell.
At the end of the route the collected wet and dry waste are transported to the zero waste center/MRF at a distance of 8 km from the collection area.
3.3
Zero waste center/MRF
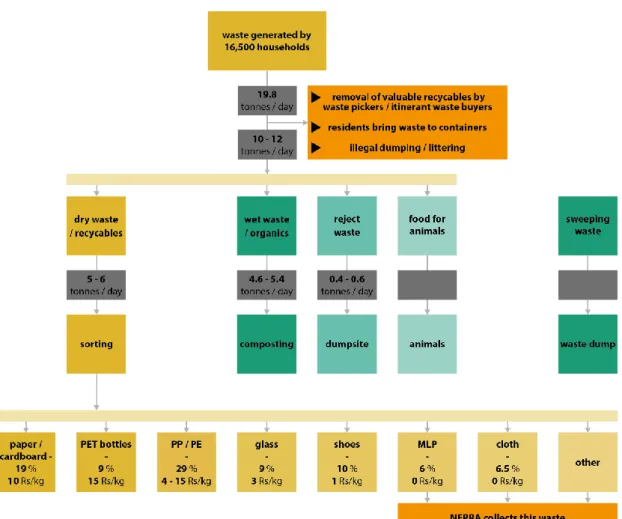
The waste from the households is collected in 4 categories: wet waste, dry waste, food waste and hazardous waste (including sanitary waste), see figure 4 for the flow diagram. On the route
10 | P a g e
from the project area to the zero waste center/MRF, the vehicle first goes to the weigh bridge and gets weighed. Then the vehicle unloads the dry waste at the MRF, again moves to the weigh bridge to get weighed and unloads the organic waste at the composting area. The empty vehicle moves again to the weigh bridge to get weighed and after this the vehicle is washed in the washing area. The weigh bridge is at about 2 km distance from the zero waste center/MRF. As all the routes of the vehicles end at the same time, a line up arises every day in front of the zero waste center/MRF.
11 | P a g e
Dry waste area
Every day an amount of 5-6 tons of dry waste arrives at the zero waste center/MRF. The dry waste is unloaded from the vehicle at the dry waste area where 20 women are hired to sort the waste manually.
Figure 5: Segregation of waste at the MRF/zero waste center is done manually
The dry waste entering the sorting site hardly contains organics or inert material, such as sand from sweeping. One woman sorts approximately 1 vehicle load per day (about 300 kg). The dry waste was sorted in 20 different categories (see figure 5) but this has recently been changed. At this moment only high value plastics with a market value are sorted. Plastics without a value (very contaminated, multi layer packaging, etc) and other materials (cloths) are collected by NEPRA without a cost. NEPRA delivers these materials to cement factories where they are burned.
Figure 6: Composition of dry waste at the zero waste center/MRF
12,4 0,8 8,4 0,8 18,4 9,1 10,2 6,5 9,7 2,1 0,0 0,2 9,5 0,0 3,20,8 0,9 0,8 6,0
0,0 0,2
composition incoming dry waste
L.D.H.M. P.P. Mix Plastic HDPE Paper Carton Glass Shoes Cloth PET Steel Iron E waste Green PET Colored PE Colored PP Disposable LDPE Multilayer
12 | P a g e
Other observations:
• Baling machine, shredder, agglomerator and extruder (to produce lumps) are present but are not used. Due to some problems encountered during the start of using these machines, usage was not continued. Furthermore the market of the produced secondary raw materials is not clear.
• The weighing scale is present but not used.
• The sorting is done manually by women sitting on the floor. Plastic is sorted in two steps: the first steps only sorts out plastics, the second sorts the plastic in different types. Wet waste area/composting area
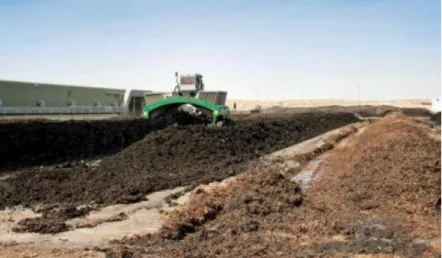
Every day approx. 4.6-5.4 tons of wet waste arrives at the composting area. The wet waste is unloaded at the composting area. The municipality built an enormous hall for this purpose and FINISH Society has recently started the composting activities. The organic waste is spread over a concrete area. The plastic waste that is present is taken out. Decaying organic material (food waste, food left overs) in the wet waste results in an enormous amount of flies in the pile of wet waste. Overall it can be stated that an excessive amount of flies are present in both in the wet waste area as in the dry waste area.
3.4
Commercialization of recyclables
The sorted materials are sold to various buyers and depending on the requirements of the buyer, they are baled with the available baler. Table 2 gives an overview of the sales records of the first 6 months of operations.
Table 2: Sales records of recyclables for 6 months of operations Type of
waste
Value of material
Rs./kg May June July Aug Sept Oct
Total (kg.) Total value (Rs.) Total value (US$) PP/LD (LDPP) 4 785 775 1560 6240 87 HM/LD ( 7 2370 1745 5377 9492 66444 930 PET 15 399 530 459 420 425 2233 33495 469 HDPE mix 10 505 1675 1653 1825 1682 2633 9973 99730 1396 Glass 3 810 1695 3335 2511 2350 1845 12546 37638 527 HDPE 13 45 192 88 58 60 443 5759 81 HDPE green 15 145 145 2175 30 Shoes/slipp ers 1 1375 1525 945 1370 3670 8885 8885 124 Paper 3 1615 4370 1605 7590 22770 319 LD Milk pouches 8 406 406 3248 45 Iron 10 98 55 45 85 283 2830 40 Cardboard 4 445 257 329 1031 4124 58 E-waste 15 27 35 62 930 13 PVC 0 0 0 Steel 35 82 82 2870 40 Al foil 40 20 36 56 2240 31 AVPLD 36 6,5 6,5 234 3 AVS 0 0 0
13 | P a g e
Total 3715 11929 11175 6140 6290 15545 299612 4195
The table shows that most revenues come from sales of HDPE. The quantity of PET bottles found in the collected waste is very low, as they are already sold to itinerant buyers at household level. Selling prices in general are lower than expected if you look at the findings of the thesis of Tara Durieux3. Some categories, not mentioned in the table, such as clothes and Multi Layer Packaging (MLP) are without any monetary value at all.
3.5
Institutional
The municipality of Udaipur initiated the tender process for wards no. 31 to 40 and 51 to 55 in August 2018, based on the SWM rules 2016. FINISH Society won this tender and started the waste collection in September 2018. The MRF/zero waste center became operational last May 2019. The municipality of Udaipur does not support the solid waste collection of segregated waste with a strong communication campaign. A visit to Mr Ankit Kumar Singh, appointed commissioner since March 2019, showed the special interest in the work of FINISH Society. In the municipality there is no specific officer responsible for solid waste management. The commitment of the new mayor Govind Singh Tank towards improving the cleanliness of the city is not yet known.
The relationship between FINISH Society and UMC is based on a long working relationship in other projects and UMC is willing to explore how to expand the SWM activities with FINISH Society.
UMC recently (January 2020) started to collect user fees from households (20 Rs per household per month).
3.6
Financial
Table 3 presents an overview of the costs of the SWM system per month as implemented by FINISH Society.
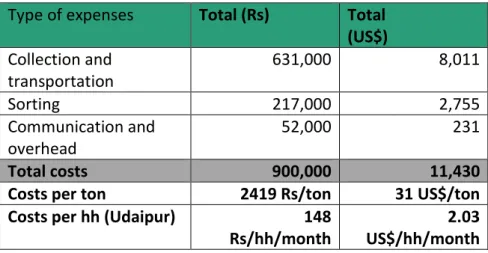
Taken into account all expenses (except for depreciation and disposal), the total monthly costs are calculated to be 900,000 Rs (11,430 US$) per month. Daily 10-12 tons solid waste are collected, this means that the total cost per ton SWM collected are 2419 Rs./ton (31 US$/ton). The total generation of solid waste in Udaipur is 140 tons per day4. Expanding the collection of solid waste to the whole city would have a cost of 10,498,460 Rs. per month. This would mean that at least a user fee of 148 Rs. per household is needed to cover all costs (based on 88,857 households and a percentage of 80% payment).
3 Analysis on plastic recycling value chain – a case study in Udaipur, India 4http://www.udaipurmc.org/PDF/Others/Ud_CSP_CSTF.pdf
14 | P a g e
Table 3: Analysis of the operating costs of the waste management system (per month), without depreciation and disposal costs
Type of expenses
Total (Rs)
Total
(US$)
Collection and
transportation
631,000
8,011
Sorting
217,000
2,755
Communication and
overhead
52,000
231
Total costs
900,000
11,430
Costs per ton
2419 Rs/ton
31 US$/ton
Costs per hh (Udaipur)
148
Rs/hh/month
2.03
US$/hh/month
Revenues
After establishing a reliable service and trust from the residents, UMC started with the collection of user fees in January 2020. It is estimated that at this moment 40% of the households pay a fee of 20 Rs. per month.
Prices of recyclables can vary daily, it is important to be well connected to the market. Many actors in the plastic recycling value chain (Kabadiwala/middlemen, scrap dealers, recyclers) are informal enterprises and are not eager to deal with municipal MRF centers as they have to provide documents when purchasing the recyclables.
Economic feasibility (expenses and revenues)
With the sales of recyclables 6% of the total costs can be recovered. Together with the revenues from user fees 20% of the total costs to the SWM system are now recovered.
Table 4: Financial sustainability of the SWM system Expenses (per year) Rs. US$ Revenues (per year) Rs. US$ Collection and transportation 7572 000 96 132 Sales of recyclables 600 000 8400 Sorting 2604 000 33 060 Collection of user fees (40% pay) 1 584 000 22 176 Communication and overhead 624 000 2 772 Total 10 800 000 151 200 Total 2 184 000 30 576 Yearly finance gap -8 616 0005 -120 624
15 | P a g e
4.
Discussion and recommended next steps
Awareness on source segregation
• The projects shows very good results in source segregation among the residents served with the waste collection service. People are very satisfied with the service offered. Segregation is key in the implemented SWM system, it increases recycling potential and the quality of end products, and reduces the amount of waste that needs to be disposed off. The message about source segregation needs to be repeated over and over again. Creating awareness takes time and communication is a cost that needs to be taken into account. At the start of the project, awareness creating costs are higher than at a later stage.
Recommendations for FINISH Society/service provider:
Residents need to understand why segregation at source is needed and it is also important to give them feedback on their performance. For example to let them know how many tons of waste are recycled. It is recommended to integrate these two issues in the communication strategy for the coming years.
To get residents to segregate at source many incentives and activities are possible to achieve this. Try different methods and clearly document the results. This is also important to share with other FINISH Society SWM projects. A nice example could be the development of an app showing what material goes in which fraction: wet waste or dry waste, see annex 1.
Recommendations for UMC:
Start a city wide campaign about not using single use plastic items to prevent the generation of plastic waste.
Household waste collection
• The implemented model with collection of waste seven days per week is a highly cost intensive model. In many countries waste is collected 2-3 times per week. In Indian society people are not used to store their waste in their home for longer than one day. For scaling purposes (to the whole city) a 7 days per week collection system is not financially sustainable. However, although this system is costly, it is very useful to teach residents how to segregate their waste and get adjusted to the waste collection service. And to get people adjusted to paying a service fee after having established a reliable service of waste collection.
• The present collection system is very inefficient. Waiting for residents to bring their segregated waste (instead of curb side collection), the line-up of vehicles at the MRF/zero waste center and the distance of the weighing bridge at 2 km are all factors that cause that 1 vehicle can only perform 1 trip per day.
• Collecting waste following a certain time schedule makes the waste collection very inflexible, especially for the residents as they have to hand over the waste. On days that they are not present, their waste is not collected.
• Sweeping waste is collected separately by UMC which is positive as this prevents the mixing of inert waste (sand) with the household waste.
16 | P a g e
Recommendations for UMC:
In the future, residents will have to get used to store their waste in the house for a longer period. It is important to provide residents the right waste bin to store their waste properly in their house, preferably with a lid that can be closed, this to prevent stench and flies. To make the waste collection system more effective and flexible it is recommended to change the system to a curb side collection system: the residents place their bins in the street and the collection vehicle passes at a certain time and collects the waste from the bins.
Recommendation for FINISH Society/service provider:
With some adjustments in the collection system, 1 vehicle can perform 2 trips per day and this will considerably lower collection costs.
Zero waste center/MRF
• Flies are a source of diseases, especially when they are in contact with waste materials. The occurrence of flies needs to be prevented as much as possible.
• At this moment of the study, the zero waste center/MRF has no weighing bridge and vehicles need to use a weighing bridge at a distance of 2 km from the center. It is important to have this facility at the center itself. Keeping track of all incoming and outgoing waste materials is vital for monitoring the operational activities of the center. UMC is in the process of installing a weighing bridge at the entrance of the facility. This will improve the efficiency of the unloading at the MRF.
• Revenues from sales of recyclables can be increased by producing secondary raw materials using the equipment (shredder, agglomerator, extruder) installed at the MRF. Secondary raw materials such as flakes and lumps can be sold for prices varying between 20-30 Rs./kg (source: thesis Tara).
• Storing the recyclables until higher volumes can be sold, will also increase the selling prices of the materials. This means that storing space must be available.
Recommendation for UMC:
Give priority to the establishment of the weighing bridge at the zero waste center premises. Provide place to store recyclables so higher volumes can be sold.
Recommendation for FINISH Society/service provider:
Decrease the amount of flies by improving the composting process (see composting paragraph).
It is recommended to install a conveyor belt to improve the sorting of the dry waste. It will not only duplicate or triplicate the sorting capacity but will also improve the working conditions for the sorters.
Improve logistics of waste flows.
Recycling/composting
• To process compost of a good quality a certain temperature needs to be reached in heaps or rows of organic waste. This is not the case in the composting area of the zero waste center/MRF as organic waste is just spread over the cement floor.
17 | P a g e
Recommendation for UMC:
Purchase recycled products such as waste bins and compost bins made from recycled plastic to promote the usage of recycled plastic and to develop the market.
Purchase compost from the zero waste center/MRF to be used in municipal parks, gardens, etc.
Recommendation for FINISH Society/service provider:
Improve composting by implementing row composting and improve the monitoring of composting process (measurement of humidity and temperatures). Simple solutions to prevent flies are: Cover the organic waste rows with dry leaves or jute bags, this will prevent flies from entering the waste rows. By improving the composting process, quality compost with a higher market value can be produced and stench/flies will decrease significantly.
Figure 7: Example of row composting with usage of an automatic turner
Map actors in the (plastic and compost) value chain and gain more insights in the markets of both plastic waste recycling and compost. Research the compost market and develop a marketing strategy.
Capacitate Self Help Groups to produce products and secondary raw materials out of the plastic waste. Support these groups with technical trainings, business development skills and access to finance.
Institutional
• To be able to implement and monitor SWM activities it is needed to have capacitated officers responsible for SWM in UMC.
Recommendation for UMC:
Appoint a special officer in UMC responsible for SWM who can function as contact person and controls and monitors the implementation of the SWM activities. This person can also develop a clear vision and strategy on SWM for the city of Udaipur.
Financial
• Revenues of sales of recyclables are not as high as expected. One of the reasons for this is that the high value waste (paper, carton, PET bottles, shampoo bottles) never reaches the zero waste center/MRF but is sold by the households directly to itinerant buyers (see figure 4). The dry waste reaching the zero waste center therefore does not contain a lot of high value waste material. A second reason is that the waste material at the zero waste center is
18 | P a g e
more contaminated and therefore receives a lower price. A third reason is that informal sorting and recycling enterprises are not eager to buy from municipal MRFs when formal documents and licenses are needed.
• The total cost per ton SWM collected are 2419 Rs./ton (31 US$/ton).
• Cost recovery by sales of recyclables and collecting user fees is only 20%. The other part is still covered by UMC from municipal/state/government budget. This cost recovery can be increased by increasing sales of recyclables and compost or increasing the user fees and the amount of residents paying this user fee. When the present SWM system would scale to the whole city of Udaipur a realistic user fee would be at least 148 Rs/ month per household. Studies have shown that most people are willing to pay 1% of their monthly income6. As an average salary in India is around 300 US$7, a monthly fee of 1.15 US$ is within the reach of the residents of Udaipur. Another possibility would be to implement a cross-subsidy scheme with lower fees for low-income households and higher fees for high-income households. Or use cross subsidy by covering collection of low-income households with user fees of bulk generators (shops, restaurants, hotels, offices, schools, etc).
Recommendation for UMC:
Use data of the real costs of collection and sorting to calculate the service fee needed to cover all the costs or find funding for the finance gap. Decide on increasing the service fee or implement a cross subsidy scheme.
To increase the number of paying households it is recommended to combine the user fee with revenues collected through property tax or a other kind of tax.
Recommendation for FINISH Society/service provider:
Explore EPR financing to cover costs of sorting and recycling, f.i. of mult layer packaging. Brand owners will be more interested when activities are scaled to the whole city. It is advised to partner with a PRO already licensed to obtain EPR funding.
Benchmark waste composition and quantity, carry out the 100-household composition analysis yearly in the project area to get a better estimate of how much waste is really generated and recyclable and what the trends are in composition of household waste, see annex 2 for a short description of the methodology.
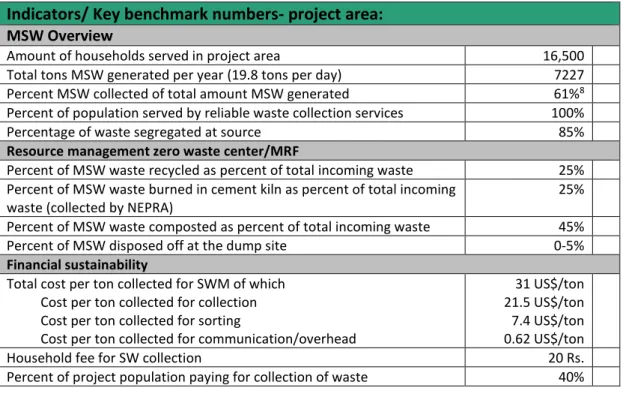
Use key benchmark figures to be able to get insight in effectiveness of SWM system and to compare impact with other SWM systems, see table 5
6 https://www.waste.nl/wp-content/uploads/2019/02/tools_finecon_eng1.pdf 7 https://surejob.in/average-salary-in-india.html
19 | P a g e
Table 5: Proposed key benchmark figures
Indicators/ Key benchmark numbers- project area:
MSW Overview
Amount of households served in project area 16,500
Total tons MSW generated per year (19.8 tons per day) 7227
Percent MSW collected of total amount MSW generated 61%8
Percent of population served by reliable waste collection services 100%
Percentage of waste segregated at source 85%
Resource management zero waste center/MRF
Percent of MSW waste recycled as percent of total incoming waste 25%
Percent of MSW waste burned in cement kiln as percent of total incoming waste (collected by NEPRA)
25%
Percent of MSW waste composted as percent of total incoming waste 45%
Percent of MSW disposed off at the dump site 0-5%
Financial sustainability
Total cost per ton collected for SWM of which Cost per ton collected for collection Cost per ton collected for sorting
Cost per ton collected for communication/overhead
31 US$/ton 21.5 US$/ton 7.4 US$/ton 0.62 US$/ton
Household fee for SW collection 20 Rs.
Percent of project population paying for collection of waste 40%
20 | P a g e
5.
Conclusions
The assessment executed showed remarkable results in percentage of source segregated waste reaching the zero waste center/MRF. This is the result of a reliable waste collection system that allows close interactions with the residents. Collection costs can be reduced by implementing measures that will increase effectiveness (every vehicle can perform 2 trips per day).
The zero waste center/MRF is in full operation and only 5% of the collected waste needs to be transported to the dumpsite. The other part is composted, recycled or collected to be burned in cement kilns. The zero waste center/MRF can improve in productivity by installing a conveyor belt which at the same time will improve the working conditions of the sorting ladies. Value addition in the sorted waste can be achieved by storing materials for longer times, build better relationships with buyers and partner with a PRO to be able to receive EPR funding. Composting needs to be taken up as a business activity.
Financial sustainability of the system can be achieved by coverage of the costs by residents paying a user fee. Scaling the implemented system to the whole city will need a user fee of at least 148 Rs per household per month to cover the costs of collection and treatment.
Furthermore, to obtain a FINILOOP “Make Lake city zero plastic waste!” model SWM system, it is recommended to:
• Include prevention of plastic waste in communication campaigns.
• Determine leakages of (plastic) waste to waterways, lakes and environment and implement activities to stop these leakages
• Monitor the cleanliness of the city (develop a method in case there is no method available). • UMC can develop the market for recycled products by purchasing recycled products for
their own implementation projects (tiles, bricks, waste bins, road construction).
• Turn the present zero waste center/MRF into a model recycling center where recycling can be demonstrated and recycled products are sold (compost bins, waste bins, flower pots, etc.), with an educational center where training courses about recycling and (home) composting can take place, visit tours can be organized to interested residents. Improve surroundings by planting trees and plants using the compost of the center.
21 | P a g e
Annex 1: Example of app to teach children about waste segregation
22 | P a g e
Annex 2 Methodology to determine waste generation and composition
It is recommended to determine the waste generation per person per day and the waste composition using the following method9 recommended by UN Habitat:
For countries and cities that do not have the data or have outdated information, a household survey to identify daily waste generation should be done, at least two times a year in
different seasons. In the household survey, liner bags will be distributed to each household to be surveyed and ask head of household to put 7 days of waste generated. Then the liner bags are collected and its weight is measured. Household to be surveyed should be picked up according to the income levels. Composition of the different materials (glass, paper, cardboard, plastic, etc) in the waste can be measured at the same time. Municipal waste from other sources such as market, restaurants, hotels, schools and so on also should be measured.