Hate Speech, Machine Classification and Statistical Modelling of Information Flows
on Twitter: Interpretation and Communication for Policy Decision Making
Pete Burnap*1 and Matthew L. Williams2
1Cardiff School of Computer Science & Informatics, Cardiff University, UK 2Cardiff School of Social Sciences, Cardiff University, UK
Abstract -‐ In 2013, the murder of Drummer Lee Rigby in Woolwich, UK led to an extensive public social media reaction. Given the extreme terrorist motive and public nature of the actions it was feasible that the public response could include written expressions of hateful and antagonistic sentiment towards a particular race, ethnicity and religion, which can be interpreted as ‘hate speech’. This provided motivation to study the spread of hate speech on Twitter following such a widespread and emotive event. In this paper we present a supervised machine learning text classifier, trained and tested to distinguish between hateful and/or antagonistic responses with a focus on race, ethnicity or religion; and more general responses. We used human annotated data collected from Twitter in the immediate aftermath of Lee Rigby’s murder to train and test the classifier. As “Big Data” is a growing topic of study, and its use is in policy and decision making is being constantly debated at present, we discuss the use of supervised machine learning tools to classify a sample of “Big Data”, and how the results can be interpreted for use in policy and decision making. The results of the classifier are optimal using a combination of probabilistic, rule-‐based and spatial based classifiers with a voted ensemble meta-‐classifier. We achieve an overall F-‐measure of 0.95 using features derived from the content of each tweet, including syntactic dependencies between terms to recognise “othering” terms, incitement to respond with antagonistic action, and claims of well founded or justified discrimination against social groups. We then demonstrate how the results of the classifier can be robustly utilized in a statistical model used to forecast the likely spread of hate speech in a sample of Twitter data.
Introduction
Research using traditional surveys and interviews has identified that both crime and prejudice are influenced in the short term by singular events such as widely publicized murders (Phillips, 1980, on homicide), riots (Bobo et al., 1994, on race relations), court cases and terrorism (King and Sutton, 2014 on Hate Crime, Legewie, 2013, on anti immigrant sentiment). Hate Crimes have been shown to cluster in time and tend to increase, sometimes dramatically, in the aftermath of an antecedent or ‘trigger’ event (King and Sutton, 2013). There has been an historic preoccupation with where hate crimes happen (risky neighbourhoods, demographic factors etc.), while there is little research that looks at when they happen. King and Sutton (2013) report that that 481 hate crimes occurred with a specific anti-‐Islamic motive a year following 9/11, with 58% of them perpetrated 2 weeks following the event (4 percent of the at-‐risk period). Such evidence demonstrates that crimes entailing a prejudicial motive often occur in close temporal proximity to galvanizing events, such as terrorist attacks. It is during this period that decision makers, particularly those responsible for minimising the risk of social disorder through community
reassurance, local policing, and the online governance of hateful and antagonistic content, require additional information on the likelihood of disruption.
Hate crimes are communicative acts, often provoked by events that incite retribution in the targeted group, towards the group that share similar characteristics to the perpetrators (King and Sutton, 2013). Collecting and analysing temporal data allows decision makers to study the escalation, duration, diffusion, and de-‐escalation of hate crimes following ‘trigger’ events. However, decision makers are often limited in the information that can be obtained in the immediate aftermath of such events. When data can be obtained, they are often of low granularity, subject to missing information (hate crimes are largely unreported to the police), and invariably retrospective. However, the recent widespread adoption of social media offers a new opportunity to address these data problems. The continued growth of online social networks and microblogging Web services, such as Twitter, enable a locomotive, extensive and near-‐real-‐time data source through which the analysis of hateful and antagonistic responses to ‘trigger’ events can be undertaken. Such data affords researchers with the possibility to measure the online social mood and emotion following large scale disruptive and emotive events such terrorist attacks in near-‐real-‐ time. Twitter is a defensible and logical source of data for such analysis given that users of social media are more likely to express emotional content due to deindividuation (anonymity, lack of self awareness in groups, disinhibition) (Festinger et al. 1952). There is also a case history relating to the expression of hateful sentiment on social media in the UK, providing evidence of “real world” criminal justice response to, and therefore criminalization of, online acts of targeted hateful communication. For example, in 2012, Liam Stacey was sentenced to 56 days in prison for posting racially offensive comments on Twitter after a Premier League footballer's cardiac arrest, and in 2014, Declan McCuish was jailed for a year for tweeting racist comments about two Glasgow Rangers football players.
To date there has been very little research into the manifestation and diffusion of hate speech and antagonistic content in social media in relation to events that could be classed as ‘trigger’ events for hate crimes. In 2013, the murder of Drummer Lee Rigby in Woolwich led an extensive social media reaction. Given the extreme terrorist motive and public nature of the actions it was feasible that the public response could include written expressions of hateful and antagonistic sentiment towards a particular race, ethnicity and religion, which can be interpreted as ‘hate speech’. In this paper we present a supervised machine learning text classifier trained and tested to identify hate speech using data collected from Twitter in the immediate aftermath of Lee Rigby’s murder. The data were annotated by human coders, who were asked to decide whether the tweets they were shown contained hateful and/or antagonistic responses towards minority groups. As “Big Data” is a growing topic of study, and its use is in policy and decision making is being constantly debated at present (González-‐Bailõn, 2013), we discuss the use of supervised machine learning tools to classify a sample of “Big Data”, and how the results can be interpreted for use in policy and decision making. Data from Twitter, and social media more generally, are exceptionally noisy and contain a great deal of grammatical variance, misinformation, and mundane chatter. Due to the veracity of such data, its use in policy making is somewhat hindered. A key intention of this study was therefore produce a classifier in which decision makers could confidently use the results as part of a decision
making process. We include a section on how the classifier can be finely trained to suit the needs of policy makers, minimising error and maximising confidence in results. We then demonstrate how the results of the classifier can be robustly utilized in a statistical model used to forecast the likely spread of hate speech in a sample of Twitter data.
Related Work
The analysis of subjective language has been widely applied to the classification of opinions and emotions in text (Wiebe, 2005). Indeed, sentiment analysis, which aims to annotate text using a scale that is a measure of the degree of negative and positive sentiment within the text, has been applied to data collected from social media to determine emotional differences between genders on MySpace (Thelwall et al., 2010a) and study levels of positive and negative sentiment in Facebook (Ahktar and Soria, 2009) and Twitter comments (Bollen et al. 2011, Thelwall et al., 2011) following real-‐world events.
Specifically focussing on hateful and/or antagonistic content, Greevy and Smeaton (2004) classified racist content in Web pages using a supervised machine learning approach with a bag-‐of-‐words as features. A bag-‐of-‐word (BoW) approach uses words within a corpus as predictive features and ignores word sequence as well as any syntactic or semantic content. This approach can lead to misclassification due to word use in different contexts and, if words are used as a primary features for classification, it has been shown that combining sequential words into n-‐grams (list of words occurring in sequence from 1-‐n) improves classifier performance by incorporating some degree of context into the features (Pendar, 2007). However, an n-‐gram approach can suffer from the problem of high levels of distance between related words -‐ for example if related words appear near the start and near the end of a sentence (Chen et al., 2012). Davdar et al. (2013) used profane words in a social media account username, references to profanities and bullying sensitive topics, and first and second person pronouns to classify antagonistic behaviour on YouTube. Dinakar et al. (2012) focussed on the identification of cyberbullying also using a BoW approach, but also incorporated lists of profane words, parts-‐of-‐speech and words with negative connotations as machine learning features. Furthermore, they included a common-‐sense reasoning approach to classification by using a database that encoded particular knowledge about bullying situations (e.g. associating wearing dresses with males).
Burnap et al. (2013) developed a rule-‐based approach to classifying antagonistic content on Twitter and, similarly to Dinakar et al. (2012), they used associational terms as features. Burnap et al. also included accusational and attributional terms targeted at a person or persons following a socially disruptive event as features, in an effort to capture the context of the term use. Their results demonstrated an improvement on standard learning techniques. Chen et al (2012) identified offensive content by using profanities, obscenities and pejorative terms as features, weighted accordingly based on the associated strength of the term, as well as references to people. They also produced a set of rules to model offensive content, showing an improvement on standard machine learning approaches in terms of a much-‐reduced false negative rate.
Identifying syntactic constructs that tend to be insulting or condescending is a key function of the ‘Smokey’ abusive message classification tool (Spertus, 1997), which uses pattern matching and syntactic positioning of words within text to classify content at a message level. Mahmud et al. (2008) followed a similar approach but also incorporated relationships between terms to identify ‘flaming’ behaviour online. The identification of syntactic relationships within text is possible via the development of parsing tools such as the Typed Dependency parser from Stanford (Marneffe, 2006), though this has yet to be applied to hate speech.
Data Collection
We collected the study dataset from Twitter during a two week time window following the ‘trigger’ event -‐ the murder of Drummer Lee Rigby in Woolwich, UK on the 22nd May 2013. To ensure we maximised the collection of data surrounding the event we used the search term “woolwich”, which would include many references to the events at Woolwich and also the main hashtag surrounding the event “#woolwich”. The hashtag convention is widely used on Twitter to link an individual's thoughts and comments to an event. The two week data collection window was imposed based on three factors. First, existing research that indicates public interest in events typically spikes a short time after the event, and then rapidly declines (Downs, 1972). Second, that the first point was confirmed by tracking the search term ‘Woolwich’ using the Google Trends2 service, which records
the relative number of searches performed on Google over time. Within two weeks, the use of “Woolwich” in Google searches had almost returned to pre-‐event levels. Third, because more than half of all hate-‐related attacks following 9/11 occurred within two weeks of the event, and we wanted to measure the immediate reaction to such events and capture data that perhaps would not otherwise be available to policy decision makers due to time taken to collect, record, and process hate crime results, and therefore be proactive in the first two weeks to reduce harm to targeted social groups in an appropriate manner. A total of 450,000 tweets were collected during the collection time window.
Data Annotation -‐ Crowdsourcing
Building models to classify data according to a pre-‐defined coding scheme is an essential task in Digital Social Research, used for the purposes of understanding social interactions, beliefs, emotions and the like. In this research, once the Twitter data were collected, we built a supervised machine learning classifier to distinguish between hateful and/or antagonistic responses with a focus on race, ethnicity and religion, and more general responses, following the event. To complete this subjective task using large-‐scale data analytics, which is absolutely necessary for the volumes of data produced, we used machine classifiers to learn the features of tweets that are indicative of the class they belong to (hate speech or general response). Once features were learned, we applied the model to the whole dataset. However, it was essential to understand and explain the limitations of the learned model by producing model-‐specific classification performance results, such as precision and recall per class, and confusion matrices (these terms will be explained in detail later).
2http://www.google.com/trends/
Thus, we needed a "gold standard" to test the classification model against. Commonly, this is obtained by sampling from a larger dataset and employing human annotators to label each data point (tweet) according to a coding frame (Burnap et al., 2013). The coding frame serves as a set of categories or classes into which each data point can be classified. Computationally crowdsourcing human annotations is now becoming popular and Web services such as CrowdFlower or the Amazon Mechanical Turk provide programmatic APIs through which researchers can automatically upload a dataset, coding frame, and set of instructions for annotation. The results of the annotation tasks can then be split into training and testing datasets for machine learning.
From the 450,000 tweets collected, we sampled 2,000 to be human coded. Coders were provided with each tweet and the question “is this text offensive or antagonistic in terms of race ethnicity or religion?”. They were presented with a ternary set of classes -‐ yes, no, undecided. We utilized the CrowdFlower online service that allows for Human Intelligence Tasks (HIT), such as coding text into classes, to be distributed over multiple users. Coders or ‘workers’ can sign up to the service to participate in jobs in return for micropayments (small payments set by the job creator based on number of tasks completed to an acceptable standard). Job creators can specify a range of coder requirements such as location and experience, and can verify the level of expertise via test questions. Results from coders can then either be accepted or rejected, based on level of agreement with other coders. We required at least 4 human annotations per tweet and only retained annotated tweets for which at least 3 human annotators (75%) agreed on the class it belonged to, as per the convention is related research (Thelwall et al., 2010b). We removed all tweets with less than 75% agreement and also those upon which no absolute decision could be reached by the coders (i.e. the ‘undecided’ class). The results of the annotation exercise produced a “gold standard” dataset of 1901 tweets, with 222 instances of offensive or antagonistic content (11.68% of the annotated sample), which could be classed as hate speech and we will refer to as the ‘hate speech sample’, and 1,679 instances of non-‐hateful or antagonistic commentary (88.32%), which we will refer to as ‘benign’. 10% of each class was subsequently used as a sample from which to identify appropriate features to build a hate speech classifier. This sub-‐sample was not used when testing the classifier.
Feature Selection
It was evident from the hate speech sample that many of the terms used in hate speech were expletive or derogatory, targeted at specific social groups. The sample contained words that are well known derogatory terms for black, asian and muslim social groups, as well as derogatory adjectives (e.g. “black savages”). It was evident that the words of the tweets were going to be particularly useful features for the classification task. Using the words of the text to be classified, known as a bag-‐of-‐words (BoW) technique, is not a particularly novel approach to text classification, but the frequency of particular unigram (single word) and bigram (two word) terms were overwhelming and needed to be utilized.
Of more interest from a sociological and common sense reasoning perspective were the numerous instances in the hate speech sample of calls for collective action and hateful incitement towards
social groups exhibiting protected characteristics. For instance, there were exclamations such as “send them home”, “get them out”, and “should be hung”. These exclamations clearly follow a pattern that could be encoded in parts-‐of-‐speech notation (e.g. Verb, Pronoun, Noun; Verb, Pronoun, Adverb; Verb Verb Verb(PT)). However, the benign sample also displayed an abundance of similar patterns e.g. “leave them alone”, “they are peaceful”. Thus, parts-‐of-‐speech tagging to produce features to inform the machine classifier was avoided as it seemed highly likely to cause confusion between the classes. Instead, we implemented the Stanford Lexical Parser, along with a context-‐free lexical parsing model, to extract typed dependencies within the tweet text (Marneffe et al., 2006). Typed dependencies provide a representation of syntactic grammatical relationships in a sentence (or tweet in this case) that can be used as features for classification. The following example explains the meaning of such relationships and how they can be used as features to inform the machine classifier.
Consider the sentence:
“Totally fed up with the way this country has turned into a haven for terrorists. Send them all back home”.
The typed dependency parser returns the following output:
[root(ROOT-‐0, Send-‐1), nsubj(home-‐5, them-‐2), det(home-‐5, all-‐3), amod(home-‐5, back-‐4), xcomp(Send-‐1, home-‐5)]
Within the output we can see five instances of typed dependencies. The second instance (nsubj(home-‐5, them-‐2)) identifies a relationship between ‘home’ and ‘them’, with ‘home’ being the fifth word in the sentence and ‘them’ appearing before ‘home’ as the second word. Word order within a sentence is preserved in the type dependency and provides a feature for classification as well as the syntactic relationship between words. The relationship identified by the parser in this case is nsubj, which is an abbreviation of nominal subject. This will include a noun phrase (‘them’), which is the syntactic subject in the sentence, and an associated relational term (‘home’). Linguistically therefore, the term ‘them’ is associated with ‘home’ in a relational sense. Sociologically, this is an “othering” phrase, which essentially distances “them” from “us” through the relational action of removing “them” to their “home”, as perceived by the author of the tweet. Similarly, the third typed dependency (det(home-‐5, all-‐3)) identifies a det relationship, which is short for determiner, where a link is established between a noun phrase and its determiner. The noun phrase here being ‘home’ (as in a place) and the determiner being ‘all’. Again, this falls into an “othering” behaviour, suggesting that the entire social group to which the Woolwich protagonists belonged should have a relationship with ‘home’, which we can assume means the perceived ‘home’ of the social group by author of the tweet (i.e. “not my country”). This combination of linguistics and sociology potentially provides a very interesting set of features for the more nuanced classification of hate speech, beyond the BoW approach that will utilize expletives and derogatory terms. It allows a more common-‐sense reasoning approach to classifying hate speech by considering the
integration of “othering” terms and calls for retribution action into the classification features.
Data Preprocessing and Feature Preparation
Each tweet was computationally transformed into a word vector -‐ a list of all the individual words (tokens) in the tweet. All tokens we transformed to lower case to avoid capitalised version of words being treated as separate features to lower case versions of the same word. Non alphanumeric characters other than those present in emoticons and exclamatory punctuation were removed, stop words were removed, and we stemmed each token to ensure that multiple representations and tenses of a word could be considered as a single features e.g. “attacked”, “attackers”, “attacking” can all be reduced to “attack” so the machine can consider the verb as a single predictive features as well as the various forms of the verb. Tokens within each tweet were then clustered into sequential groups of tokens, or n-‐grams, ranging from 1 to 5 tokens in length to preserve an element of context for each word by encapsulating their surrounding words within a feature. Single tokens, or unigrams, were prominent in the hate speech sample in the form of expletives or derogatory terms. Two-‐token combinations, or bigrams, were also present in the form of combinations of expletives, adjectives and derogatory terms. Three-‐token terms (trigrams) could represent “othering” and incitements of retributional action, such as “send them home” or “get them out”. Four and five token terms contained extended but similar phrases.
The BoW approach used here is fairly unsophisticated as a feature identification methods as it weights each n-‐gram equally as a feature and is likely to lead to confusion within the classification task when words occur frequently in both classes. Therefore, two experiments were conducted at the classification stage where in one experiment all n-‐grams were retained as classification features, while in the second, only hateful and derogatory n-‐grams were retained and the remaining n-‐grams were removed. Classification results were produced for each experiment. It was expected that the hateful n-‐grams would be predictive of hate speech, but we were interested to see if other terms were also statistically efficient predictors.
To produce a more sophisticated classifier capable of learning the syntactic structure of tweets containing hate speech, each tweet was transformed into a set of typed dependencies using the Stanford Parser. Each typed dependency was considered as a unigram feature, and we again performed clustering on all the typed dependencies in a tweet to identify groups of between 1 and 3 typed dependency n-‐grams that represented the syntactic structure of each tweet. The number of possible typed dependency relationships produced by the Stanford model is around 50, and we suspected that not all relationships would be useful for classification. As with the BoW experiments, at the classification stage we performed a two-‐step approach. The first experiment involved testing the classifier using all typed dependencies as features. We then performed a meta-‐analysis to better determine which features were more statistically efficient at classifying hate speech. To achieve this we ran a Bayesian Logistic Regression (BLR) using the typed dependency features extracted from the 10% sample of gold standard hate speech and benign tweets. We used the model output of the BLR to establish a list of statistical coefficients relating to the probability of each typed dependencies n-‐gram occurring in a hateful or antagonistic tweet. The list was sorted to identify the
most likely forms of typed dependency relationship to occur in the hate speech class, and these relationships alone were retained as predictive features when the classifier was retrained and re-‐ evaluated in a second experiment.
Finally, we combined both experiments and produced a final testing scenario to determine if combining the bag-‐of-‐words, typed dependencies, and hateful and derogatory n-‐grams would prove to be the optimal set of features.
Model selection
Given our feature set of specific words and syntactic features, we aimed to create a set of results and related model that could be used to inform policy makers of the risk of hate speech spreading online following events that are likely to incur a hateful or antagonistic response towards a specific social group. To produce experimental results we used the Java Weka machine learning libraries to develop a number of supervised classifiers that were trained and tested using the features discussed in the previous section. Each tweet was transformed into a feature vector -‐ a list of attributes that represent the tweet for the purposes of training a classifier. Each vector included the actual class the tweet belonged to based on the human annotation exercises (reduced to a binary “Yes” or “No” as to whether it was hateful or antagonistic or not), and a list of n-‐grams that either included words, typed dependencies, or a combination of both, depending on the feature set used to train the classifier.
Given the prevalence of individual words or short combinations of words in the hate speech sample, it seems appropriate to implement a classifier that would make decisions based on the likelihood of feature occurrence. We implemented a Bayesian Logistic Regression (BLR) classifier as a probabilistic approach. This classifier identifies statistical coefficients for each feature in a vector based on the likelihood of that feature appearing in any of the classes available (“Yes” or “No”) and uses this to predict the classes of previously unseen tweets.
Rule-‐based approaches to classifying antagonistic content have been shown to produce promising results in previous research and the case of hate speech seemed similar to other work in its accusational and targeted construct. Therefore, we employed a Random Forest Decision Tree (RFDT) as a rule-‐based approach to classification. A decision tree approach was chosen because it iteratively identifies the feature from the vector that maximises information gain in a classification exercise -‐ or put another way, it quantifies the significance of how using one n-‐gram as a rule to classify a tweet as “Yes”, reduces the uncertainty as to which class it belong to. Performing this step multiple times creates a hierarchical and incremental set of rules that can be used to make classification decisions. A Random Forest implementation of a decision tree was used because it iteratively selects a random sub-‐sample of features in the training phase and trains multiple decision trees before predicting the outputs and averaging out the results, maximising the reduction in classification error (Breiman, 2001). The approach combines the results of a number of decision trees to identify the optimal set of rules, which was appropriate in this case because of the amount of noise and grammatical variance within the training and testing data sets.
A Support Vector Machine (SVM) was also used to determine if a spatial classification model would improve or enhance on a probabilistic or rule-‐based model. Feature vectors are plotted in high-‐ dimensional space and hyperplanes (lines that separate the data points) are used to try and find the optimum way to divide the space such that the tweets belonging to “Yes” and “No” classes are separated. Multiple hyperplanes can be used and the optimal hyperplane will be the line that maximizes the separation between classes. The rationale for the use of an SVM classifier was to determine whether hate speech tweets and general responses to an event could be separated by spatial differences in lexical or syntactic features, as well as with probability and rules to determine predictive feature efficiency.
In addition to the three individual classifiers, we also implemented an “ensemble” classifier where a combination of all three was used to make a final classification decision. We used a voting meta-‐ classifier, which produces a classification result for each base classifier (BLR, RFDT and SVM) during the training phase, before making a decision on which model to use based on its prediction accuracy. A choice can be made based on the base classifier with the maximum probability or minimum probability; the results of all base classifiers can be averaged; or a majority vote can be taken. We implemented the maximum probability to make classification decisions, with an aim of reducing error based on selecting the classification function that is most statistically likely to reduce error.
Classification Results
A ten-‐fold cross validation approach was used to train and test the supervised machine learning methods. This approach has previously been used for building machine classifiers for short text (e.g. Thelwall et al., 2010b). It functions by iteratively training the classifier with features from 10% of the manually coded dataset, and classifying the remaining 90% as ‘unseen’ data, based on the features evident in the cases it has encountered in the training data. It then determines the accuracy of the classification process and moves on to the next iteration, finally calculating the overall accuracy.
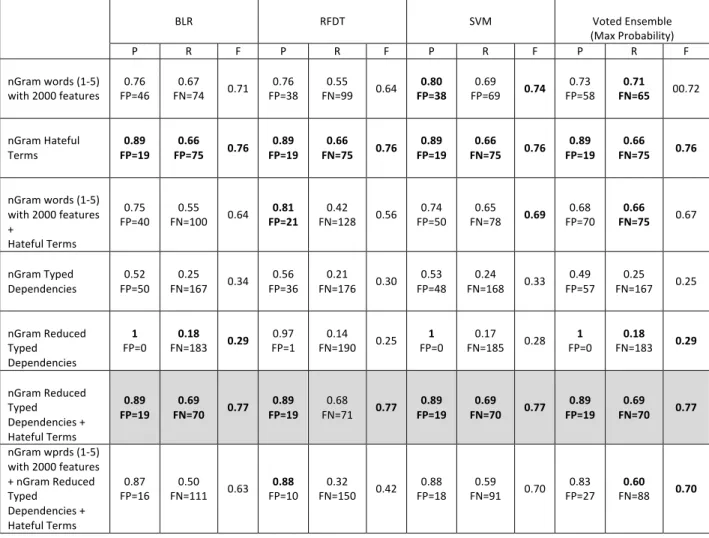
The results of the classification experiments are provided in Table 1 using standard text classification measures of: precision (i.e. for class x, how often are tweets classified as x when they should not be – a measure of false positives); recall (i.e. for class x, how often are tweets not classified as x when they should be – a measure of false negatives); and F-‐Measure, a harmonized mean of precision and recall. The results for each measure range between 0 (worst) and 1 (best). The formulae for calculating these results are as follows (where TP = true positives, FP = false positives, TN = true negative and FN = false negative):
Precision = TP/TP+FP
Recall = TP/TP+FN
F-‐Measure = 2x((PxR)/(P+R))
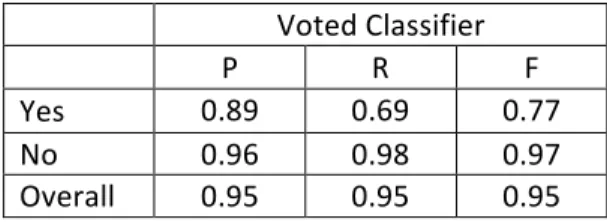
Because of the specific interest in the accurate detection of hateful and antagonistic content, the results reported in Table 1 are the precision, recall and f-‐measure for the Yes class ONLY. The number of false positives (instances where benign content has been classified as hate speech) and false negatives (where hate speech has been classified as benign) are also reported. Table 2 provides results for the best performing classifier and includes both Yes and No classes as well as an overall performance score. Table 3 presents the confusion matrix for the best performing classifier with a breakdown of classifier error.
In Table 1, the bold text indicates the best performance results for precision, recall, FP and FN for each feature set. In cases, such as the n-‐gram hateful terms feature set, the whole row is bold because there was no difference between the performance of the classifiers. The shaded boxes indicate the best overall performing feature set for each classifier.
BLR RFDT SVM Voted Ensemble (Max Probability) P R F P R F P R F P R F nGram words (1-‐5) with 2000 features 0.76 FP=46 FN=74 0.67 0.71 FP=38 0.76 FN=99 0.55 0.64 FP=38 0.80 FP=69 0.69 0.74 FP=58 0.73 FN=65 0.71 00.72 nGram Hateful Terms 0.89 FP=19 FP=75 0.66 0.76 FP=19 0.89 FN=75 0.66 0.76 FP=19 0.89 FN=75 0.66 0.76 FP=19 0.89 FN=75 0.66 0.76 nGram words (1-‐5) with 2000 features + Hateful Terms 0.75 FP=40 FN=100 0.55 0.64 FP=21 0.81 FN=128 0.42 0.56 FP=50 0.74 FN=78 0.65 0.69 FP=70 0.68 FN=75 0.66 0.67 nGram Typed Dependencies 0.52 FP=50 FN=167 0.25 0.34 FP=36 0.56 FN=176 0.21 0.30 FP=48 0.53 FN=168 0.24 0.33 FP=57 0.49 FN=167 0.25 0.25 nGram Reduced Typed Dependencies 1 FP=0 FN=183 0.18 0.29 FP=1 0.97 FN=190 0.14 0.25 FP=0 1 FN=185 0.17 0.28 FP=0 1 FN=183 0.18 0.29 nGram Reduced Typed Dependencies + Hateful Terms 0.89 FP=19 FN=70 0.69 0.77 FP=19 0.89 FN=71 0.68 0.77 FP=19 0.89 FN=70 0.69 0.77 FP=19 0.89 FN=70 0.69 0.77 nGram wprds (1-‐5) with 2000 features + nGram Reduced Typed Dependencies + Hateful Terms 0.87 FP=16 FN=111 0.50 0.63 FP=10 0.88 FN=150 0.32 0.42 FP=18 0.88 FN=91 0.59 0.70 FP=27 0.83 FN=88 0.60 0.70
Table 1 -‐ Hate Speech Classification Results
The results suggest that overall the most efficient features for classifying hate speech are n-‐gram typed dependencies combined with n-‐gram hateful and antagonistic terms. In fact, the hateful terms alone achieved the same precision performance but had a lower performance for recall. The number of false negative results (missed instances of hate speech) was 7% higher when using hateful terms alone. This is an interesting result as it provides evidence to suggest that human annotators identify hateful or antagonistic content on Twitter that does not necessarily contain hateful or antagonistic terms and requires a more nuanced representation of what is deemed hate speech when aiming to classify tweets. The use of a more sophisticated set of features as well as a bag-‐of-‐words has successfully contributed to this requirement. 7% improvement may seem fairly small, but considering the size of the initial corpus was 450,000, and in the annotated random sample of these data around 11% was considered hate speech by the human annotators, we could infer that there were around 49,500 instances of hate speech in the corpus. Overlooking 7% of these would lead to more than 3,000 hateful or antagonistic tweets being missed, so for policy making purposes, the 7% improvement achieved by introducing the typed dependency features is significant if an accurate snapshot of the level of hateful and antagonistic emotive responses to an event is to be achieved.
The number of false positives in the best performing classifiers was 19, which constitutes 0.009% of the test data. Other classifiers reduced the number of false positive below 19, to 0 in once instance, but the recall performance in these instances was far below that of the best performing classifiers meaning that a reduction in false positives was also accompanied by an increase in false negatives. It is essential to retain a balance of minimized false positives and false negatives. In all cases, the voted ensemble classifier matched or improved upon the recall of each of the individual base classifiers. This suggests that combining the output of the respective probabilistic, rule-‐based and spatial classifiers, and selecting the classification decision of maximum probability can assist policy decision makers in reducing the oversight of hateful or antagonistic content. While the base classifiers all achieved fairly similar results using the most efficient features set, given the improvement of recall across all other experiments when using a voted classifier, it would seem pertinent to consider the use of the voted classifier as a first choice when applying the hate speech classifier to unseen data. The full results of the hate speech classifier are reported in Table 2. It is clear that the precision and recall of the non-‐hateful responses is very high (P=0.96, R=0.98). The precision of the ‘Yes’ class is also high (P=0.89), showing a low number of false positives, but there are improvements to be made to the recall of the ‘Yes’ class (R=0.69) before significant confidence can be given to the results for policy and decision making purposes. Table 3 shows 70 mis-‐ classifications where hate speech was classified as a benign response by the classifier, suggesting a further refinement is required to detect more discrete hateful and antagonistic content.
Voted Classifier P R F Yes 0.89 0.69 0.77 No 0.96 0.98 0.97 Overall 0.95 0.95 0.95
Human Coders Yes No Machine Yes 152 70 No 19 1660
Table 3 – Voted classifier confusion matrix
To give some insight into the qualitative narrative of hate speech we have provided some instances of typed dependencies that were probabilistically more likely to occur in hate speech than the benign class in Table 4. We can see that the content of tweets is focussing on a response to religious and ethnic minority social groups from the wider population (e.g. black muslims). There are phrases suggestive of incitement to respond with actions (e.g. burn korans) and claims of well founded or justified discrimination against social groups (e.g. ‘I told you black people...’). Given this reflective and responsive narrative it would seem pragmatic to include more semantic rules and constructs into feature identification in future in order to improve classifier performance.
Typed Dependency Qualitative Description
det(religion-‐5 a-‐4) Determiner – specific reference to a noun phrase – discussing ‘a’ ‘religion’ in a particular context
amod(people-‐7 black-‐6) Adjectival Modifier – descriptive phrase related to a noun phrase – discussing ‘people’ who are ‘black’
aux(burn-‐6 to-‐5) dobj(burn-‐6 korans-‐ 9)
Auxiliary – a form of ‘be’, ‘do’ or ‘have’ – action phrase using ‘burn’ and ‘korans’
amod(muslim-‐40 black-‐39) Adjectival Modifier – descriptive phrase related to a noun phrase – discussing ‘muslims’ who are ‘black’
det(muslim-‐40 a-‐38) amod(muslim-‐ 40 black-‐39)
Determiner – specific reference to a noun phrase – discussing ‘a’ ‘muslim’ in a the context of a ‘black’ ‘muslim’
dobj(told-‐4 you-‐5) amod(people-‐7 black-‐6)
Direct Object – an accusatory object of the verb – ‘told’ ‘you’ (e.g. ‘I told you’) in the context of ‘black’ ‘people’
advmod(seen-‐3 just-‐2) dobj(seen-‐3 video-‐4) dobj(getting-‐9 shot-‐10)
Adverbial Modifier -‐ descriptive phrase related to a verb – ‘just’ ‘seen’, i.e. commenting on what has just been witnessed
advmod(sad-‐16 really-‐15) Adverbial Modifier -‐ descriptive phrase related to a verb – ‘really’ ‘sad, i.e. commenting on what has just been witnessed
dobj(burn-‐6 korans-‐9) Direct Object – an accusatory object of the verb – ‘burn ‘korans
Using a Classifier to Inform a Statistical Model
A cautionary caveat
Once a supervised machine learning classifier has been developed it can be used on a larger sample to classify new and unseen data, and inform policy decisions directly or via additional models. First and foremost it is essential to remember that supervised machine learning classifiers build models of what they perceive to be the features indicative of specific classes -‐ in this case, hateful and antagonistic content. As a result, if new or unseen features occur, such as different types of language or content with mixed meaning, it can cause confusion in the classifier and produce inaccurate results. We can classify new instances, but we must always bear in mind the limitations in the existing model (i.e. not all instances of hate speech were identified by our model), and that variance in the way people respond to such events may compound this.
That said, what we have tried to achieve with the classifier is to assist human decision making using a machine to handle the large volumes of data produced by the general public in response to a large scale emotive event. The results of the hate speech classifier are reasonably high, especially when considering that around 5% of our human annotated sample had to be removed because the three out of four humans could not agree which class a tweet belonged to. It is worth remembering that while machine learned models are not always accurate in their judgement, humans are also susceptible to disagreement and confusion.
Hate speech and Contagion modelling
In the following example we demonstrate how the supervised machine learning classification model of hate speech can be applied to whole corpus of 450,000 tweets to help determine to what degree hateful or antagonistic content is spreading -‐ a measure of the contagion effect of hate speech in response to a specific event. This could help inform those responsible for minimising the risk of social disorder through community reassurance, local policing, and the online governance of hateful and antagonistic content, as to whether hate speech is likely to spread.
One way to measure the impact of hate speech on the spread of information on Twitter is to treat hate speech as a predictive feature in a statistical regression model where the dependent variable (the outcome are trying to predict) is the number of retweets a tweet is likely to receive. Theoretically, the more retweets a tweet receives, the more people are likely to see it, increasing the risk of public exposure and opportunity to propagate and respond to hate speech. By measuring the statistical associated strength of hate speech within a model of retweet counts, we can determine the likelihood of hateful and antagonistic content being retweeted, and therefore spreading to a large number of people. We can define a tweet that has been retweeted a large number of time as an information flow (Lotan, 2011).
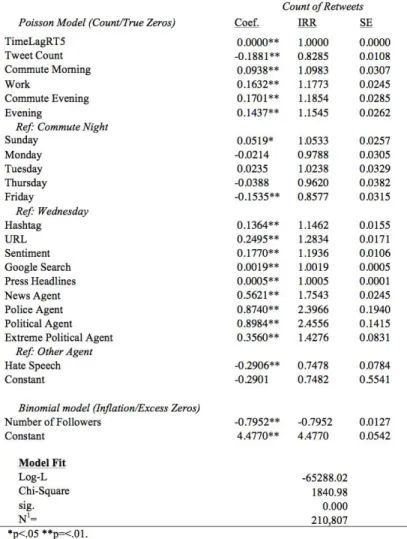
Table 5 shows the result of a zero-‐inflated poisson model of information flow ‘size’. The dependent variable is a count measure of the number of retweets a tweet actually received following the Woolwich event. The statistical predictors of the count include the number of followers of the person sending the tweet, the time of day the tweet was sent, the content of the tweet (hashtags, URLs), the sentiment polarity (+ve, -‐ve), the number of press headlines on the day the tweet was made, and the type of agent sending the tweet (e.g. press, police, politician). The data for these features were all derived from the dataset collected from Twitter. For more details on how these were derived we recommend the reader study a related paper that examined the social media reaction in greater detail (Burnap et al., 2014). In this instance we are only interested in the impact of hate speech as an example of how machine classification can help inform the modelling of online social reaction.
If we look at the IRR column in Table 5 we can see the strengths of association for each predictor variable with the dependent ‘retweet’ count, as indicated by the incidence rate ratio (IRR). We can use the IRR to report the strength of causal associations between certain factors and the information flow size, enabling us to identify quantitatively which factors are more important than others. Where an IRR > 1, the difference is associated with a positive increase in the dependent variable (retweet count), so in the case of the ‘URL’ variable which records whether or not a tweet contains a URL, the results indicate that the rate of retweet for tweets containing a URL is 1.28 times higher than the rate for tweets without a URL. Thus, a URL increases the chances of a tweet being retweeted. Where an IRR < 1, there is a negative effect. If we look at the ‘Hate Speech’ predictor we see the IRR is 0.75 (rounded to 2dp), which means that the inclusion of hateful or antagonistic content in a tweet reduces the rate of retweet by a factor of 0.75, suggesting that a response to this event that contains a hateful or antagonistic element, as determined by the machine classifier, is in fact reducing the likelihood of the tweet being widely spread.
For policy makers, the combination of the hate speech machine classifier with the statistical predictive model of the retweet likelihood given the features of the tweet could be useful in determining the changing dynamic of hate speech on Twitter over time, and as an event unfolds. At any point in time a new corpus of tweets can be collected via the Twitter API, and the number of retweets each tweet has received is available from the metadata provided by Twitter. If the machine classifier is used to detect hate speech within the corpus, and the statistical model is subsequently rerun, the difference in IRR from one period of time to another can be illustrative of the changing dynamic of hate speech in Twitter over time. For instance, if the IRR for the ‘Hate Speech’ predictor in the model is 0.75 at time x, and 0.95 at time y, it suggests an increase in the rate of retweets containing hate speech and therefore provides an indication that hateful and antagonistic content is actually spreading more at time y.
Table 5 -‐ Zero-‐inflated poisson regression model predicting counts of retweets
Conclusion
In this paper we have developed a supervised machine learning classifier for hateful and antagonistic content in Twitter. The purpose of the classifier is to assist policy and decision makers in monitoring the public reaction to large scale emotive events, such as the murder of Drummer Lee Rigby in Woolwich in 2013. Previous research showed that 58% of hate crimes following 9-‐11 were perpetrated 2 weeks following the event (4 percent of the at-‐risk period). Data are available in near-‐real time from online social networks and microblogging websites such as Twitter, which can allow us to monitor the prevalence of hateful and antagonistic responses online in the period immediately following the event, where risk of hateful responses are at their highest. Unacceptably hateful and antagonistic responses have begun to be prosecuted and have lead to imprisonment of the person posting the tweet -‐ possibly as part of a risk reduction response by the judicial system.
The classification results showed very high levels of performance at reducing false positives and produced promising results with respect to false negatives. Our implementation of individual