Contents lists available atScienceDirect
Heliyon
www.elsevier.com/locate/heliyon
Sleep-wake
stages
classification
using
heart
rate
signals
from
pulse
oximetry
Ramiro Casal
a,b,d,∗,
Leandro
E. Di Persia
b,c,
Gastón Schlotthauer
a,b,daLab.deSeñalesyDinámicasnoLineales,FacultaddeIngeniería,UniversidadNacionaldeEntreRíos(UNER),Argentina bConsejoNacionaldeInvestigacionesCientíficasyTécnicas(CONICET),Argentina
cInstitutodeInvestigacionenSeñales,SistemaseInteligenciaComputacional, UniversidadNacionaldelLitoral, CONICET,Argentina dInstitutodeInvestigaciónyDesarrolloenBioingenieríayBioinformática, UNER, CONICET,Argentina
A
R
T
I
C
L
E
I
N
F
O
A
B
S
T
R
A
C
T
Keywords: Computerscience Biomedicalengineering Sleepapnea Pulseoximetry HeartrateAutomaticsleepstaging
Themostimportantindexofobstructivesleepapnea/hypopneasyndrome(OSAHS)istheapnea/hyponeaindex (AHI).TheAHIisthenumberofapnea/hypopneaeventsperhourofsleep.Algorithmsforthescreeningof OSAHSfrompulseoximetryestimateanapproximationtoAHIcountingthedesaturationeventswithoutconsider thesleepstageofthepatient.Thispaperpresentsanautomaticsystemtodetermineifapatientisawakeor asleepusingheartrate(HR)signalsprovidedbypulseoximetry.Inthisstudy,70featuresareestimatedusing entropyandcomplexitymeasures,frequencydomainandtime-scaledomainmethods,andclassicalstatistics. Thedimensionoffeaturespaceisreducedfrom70to40usingthreedifferentschemesbasedonforwardfeature selectionwithsupportvectormachineandfeatureimportancewithrandomforest.Thealgorithmsweredesigned, trainedandtestedwith5000patientsfromtheSleepHeartHealthStudydatabase.Intheteststage,10-foldcross validationmethodwasappliedobtainingperformancesupto85.2%accuracy,88.3%specificity,79.0%sensitivity,
67.0%positivepredictivevalue,and91.3%negativepredictivevalue.Theresultsareencouraging,showingthe possibilityofusingHRsignalsobtainedfromthesameoximetertodeterminethesleepstageofthepatient,and thuspotentiallyimprovingtheestimationofAHIbasedononlypulseoximetry.
1. Introduction
Sleepplays averyimportantrolein well-beingandphysiological recovery.Thegoldstandardtestforthestudyofsleeppathologiesis polysomnography(PSG),whichconsistsofthesimultaneousrecording ofseveralphysiologicalsignalssuchaselectroencephalography(EEG), electrocardiography(ECG),electromiography(EMG),respiratoryeffort, oronasalairflow,peripheraloxygensaturation(SpO2),and
electroocu-lography(EOG),amongothers.ThePSGissupervisedbyatechnicianin asleepmedicalcenterspeciallyconditioned,anditsanalysisrequiresa tedious scoring, oftenby hand withthehelpof a software[1]. The scoringhasalotofvariabilityamongdifferentprofessionals[2].Due tothesecharacteristicsandthelimitednumberofbeds,thePSGiscost intensiveanditsavailabilityisscarce,generatinglongwaitinglists. Fur-thermore,manypatientsarereluctanttospendthenightinthesleep laboratoryorhavedifficultytofallingsleep[3].
Duetocomplexity,limitedcapacity,andhighcostsassociatedtothe PSG,thereisanincreasinginterestinreducingtheneedforcomplete
*
Correspondingauthorat:Lab.deSeñalesyDinámicasnoLineales,FacultaddeIngeniería,UniversidadNacionaldeEntreRíos(UNER),Argentina.E-mailaddress:rcasal@conicet.gov.ar(R. Casal).
PSGstudies.Manyapproacheshavebeenproposedtoperformscreening ofsleeppathologies.Pulseoximeterisanidealchoiceforthescreening duetoitslowcost,accessibilityandsimplicity[3].Forthis,itstands outamongothertechniques,suchascardiacandrespiratorysounds[4], ECG[5],nasalairwaypressure[6] andcombinationsofvarioussignals [7].
TotalsleeptimeisanimportantoutcomeofPSGfordiagnosing sev-eralsleep disorders.One of these pathologies,in which the authors arecurrentlyinterested,istheobstructivesleepapnea/hypopnea syn-drome(OSAHS).OSAHSisoneof themost prevalentsleepdisorders [8] anditischaracterizedbyrepetitiveinterruptionsoftherespiratory flow,causedby pharyngeal collapses duringsleep. These upper air-wayobstructionsproducepartialortotalreductionintheairflow.This syndromecauses increased frequency of awakenings, reduced blood oxygen saturation,sleep fragmentation and, consequently, excessive daytimesleepiness [9]. Furthermore,itisassociatedwithahighrisk ofacutepulmonaryandsystemichypertension,nocturnalarrhythmias, ventricularfailureandstroke,cognitivedecline,andsuddendeath[10].
https://doi.org/10.1016/j.heliyon.2019.e02529
Received27August2018;Receivedinrevisedform4April2019;Accepted24September2019
2405-8440/©2019TheAuthors.PublishedbyElsevierLtd.ThisisanopenaccessarticleundertheCCBY-NC-NDlicense (http://creativecommons.org/licenses/by-nc-nd/4.0/).
Thepotentialsocialconsequencesofthisdisease,suchasaccidents, in-creasedmorbidityandunproductiveness,amongothers,makeitoneof themainpublichealthproblemsintheworld.Thenumberofpatients diagnosedandtreatedforOSAHShasincreaseddrasticallyinthelast fewyears[11,12].Sleepapneacanbeeasilytreatedapplyinga con-tinuouspositiveairwaypressurethroughthenoseusingatightmask [9].
ThemostimportantindexofOSAHSseverityistheapnea/hypopnea index(AHI),whichrepresentsthenumberofapnea/hypopneaevents perhourofsleep.TheOSAHSisclassifiedasnormal,mild,moderate orsevereifitbelongsto theintervals[0,5),[5,15),[15,30)orgreater than30apneaorhypopneaeventsperhourofsleep,respectively[13]. Thisimpliestheneedtoknowifthepatientwassleeping(inanystage ofsleep)orawakewhenanrespiratoryeventwasdetected.
The upper airway obstructions associated with apnea/hypopnea eventsresultsinadropofoxygensaturationlevels[14].Severalworks havebeen carriedoutwiththeaimofdetectingtheseevents usingpulse oximetersignals[15,16].Inthesestudies,theoxygendesaturation in-dex(ODI)is estimatedasanapproximation totheAHI.However,it is importanttopointout thatthese worksdo not takeinto account whetherthepatientisornotasleep.Insomeoftheseworks,theODI wasreportedasarelationbetweenthenumberofdetected desatura-tionsandthetotal sleeptime(TST) estimatedusingtheEEG,which waspreviouslyassumedasnotaccessible.Insomeotherpublications, thetotaltimeofthestudy(TT)wasused,whichintroducesasignificant bias(thevalueofAHIwillbeunderestimatedbythisapproach)[17]. TSTestimationfromthesamesignalsusedtoestimatethenumberof apneas/hypopneaeventscouldimprovethereportedAHIwithout in-creasingthecomplexityofthestudy.Beingabletoestimatethetotal sleeptimefromsignalsobtainedwithapulseoximeterwillbeagreat complementtoimprovethesescreeningdevices.
Althoughwearefocusedonthediagnosisofapnea,theresultsofthis workmaybeusefulformanyotherapplications.Forexample,drowsy driversisanimportantfactorinmosttrafficaccidents.Automatic sys-temswiththegoalofdetectandpreventsleepareanactiveresearch field.Mostofthemusecamerastoassessthelevelofsleepinessby de-tectionofphysiologicaleventsrelatedtofatigueanddrowsiness[18]. Duetoitscharacteristics,ouralgorithmcanbepartofoneofthese sys-temsandprovidecomplementaryinformation.Dailylifeapplications relatedwithsleepmeasuresfrompersonalhealthmonitoringdevices arecurrentlyunderspotlight [19]. Insummary,any criticalworkin whichthesleepinesscancauseaccidentsandmaterialorhumanlosses canbenefitfromapplicationssuchastheonedevelopedinthispaper.
Intheliterature,there aremanyresearchersaddressingthe auto-maticsleepstagingproblem.Thestateoftheartresultsareobtained usingEEGsignals,sometimesextractinginformationfromother com-plementary signalssuchEOG,EMG, andothers.Inpursuit ofobtain home-based diagnosis devices, there aremany studieson automatic sleepstagingwithsignalswhoserecordingandprocessingis simpler thanEEG.
ManyauthorshavestudiedthedynamicofHRvariability,obtaining byprocessingtheECG,duringsleep[20,21].Theseworkshavemade possible thatAdnaneetal.[22],Xiaoetal.[23] andYücelba¸s[24] used ECGtoclassifythesleepstage.Adnane onlyconsideredtwoclasses, awakeandasleep,whileYücelba¸sandXiaoconsideredthree,awake, REMandnon-REMstages.Whentheirresultsareanalyzed,itcanbe seenthattheworksthatconsideredlongerperiodsobtainedbetter re-sultsthanthosethatused30 s segments,basedontherulespublished bytheAASM[1].However,consideringlongerperiodsisan unrealis-ticsituationsinceasthelengthincreases.Thereisagreaterprobability thatthesegmentscontainamixtureofawakeandasleepstages.This problemwillbeaddressedinmoredetailinthediscussionsection.
Thereareotherworksthattrytoexploittherelationshipbetween HRandsleepstagesinthesamewayasthosethatuseECG,butusing photoplethysmography(PPG).Beattieetal.[25] usedPPGsignalsand accelerometer,considering5 classes.Thedatabase wascomposedby
self-reportednormalsleepers.TheUçaretal.research[26] usedPPG andheartratevariability(HRV)from PPG.Theyclassified in awake andasleep.Animportantlimitationofalltheseworksisthatthesizeof thedatabasesusedissmall,soitisdifficulttoclearlydeterminetheir generalizationcapability.
Motivatedbythedrawbacksofscreeningdevicesforsleepdisorders, aswellasbythecurrentchallengestoestimatesleepmeasuresthrough mobileandwearabledevices,andbeinginspiredbytheseprevious re-searchers,theaimofthisworkistoclassifythesleepstageinawake(W) orasleep(S),regardlessofthecorrespondingsleepstage.Weonlyhave anestimateof theheartrate(HR)fromPPG,insteadof ECG,which isaffectedbythelowertemporalandfrequencyresolutions.Further, weuse alarge databasewiththeintentionthat theresultshave the minimumriskofoverfitting.Theclassificationwillbe doneapplying machinelearningtechniques.Inthefeature extractionstage, weuse informationtheorytools,suchasdispersion [27], approximate[28], sample[29], fuzzy [30] and Renyi [31] entropies, andmethodsfor frequencyandtime-frequencyanalysis[32].Further,classicalstatistics werecalculated.Wesupposethesefeaturescanbeabletodiscriminate thedifferentdynamicspresentedinHRseriescorrespondingtoawake andsleepstages[20,21].Then,weappliedafeatureselectionscheme togetherwiththeclassification.Finally,theselected systemistested withpatientsdataneverusedintraining.
2. Materials
2.1. Oximetrysignals
PPGisanopticmeasurementtechniquewidelyusedinbothclinic andresearch.Itdetectschangesinbloodvolumethroughadevice con-sistingofalightsourceandaphotodetector.ThePPGsignalresultsfrom thelight interactionwithbiologicaltissues,namely, thebalance be-tweenscattering,absorption,reflection,transmissionandfluorescence ofthesignal.Severalphysiologicalvariablescanbeestimateddirectly andindirectlyfromthePPGsignal[33].
Thearterialoxygensaturation (SaO2)is thefraction ofsaturated
hemoglobinrelativetototalhemoglobininblood.Thepulseoximeters, devicesbasedonPPG, allowanoninvasiveestimationof SaO2,
com-monlyreferredasperipheraloxygensaturation(SpO2),usingtwolight
sources(redandinfrared)thatpresentsabsorptiondifferencesdueto thehemoglobinpresence[34].TheSpO2isveryusefulforthescreening
ofOSAHS,sincethenumberofapnea/hypopneaeventscanbe approx-imatecountingthenumberofdesaturations.
Inaddition,pulseoximetersprovideaHRestimationfromthe pul-satilecomponentofPPG.Themostcommonalgorithmsconsistof dig-italfiltersandzeroscrossingdetector[33], althoughthere aremany researchworkswiththeobjectiveofdevelopingalgorithmstoreduce themovementartifactsthatgreatlyaffectthesignal[35].
2.2. HRandsleepstages
Thesleephasanorderlyinternalstructureinwhichdifferentstages aredetermined.Thesleepstagesareclassifiedinwakefulness,twostages oflightsleep,twoofdeepsleepandrapideyemovementsleep(REM),which aredifferentiatedinthebasisoftypicalpatternsandwaveformsin sig-nalsofEEG,EOCandEMG.Thesesleepstagesarelabeledinconsecutive
30s longsegments.Thisresultsinasleepprofileorhypnogram. Theregulationoftheautonomicnervoussystemchangeswiththe sleepstages.Inthisway,HR,bloodpressure,andrespiratoryrate de-creasetoadaptareduced metabolismduringsleep.Theaverage HR fallssteadilyfromthewaking statestodeepsleep. DuringREM,HR increaseslightlyandpresentsgreatervariabilitythanduring wakeful-ness[20].TherelationshipbetweensleepstagesandHRisshowninthe Fig.1.Thisworkisbasedonthesephysiologicalphenomenainorderto discriminatethestatesofawakeandasleep.
Fig. 1.HypnogramandHR.Thestatesofawake(W)andasleep(S)areshown inthehypnogram(black).Thedynamicalchangesbetweenthesestates canbe noticedintheHRsignal(blue).
Table 1
CharacteristicsofthestudypopulationinSHHSVisit 1. SHHS 1 (min, max)
n 5804
Age (years) 63.1 ± 11.2(39.0,90.0)
Female (%) 52.3%
Epworth sleepiness scale 7.8 ± 4.4(0.0,24.0)
Arousal index (/hr) 19.2 ± 10.7(0.0,110.4) AHI (/hr) 9.6 ± 12.7(0.0,115.8) TST(min) 587.7 ± 107.6(35.0,858.0) BMI (kg/m2) 28.2 ± 5.1(18.0,50.0) TST/TT(%) 74.2% 2.3. Database
Thesetofbiomedicalsignalsusedinthisarticlewasobtainedfrom theSleepHeartHealthStudydataset.Thisdatasetwasdesignedto in-vestigatetherelationshipbetweensleep-disorderedbreathingand car-diovascularconsequences.SHHSdatabaseis dividedintotwosubsets ofPSG records,theSHHSVisit1andSHHSVisit2,obtainedseveral yearslaterwiththeaimofstudyingtheevolutionofpatients.ThePSG recordswereacquiredautomaticallyathomeofpatientswith supervi-sionofspecializedtechnicians[36].Fulldetailscanbefoundin[37].
The SHHScontains severalsignals corresponding toaPSG study collectedontwelvechannels:SpO2,HR,chestwallandabdomen
move-ment,nasal/oralairflow,bodyposition,EEG(twocentral,onefor re-dundancyincaseoffailure/loss),bilateralEOG,chinEMGandECG. Theoximeterprovidestwosignals,HRandSpO2,anditalsogivesa
qualitystatussignalthatprovides informationaboutthesensor con-nectionstatus.InthisworkonlytheHRandthequalitystatussignal areused.InfutureworkswewillincorporatetheSpO2signaltodetect
apnea/hypopneaevents.
InSHHSdatabase,SpO2 signalshaveasamplingrateof1Hz,
res-olutionof1%andaccuracyof±2%intherangeof70%to100%.Their performancesignificantlydecreases forvalues belowthis range.The HRsignalbasedonpulseoximeterhasasamplingrateof1Hzanda precisionof3beatsperminute.
Inthis work,theSHHS visit1was used. According totheSHHS 1Protocol,all therecordswereprocessedwithasoftwaresystemto provide preliminaryestimatesof theAHI. Then,therecordingswere manuallyscoredonscreen,withannotationsofsleepstages,arousals, oxygendesaturation,andrespiratoryevents.Table1showsasummary ofthecharacteristicsofthedatabaseused.5000patientswererandomly selectedtobeusedintheexperimentsdetailedbelow.Fordetailonthe sleepstageannotationprotocol,referto[36,37].
3. Methods
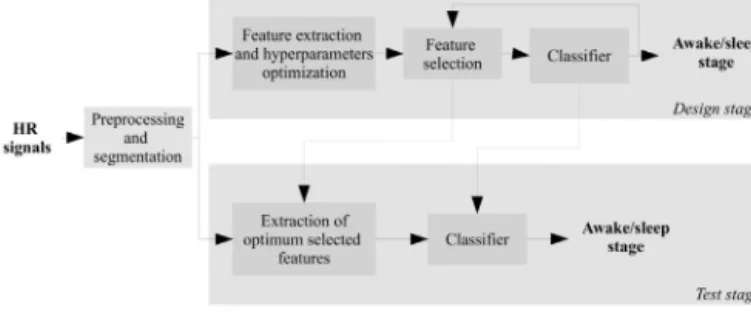
3.1. Systemoverview
Theschemeof thealgorithmisshown in2.First,theHRsignals frompulseoximeterwerepreprocessedandsegmentedintowindowsof length𝐿forthe5000patients,asindicatedbelow.SHHSdatasetwas
Fig. 2.Schemeofthealgorithm.Inthedesignstage,thefeatureextractionand selectionisperformed.Intheteststage,thedesignsystemistestedwithnew data.
splittedintotwosubsets:500subjectswererandomlyselectedinorder tooptimizethedesignandtoselectthefeatures(topofFig.2),and theremaining4500subjectswereusedtotrainandtesttheclassifier (bottom ofFig.2).
Inthedesignstage,asetoffeatureswasextractedfromeach win-dow,optimizing its hyperparameters in order tomaximize thearea underROCcurve(AUC)[38].Then,thefeatureswerestandardizedto havezeromeanandunitvariance.Thefeatureselectionwasperformed alongwiththeclassification,usingtwodifferentschemes:forward fea-tureselection(FFS)andsupportvectormachine(SVM),andvariable selectionbasedonrandomforest(RF).Thek-foldcrossvalidation tech-niquewasusedtovalidatetheclassifierperformance.
Finally,thebestsystemobtained inthe designstagewastrained andvalidatedwiththeremaining4500subjectsusingak-foldapproach. Thereisnotaformalruletochoose𝑘aslongasthesizeofthedatabase allowstoobtain𝑘partitionswithasufficientnumberofobservations tocalculatethereliablestatistics.Weset𝑘= 10forthisproblembased onrecommendationsfrom[39,40].
3.2. Preprocessing
ThepulseoximetersignalsavailableinSHHSdatasetprovidea com-plementarysignalwithinformationaboutthestateoftheoximeter.The statussignalwasusedtomasktheHRsignal,removingtheinvaliddata. Then,welinearlyinterpolatebetweenthepreviousandposteriorvalid data.
Then,theHRrecordswerestandardizedinorder toreduce inter-subjectvariability.Then,thesignalsweresegmentedintonon-overlap windows of length 𝐿, considering only the segments corresponding completelytoasinglestate: awakeorasleep. Thevalues of 𝐿 were variedfrom𝐿= 30to𝐿= 300instepsof30.Nootherprocessingfor artifactor noise reductionwas used, asour objectiveis tokeepthe methodassimpleaspossible,tooperateintherawsignal,aimingat lowpowerwearabledevices.
3.3. Features
TheinformationcontainedintheHRsignalwassummarizedinto a set of features based on informationtheory, frequency and time-frequencydomain,andclassicstatistics.Intotal,70featureswere ex-tracted.Abriefdescriptionofthemostrelevantonesisgiveninthis section.
3.3.1. Approximateentropy
Approximateentropy(ApEn),introducedbyPincus[28],isa mea-sureof dataregularity. Agreater irregularity in asignalproducesa higherApEn value,andviceversa.ForanN-dimensionaltimeseries, ApEn dependsonthreeparameters:theembeddingdimension𝑚, the embeddingdelay𝜏andthethreshold𝑟.ApEn hasbeenwidelyusedas anon-linearfeaturetoclassifydifferentdynamics.
Let 𝑥[𝑛] atimeseriesoflength 𝑁. Then,𝑀=𝑁− (𝑚− 1)𝜏 state vectorscanbereconstructeddoing𝐱𝑚
𝑖 = [𝑥[𝑖],𝑥[𝑖+𝜏],…,𝑥[𝑖+ (𝑚− 1)𝜏]],
where𝑖= 1,2,…,𝑀[41].Then,theApEn isdefinedas[28]:
ApEn(𝑚, 𝜏, 𝑟, 𝑁) =𝜙𝑚(𝑟) −𝜙𝑚−1(𝑟), (1) with 𝜙𝑚(𝑟) = 1 𝑀 𝑀 ∑ 𝑖=1 ln 1 𝑀 𝑀 ∑ 𝑗=1 𝜃(𝑑(𝐱𝑚𝑖,𝐱𝑚𝑗), 𝑟), (2)
where𝑑(⋅)is a distancemeasure between statevectorsand𝜃(⋅)is a kernelfunction.UsuallythedistancemeasureistheEuclideannormor theMaximumnorm.ThemostusedkernelfunctionsaretheHeaviside stepfunction[28] andtheGaussiankernel[42].
Inthiswork,theEuclideannormandGaussiankernelwereused. ThreefeaturesrelatedtoApEn wereextracted.Thefirstoneisthevalue ofApEn estimatedwiththeparameters𝑟,𝜏and𝑚maximizingtheAUC. TheothertwofeaturesarethemaximumofApEn andthevalueof𝑟 wherethismaximumislocated[43].Inthesecases,both𝑚and𝜏were selectedinordertomaximizetheAUC,asbefore.
3.3.2. Sampleentropy
ApEn is a highly biased estimator due to the inclusion of self-matches, andthis bias is more noticeable in short data lengths. To overcome thislimitation, RichmanandMoormanproposed the Sam-pleEntropy(SampEn).SampEnislargelyindependentofrecordlength andshowsahigherconsistencythanApEn [29].Followinganotation similartothatusedinApEn,theequationfordeterminingSampEn is givenas SampEn(𝑚, 𝜏, 𝑟, 𝑁) = − ln𝐵𝑚 +1(𝑟) 𝐵𝑚(𝑟) , (3) with 𝐵𝑚(𝑟) = 1 𝑀 𝑀 ∑ 𝑖=1 1 𝑀− 1 𝑀 ∑ 𝑗=1,𝑖≠𝑗 𝜃(𝑑(𝐱𝑚𝑖,𝐱𝑚𝑗), 𝑟), (4)
where𝑑(⋅)isadistancemeasurebetweenstatevectorsand𝜃(⋅)isa ker-nelfunction.Inthiswork,wechoseanEuclideannormandaHeaviside stepfunction.
Forhigh𝑟thresholds,SampEn→ApEn,andforsmallvaluesof 𝑟, SampEn hasahighvariance. Astheauthorspropose, weconsidered onlythefirst𝑁−𝑚vectorsoflength𝑚whencomputing𝐵𝑚(𝑟),ensuring
that,for1≤𝑖≤𝑁−𝑚,𝐱𝑚
𝑖 and𝐱𝑚𝑖+1weredefined.
3.3.3. Fuzzyentropy
Fuzzyentropy(FuzEn)is analogoustoSampEn,butthesimilarity degree(kernelfunction𝜃(⋅))iscalculatedthroughafuzzyfunction de-finedby𝑒−𝑑(𝐱𝑚𝑖,𝐱𝑚𝑗)𝑞∕𝑟.Accordingto [30],FuzEn ismoreconsistentand lessdependentonthedatalengththanSampEn.
3.3.4. Dispersionentropy
SampEn isapowerfultooltoassessthedynamicalcharacteristicsof timeseries,butitiscomputationallyexpensive.Ontheotherhand, per-mutationentropy(PermEn)quantifytheirregularityofthetimeseries basedonanalysisofpermutationpatterns,whichdependson compar-isonsofneighboringvalues[44].PermEn doesnotconsiderdifferences betweenamplitudes.
DispersionEntropy(DE)wasproposedtoovercometheselimitations ofPermEn andSampEn [27].Foragiventimeseries𝑥[𝑛]oflength𝑁, theDE algorithmincludesthefollowingsteps.First,𝑥[𝑛]isassignedto 𝑐 classes.Forthis,𝑥[𝑛] ismappedto𝑦[𝑛] fromanormalcumulative distributionfunction. Then, each 𝑦[𝑛] is assignedtoaninteger from
1to𝑐as𝑧[𝑛]=round(𝑐𝑦[𝑛]+ 0.5)with𝑛= 1,2,…,𝑁.Finally,givenan embeddingdimension𝑚anddelay𝜏,thestatevectorsarereconstructed by𝐳𝑚,𝑐𝑖 = [𝑧[𝑖],𝑧[𝑖+𝜏],…,𝑧[𝑖+ (𝑚− 1)𝜏]].
Eachtimeseries𝐳𝑚,𝑐𝑖 ismappedtoadispersionpattern𝜋𝑣0,𝑣1,…,𝑣𝑚−1, where𝑧𝑚[𝑖]=𝑣
0, 𝑧𝑚[𝑖+𝜏]=𝑣1, …,𝑧𝑚[𝑖+ (𝑚− 1)𝜏]=𝑣𝑚−1.Then,for
eachof𝑐𝑚 potential dispersionpattern,relativefrequencyisobtained by𝑝(𝜋𝑣
0,𝑣1,…,𝑣𝑚−1).Finally,basedonthedefinitionoftheShannon en-tropy,DE iscalculatedby DE(𝑥, 𝑚, 𝑐, 𝜏) = − 𝑐𝑚 ∑ 𝜋=1 𝑝(𝜋𝑣0,𝑣1,…,𝑣𝑚−1) ln𝑝(𝜋𝑣0,𝑣1,…,𝑣𝑚−1). (5)
3.3.5. Extensionofentropymeasurestothejointtime-frequency (𝑡,𝑓)or time-scale(𝑡,𝑠)domains
Ameasure of the uniformity of signal energydistributionin the frequencydomaincanbedefinedbyinterpretingapowerspectral den-sity(PSD)asaquasi-probabilitydistributionfunction[45],andusing entropyconcepts.Alarger𝑓-domainentropyvalueimpliesmore uni-formityandviceversa.Theseconceptscanbeextendedto(𝑡,𝑓)or(𝑡,𝑠) domainsinorder todiscriminatesignalswithsimilarbandwidth,but withdifferentvariationsovertime[46].Let𝑥[𝑛]bearealtimeseriesof length𝑁and𝑧[𝑘]itsFourierTransform(FT)oflength𝑀.Thespectral entropy(SE(𝑓))isdefinedas
SE(𝑓)= − 𝑀 ∑ 𝑘=1 [𝑘] ln[𝑘], (6) where[𝑘]=∑𝑀|𝑧[𝑘]|2 𝑘=1|𝑧[𝑘]|2 .
The(𝑡,𝑓)or(𝑡,𝑠)Shannonentropyis anextension ofthe(SE(𝑓)).
ItisobtainedbyreplacingtheFTwithatime-frequencyortime-scale distribution𝜌[𝑛,𝑘].The(𝑡,𝑠)Shannonentropyis
SE(𝑡,𝑠)= − 𝑁 ∑ 𝑛=1 𝑀 ∑ 𝑘=1 𝜌𝑁[𝑛, 𝑘] ln(𝜌𝑁[𝑛, 𝑘]), (7) where𝜌𝑁[𝑛,𝑘]=∑𝑛∑𝜌[𝑘𝑛,𝑘𝜌][𝑛,𝑘].
TheseideascanalsobeusedtoextendtheRenyiEntropyas RE(𝑡,𝑠)= 1 1 −𝑞ln 𝑁 ∑ 𝑛=1 𝑀 ∑ 𝑘=1 𝜌𝑁[𝑛, 𝑘]𝑞. (8)
Inthiswork,weset𝑞= 3[46].
Inspiredbytheseconceptsandmultiresolutionentropy[47],we pro-poseameasureofentropythroughthescalesforthisapplication.For eachscale𝑘ofthe(𝑡,𝑠)representation𝜌[𝑛,𝑘],wecalculateanentropy valueby RE(𝑡,𝑠)(𝑘) = 1 1 −𝑞ln 𝑁 ∑ 𝑛=1 ( 𝜌[𝑛, 𝑘] ∑ 𝑛𝜌[𝑛, 𝑘] )𝑞 . (9)
Thisentropymeasureallowstoestimatetheuniformityofsignal en-ergydistributionforasimplescale.Thisismaximumwhentheenergy isconstantoverthetime.
Wenormalize𝜌[𝑛,𝑘]inordertofulfilltheprobabilitydensity func-tion properties. Thus, the entropy measure does not vary with the magnitudeofenergy,butisonlybasedonitsdistributionovertime. Asinthepreviouscase,weset𝑞= 3.Fromnowon,thesefeatureswill becalledtime-scalemultiresolutionRenyientropy(TSMRE).
Thetime-scaledistributionwasobtainedusingcontinuouswavelet transform(CWT) using 32 scales andHaar’s wavelet. Although this waveletis verysimple,andithasthedisadvantage ofbeing discon-tinuousandthereforenotderivable,forthis workitwasthewavelet thatshowedthebestperformance.ThisisduetothefactthattheHR signalprovidedbythepulseoximeterhasalargequantizationstepand thuscanbewellapproximatedbypiecewiseconstantfunctions.
3.3.6. Lempel-Zivcomplexity
Lempel-Zivcomplexity(LZ)[48] isametricthathasbeenwidely usedinbiologicalsignalsforrecognitionofstructuralregularities.The
LZ isnonparametricandsimpletocompute.First,thediscrete-time sig-nal𝑥[𝑛]isconvertedintoasymbolsequence𝑃=𝑠1𝑠2…𝑠𝑛by
compar-isonwiththresholds.Then,complexitymeasure𝑐[𝑛]canbecalculated asreferencedin[49].Inthecontextofbiomedicalsignalanalysis, typ-icallythesignalisconvertedintoabinarysequenceusingthemedian. Inthiswork,weobtainbetterperformancesettingtwothresholds us-ing0.33and0.66quantiles.Thatis,weuseasequenceofthreedifferent symbols.
Thefeaturesdescribedpreviouslyallowtoquantifytheregularityof thedata.Aswementionedinthesubsection2.2,theHRshowsgreater variabilityandmeanvalueduringwakefulness.Fromthis,these mea-sureswereproposedinordertoexploitthisdifferenceintheregularity orcomplexityofthedata.Thesemeasureshaveprovenusefulin sev-eralworksonbiomedicalsignals[50].Further,ourpreviouswork[51] showedthepotentialofthesefeaturesforclassification.
3.3.7. Frequencydomainbasedfeatures
Spectralanalysisoftheheartratevariabilitysignalsallowsto quan-tifytheinfluenceoftheautonomicnervoussystem[52].These char-acteristicsareselectedhereontheassumptionthattheywillprovide informationaboutthesleepstage,asdiscussedin[53].Verylow fre-quency(VLF)(0.003,0.04]Hz,lowfrequency (LF)(0.04,0.15]Hzand highfrequency(HF)(0.15,0.4]Hzcomponentswereobtained.Further, theratioLF/HF,normalizedHFandVFandtotalpower(TP)areused [52].Spectralestimationisperformedusingperiodogram.
3.3.8. (𝑡,𝑓)or(𝑡,𝑠)signal-basedfeatures
Weextractedthe15featuresdiscussedin[54] thatallowto charac-terize thenon-stationarynatureoftheHR.Thiscapabilityispotentially usefulfordiscriminatingsleepstages.Thefeaturesarebrieflyexplained below.
Severalfeaturesarebasedon singularvaluedecomposition(SVD) ofthe(𝑡,𝑓)or(𝑡,𝑠)representation𝜌[𝑛,𝑘].TheSVDdividesthe𝑁×𝑀
matrix𝜌intotwosubspaces,signalsubspaceandanorthogonal alter-natesubspaceoftheform𝜌=𝐔𝐒𝐕𝐻,where𝐔and𝐕are𝑁×𝑁 and 𝑀×𝑀 unitarymatrices,respectively.𝐒isan𝑁×𝑀diagonalmatrix withnon-negativerealnumbers.Thediagonalentriesof𝐒areknown asthesingularvaluesof𝜌.
Thefirstandsecondfeaturesarethemaximum(max𝐒)andvariance (var𝐒) of thesingularvaluesof 𝜌. Thethirdfeatureis acomplexity measuregivenby ESVD= − 𝑁 ∑ 𝑖=1 ̄𝑆𝑖log ̄𝑆𝑖, (10) where ̄𝑆𝑖=∑𝑁𝑆𝑖 𝑗=1𝑆𝑗 .
Thefourthfeature istheenergyconcentrationmeasure,anditis definedas ECM= (𝑁 ∑ 𝑛=1 𝑀 ∑ 𝑘=1 |𝜌[𝑛, 𝑘]|12 )2 . (11)
Then,8featuresrelatedtothesub-bandenergyareobtained inte-gratingovertime.Thatis
SBE𝛿= 𝑁 ∑ 𝑛=1 (𝛿∑+1)𝐿 𝑘=𝛿𝐿+1 𝜌[𝑛, 𝑘] (12) where𝐿=𝑀8 and𝛿= 0,1,…,7.
Finally, in additionto these features, we calculated(𝑡,𝑠)-domain meanandstandarddeviationbyextensionfromclassicalstatisticsand (𝑡,𝑠)Renyientropybyequation(8).
3.3.9. Autocorrelation-basedfeatures
Weextractedsomefeaturesrelatedtotheautocorrelationseries.In general, theautocorrelationof awakesegments hasperiodicitiesand
issmootherthanasleepsegments.Inordertodifferentiatethem,we computethefirst minimumand thefirstzero-crossing of theseries. Then,wedeterminethecoefficientsofanautoregressive (AR)model oforder4thatfitsthesignal.Thesecoefficientswereusedasfeatures. Finally,wecalculatetheLZcomplexityoftheautocorrelationseries in ordertomeasuretheregularitydifferences.
3.3.10.Statisticalfeatures
Further totheabove-mentioned features, some classical statistics suchasmeanandstandarddeviationofthetemporalsignalwere calcu-lated.Thesefeaturesareusefulfordiscriminatesleepstages(especially themeanvalue),sincetheyvarymarkedlybetweensleepand wakeful-ness.
3.3.11.Summaryoffeatures
Theobtainedfeaturescanbesummarizedin:
• 7variantsofentropyandcomplexitymeasures:ApEn,ApEnmaxand
𝑟max,SampEn,FuzEn,DispEn,andLZ.
• 32entropymeasuresinthe(𝑡,𝑠)domain:TSMRE.
• 7frequencydomainfeatures:VLF,LF,HF,LF/HF,normalizeHF andVF,andTP.
• 15featuresinthe(𝑡,𝑠)domain:max𝐒,var𝐒,ESVD,ECM,8SBE𝛿, mean(𝑡,𝑠),std(𝑡,𝑠),andRE(𝑡,𝑠).
• 7autocorrelation-basedfeatures:firstmin,first𝑍𝐶,4AR coeffi-cients,andLZ ofautocorrelation.
• 2statisticalfeatures:meanandstandarddeviation.
3.4. Featureselectionandclassification
Asmentionedabove,atotalof70featureswereobtained.However, systemperformancemayvarywithdifferentcombinationsoffeatures. Inadditiontopotentiallyworseningperformance,thepresenceof re-dundantornon-informativefeaturesincreasesthecomputationalcost andmakestheclassifierhardertotrainbythe“curseofdimensionality”. Afeatureselectionroutineisapopularwaytoresolvetheseproblems. Inthiswork,weproposetwodifferentschemesforthefeatureselection. Thefirstschemeisawrappermethod[55] offeatureselectionandSVM andthesecondschemeisanembeddingmethodthatusesRFasclassifier.
3.4.1. ForwardfeatureselectionandSVM
Weuse ameasure ofclassifier performancetoselecttheoptimal subsetoffeatures.AccordingtoKohaviandJohn[56],itisnecessary todefinehowtosearchthespaceofallpossiblevariablesubsets;what performancemeasuretousetoguidethesearch;andwhichclassifier touse.Anexhaustivesearchfindtheglobaloptimum,buttheproblem isNP-hard.Toavoidthisproblem,weimplementedagreedysolution calledforwardfeatureselection.
Let𝑓𝑛 and𝑛𝑓 betheoptimalfeaturesetselectedandthe remain-ingfeatures,respectively,inthe𝑛-thiteration.Let𝑁𝑓 thenumberof
totalfeaturesand𝜀anerrormeasure.Let1
𝑓= ∅and1𝑓 thesetofall
features.Theprocedurecanbesummarizedasfollows:
1: for 𝑛= 1to𝑁𝑓 do
2: for 𝑅𝑓∈𝑛𝑓 do
3: Provisionalsetoffeatures:𝑅𝑓=𝑓𝑛∪𝑅𝑓
4: Crossvalidation:Randomlysplitdatasetinto𝐾parts.
5: for 𝑘= 1to𝐾 do
6: Select𝑘-thsubsetfortestingandtherestfortraining. 7: Trainclassifierwithtrainset.
8: Testclassifierwithtestset. 9: Computetheerrors𝜀(𝑘)forall𝑘. 10: end for
11: Computethemeanerror̄𝜀(𝑅𝑓)forall𝑅𝑓. 12: end for
13: Findaminimizer𝑅∗
14: Updatebestsetofselectedfeatures𝑛+1
𝑓 =𝑓𝑛∪𝑅∗𝑓. 15: Updatesetofremainingfeatures𝑛+1
𝑓 =𝑛𝑓− {𝑅∗𝑓}. 16: Savethebestresult𝜀min(𝑛)=̄𝜀(𝑅∗𝑓)forall𝑛.
17: end for
Inthisalgorithm,featuresareprogressivelyincorporatedintolarger subsets.Thismethodyieldsnestedsubsetsoffeatures.Finally,anerror measurementisobtainedforeachsubsetandfromthis,the“optimum” setcan be selected.Whilethecomputational loadis lessthanin an exhaustivesearch,reachingthesolutionbythismethodmaybeslow.
In this schemewe use SVMas classifier [57]. SVM involvesthe optimizationofaconvexobjectivefunctionwithconstraintsanditis un-affectedbylocalminima.SVMproducesanoptimumseparation hyper-planethroughmappingthefeaturesinahyperdimensionalspace.Inthis work,weuseaGaussiankernelgivenby𝐾(𝑥𝑖,𝑥𝑗)= exp{−𝛾||𝑥𝑖−𝑥𝑗||2}. DetailedexplanationofSVMcanbefoundin[57,58].
The measureerror 𝜀 was selectedwith theaimof maximize the AUC.LetSe andSp bethesensitivityandspecificity,respectively.Each iterationselectsthefeaturethatminimizes(1−Se)2+ (1−Sp)2,thatis,
theminimumdistancetopoint(0,1)intheROCcurve.Inaddition,we evaluatedtheuseofacriterionrelatedwiththeapplication.Weselected thefeaturethatminimizetheerrorinestimatingthetotalsleeptimeper patient.However,theresultsobtainedwiththislastmeasurewillnot bereportedduetopoorperformance.
3.4.2. FeatureimportanceandRF
Forcomparisonpurposes,weconsiderRF[59] asclassifier.InRF, wecanincorporatethefeatureselectionaspartofthetrainingprocess andthat is much moreefficient becausethere is noneed toretrain severaltimes.Todothis,aftereach treeis trainedwithall features, thevaluesofeachfeaturearerandomlypermuted.Thedatawiththe permutedvariableisrundown inthetreeandameasureoferror is calculated.Bydoingthisforallfeaturesandcalculatingthepercentage increaseinmisclassificationratecomparedtotheresultingerrorwith allvariablesintact,wecanestimateameasureofvariableimportance.
3.5. Finalclassifiers
Wealreadydescribedthefeatureextractionandfeatureselection. Thefinalstageistrainandtesttheclassifiersthatuse thesubsetsof selectedfeatures.However,firstweneedtosolveonemoreproblem: theclassimbalance.
Mostof thetotal recordingtimecorrespondstotheasleep stage. Therearedifferentapproachestopreventtheclassifierfrombiasing to-wardsthemajorityclass,suchasresampledatabase,syntheticsamples generationbyconvexcombination,amongothers.Inthiswork,weused twodifferentmethodstoovercomethedrawbackof classimbalance. Thefirstmethodisnaive:wesimplyrandomlyremovesamplesfromthe majorityclassuntiltheclassesarebalanced.Thismethodwasapplied inFFS-SVMandRFwithfeatureimportance.Inthesecondmethod,we usetheSVMclassifierbutweimposeanadditionalcostonthemodel fortheminorityclasserrorsduringtraining[58].Inthisway,wecan biastheclassifiertopaymoreattentiontotheminorityclass.We penal-izedtheclassificationinaratiothattakesintoconsiderationtheclass imbalance.
Thesebalancedstrategieswereonlyappliedinthetrainingtoavoid theclassifiertohaveabiastowardsthemajorityclass.Inthetestdata, noprocessingisdonetobalancetheclasses.Inthiswaytheclassifier willbetestedunderconditionssimilartotherealapplication.
Inconclusion,takingintoaccountthefeatureselectionand classi-ficationroutinesalongwiththeapproachestosolveclassimbalance, wehavethreealgorithmsthatwillbetrainedandtested:FFS-SVMwith penaltyerrorsinminorityclass(FS1),FFS-SVMwithartificialbalance (FS2),andfeatureimportanceandRFwithartificialbalance(FS3).
4. Results
Inthissection,wepresenttheresultsobtainedwiththethree pro-posedmethods, explaining the outcomes of each of thestages that composeit.
4.1. Parametersselection
Insome features described in previous section was necessary to experimentallytune asetofhyperparameters.Tofindthebest com-binationofhyperparametersasetofexperimentswasperformedovera designdatabase(500patients,whichwasdescribed in3.1).All hyper-parameterscombinationswereexploredusingagridsearch.First,we didacoarsesearchtogetanideaofhowthefeaturesbehaves accord-ingtothehyperparametersand,then,wedidamoredetailedsearch tofindtheoptimumhyperparameters.WeusetheAUCasanobjective measureofthediscriminatingcapacityofeachsinglefeature[38].
Asmentionedabove,theseexperimentswereconductedforHR seg-mentswithaduration𝐿ofbetween30and300s,instepsof30.The gridsearchwasperformedforthefeaturesApEn,SampEn,FuzEn and DispEn.Inthefirstthreefeatures,𝑚wasvariedfrom2to8instepsof
1,𝑟wasvariedfromexp(−7)toexp(4)varyingtheexponentinstepsof
0.55and𝜏wasvariedfrom1to4instepsof1.ForFuzEn,theexponent 𝑞ofthekernelfunctionwasvariedfrom2to4instepsof1.InDispEn, 𝑐wasvariedfrom2to4instepsof1,𝑚wasvariedfrom2to𝑚maxin
stepsof1,where𝑚max=floor(log(𝐿)∕𝑐)and𝜏 from1to4instepsof
1.TheGaussiankernelparameterusedforSVMwasselectedvarying𝛾 withtheequation1∕𝑘2,with𝑘from1to16instepsof2.Theoptimum
valuewas𝑘= 8,andconsequently𝛾= 0.0156.
ThehyperparametersthatmaximizetheAUCareverysimilarfor differentvaluesof𝐿,buttheAUCalwaysincreaseswith𝐿.The conse-quencesofthiswillbediscussedbelow.
4.2. Featureselection
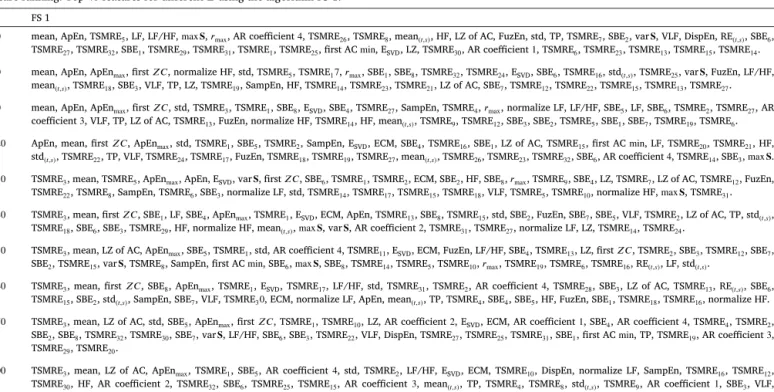
Inordertodiscardirrelevantfeaturesandgenerateasetofoptimum featuresforagivenclassifier,thefeatureselectionroutinesmentioned inSection3wereapplied.ThemethodsFS1,FS2andFS3wereapplied tothedifferentdatabasesobtainedbyvarying𝐿.Thetwomethodsof FFS-SVMwereappliedasexplainedabove,obtaining70nestedsubsets offeatures.IntheRF-basedmethod,weobtainafeatureranking.Inthis case,wedidnotconsiderincreasethefeaturesofonebyone,butwe generatedsubsetsconsideringgroupswhoserankingissimilar.
Theoriginalfeature sethadhighredundancy.Manyfeatures are fromthesamefamily.Theexperimentresults showedthatwithonly afewfeatures(approximately10)performanceisclosetothebest re-sultobtained.TheFig.3showsaccuracy,sensitivityandspecificityfor databasewith𝐿= 150obtainedwiththreemethods.Resultsarevery similarfortheothers𝐿values.
Basedontheseresults,weselectedthefirst40featuresobtainedin eachmethodforeachdatabasetomake theclassifierfaster and sim-pler.IntheTables2,3and4weshowanexhaustivelistoftheselected featuresbyeachmethod.Theselectedfeaturesaregenerallyvery sim-ilarbyeachmethod,althoughtheorderinwhichtheyareselectedare slightlydifferentbyeachone.Oneofthemostselectedfeaturesisthe meanvalueofthesignal.ThemeanvalueoftheHRdecreasesasthe sleepstageisdeeper,asitwasestablishedbyPenzel[20].TheApEn re-latedfeatureswerealsoselectedearly.Beingameasureofregularity,it canbeabletodifferentiatethestatesofawakeandasleep.Duringvigil thereisassociatedagreaterirregularityofthesignal[20],asshownin theFig.1.Thereareotherfeaturesinwhichitismoredifficultto de-termineaphysiologicalmeaningdirectly.However,itisevidentthat thesignalchanges,andthefeaturesthatweareusingareabletoreflect thosechanges.Althoughtheinterpretabilityoftheresultsisalwaysa benefit,itisnotnecessarythattheselectedfeatureshavealogical in-terpretationwiththeapplication,proofofthisareworksthatuseweak classifiersorthedeeplearningapproaches[60].
Fig. 3.Performance(Acc,Se andSp)versusnumberoffeatureswithFFS-SVM withpenaltyerrorsinminorityclass(black),FFS-SVMwithartificialbalance (red),andfeatureimportanceandRFwithartificialbalance(blue).
4.3. Performanceinunseendatabase
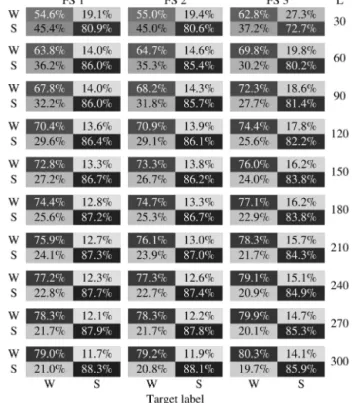
Inordertoevaluatetheperformanceofthedevelopedsystems,we applied the three algorithms (FS1, FS2, and FS3) to the remaining unseen4500 patientsandweperformed 𝑘-fold crossvalidation,with 𝑘= 10.Wecalculatedallperformancesindividually(perpatient)and thereportedresultswereobtainedbyaveraging.Inthisway,theresult obtainedwillbeclosertotherealapplicationwheretheobjectiveisto estimatethetotalsleeptimeperpatient.
Table5showsthepercentageconfusionmatrixobtainedbyapplying thealgorithmstotheunseendatabase.Thenumberoffalsepositives (FP),truepositives(TP),falsenegatives(FN)andtruenegatives(TN) wascalculatedforeachpatientandtheaveragedvaluesarereported. Inallalgorithmsabetterperformancewasobtainedintheclassification ofthemajorityclass(whenthepatientisasleep).Theperformancealso increaseswiththelengthofthesegment𝐿.
InTable6,wesummarizedsomecommonperformancemeasures: accuracy,sensitivity,specificity,positive predictivevalue(PPV),and negativepredictivevalue(NPV).Thesemeasureswerereported forall threealgorithmsappliedtodatabasesobtainedvarying𝐿.SVM-based algorithmsaremoresensitiveandRFismorespecific.Itisworthnoting thatinthisworkwetaketheawakestateasapositiveclass.Thebetter accuracyoftheclassifiersthatuseSVMisexplainedbythefactthat theyclassifythemajorityclassbetter,whichistheonethatultimately hasthegreaterimportanceinthismeasure.
5.Discussion
TheuseofpulseoximetryastheonlysignaltodiagnoseOSAHSis stillcontroversial.Differentdevicespresentagreatvariabilityfor dif-ferentsituationsandpatients.Thedispersionofobtainedvaluesishigh. Theinterpretationofthemeasureddesaturationsisambiguouswithout priorknowledgeofthedeviceused[61].Inaddition, pulseoximetry is highly sensitivetomotion artifacts[33]. However,significant re-sultshavebeenobtainedthroughtheuseofadvancingsignalprocessing tools.Asmentionedearlier,thismakestheuseofPPGveryattractive becauseofitssimplicityandlowcost,butthealgorithmsdesignedhave greatdifficultyinmeetingitsobjectivesduetothelowqualityofthe signal.
SleepclassificationisperformedprimarilyusingtheEEGsignal, al-thoughinformationisalsoextractedfromothersignalssuchasEOG, EMGtodetect movement,among others.Thus, detectingwhethera signalsegmentcorrespondstoawakeorasleepfromtheHRisavery complicatedtask.Althoughtherearechangesinthetemporaldynamics oftheHRsignal[20],theinformationwehaveismuchmoredifficult tointerpret.IfweaddtothisthelowaccuracyoftheHRreportedby thepulseoximeter,wecangetanideaofthedifficultyinreachingan acceptableperformance.Finally,inadditiontoallthesedrawbacks,we alsohavealowsamplingfrequencyofHR,whichmakesitdifficultto obtainanadequatefeatureextraction.
Inthisworkwehavedevelopedanalgorithmtoclassifythesleep stagesinawakeandasleepusing onlyHRsignalsobtained bypulse oximetry.Tosummarize,themainmethodologicalstepsthatmustbe appliedtoreusetheproposedschemewithotherdatabasesisasfollows: Table 2
Featureranking.Top40featuresfordifferent𝐿usingthealgorithmFS1. 𝐿 FS1
30 mean,ApEn,TSMRE5,LF,LF/HF,max𝐒,𝑟max,ARcoefficient4,TSMRE26,TSMRE8,mean(𝑡,𝑠),HF,LZ ofAC,FuzEn,std,TP,TSMRE7,SBE2,var𝐒,VLF,DispEn,RE(𝑡,𝑠),SBE6, TSMRE27,TSMRE32,SBE1,TSMRE29,TSMRE31,TSMRE1,TSMRE25,firstACmin,ESVD,LZ,TSMRE30,ARcoefficient1,TSMRE6,TSMRE23,TSMRE13,TSMRE15,TSMRE14.
60 mean,ApEn,ApEnmax,first𝑍𝐶,normalizeHF,std,TSMRE5,TSMRE17,𝑟max,SBE1,SBE8,TSMRE32,TSMRE24,ESVD,SBE6,TSMRE16,std(𝑡,𝑠),TSMRE25,var𝐒,FuzEn,LF/HF, mean(𝑡,𝑠),TSMRE18,SBE3,VLF,TP,LZ,TSMRE19,SampEn,HF,TSMRE14,TSMRE23,TSMRE21,LZ ofAC,SBE7,TSMRE12,TSMRE22,TSMRE15,TSMRE13,TSMRE27.
90 mean,ApEn,ApEnmax,first𝑍𝐶,std,TSMRE3,TSMRE1,SBE8,ESVD,SBE4,TSMRE27,SampEn,TSMRE4,𝑟max,normalizeLF,LF/HF,SBE5,LF,SBE6,TSMRE2,TSMRE27,AR coefficient3,VLF,TP,LZ ofAC,TSMRE13,FuzEn,normalizeHF,TSMRE14,HF,mean(𝑡,𝑠),TSMRE9,TSMRE12,SBE3,SBE2,TSMRE5,SBE1,SBE7,TSMRE19,TSMRE6.
120 ApEn,mean,first𝑍𝐶,ApEnmax,std,TSMRE1,SBE5,TSMRE2,SampEn,ESVD,ECM,SBE4,TSMRE16,SBE1,LZ ofAC,TSMRE15,firstACmin,LF,TSMRE20,TSMRE21,HF, std(𝑡,𝑠),TSMRE22,TP,VLF,TSMRE24,TSMRE17,FuzEn,TSMRE18,TSMRE19,TSMRE27,mean(𝑡,𝑠),TSMRE26,TSMRE23,TSMRE32,SBE6,ARcoefficient4,TSMRE14,SBE3,max𝐒. 150 TSMRE3,mean,TSMRE5,ApEnmax,ApEn,ESVD,var𝐒,first𝑍𝐶,SBE6,TSMRE1,TSMRE2,ECM,SBE2,HF,SBE8,𝑟max,TSMRE9,SBE4,LZ,TSMRE7,LZ ofAC,TSMRE12,FuzEn,
TSMRE22,TSMRE8,SampEn,TSMRE6,SBE3,normalizeLF,std,TSMRE14,TSMRE17,TSMRE15,TSMRE18,VLF,TSMRE5,TSMRE10,normalizeHF,max𝐒,TSMRE31. 180 TSMRE3,mean,first𝑍𝐶,SBE1,LF,SBE4,ApEnmax,TSMRE1,ESVD,ECM,ApEn,TSMRE13,SBE8,TSMRE15,std,SBE2,FuzEn,SBE7,SBE5,VLF,TSMRE2,LZ ofAC,TP,std(𝑡,𝑠),
TSMRE18,SBE6,SBE3,TSMRE29,HF,normalizeHF,mean(𝑡,𝑠),max𝐒,var𝐒,ARcoefficient2,TSMRE31,TSMRE27,normalizeLF,LZ,TSMRE14,TSMRE24.
210 TSMRE3,mean,LZ ofAC,ApEnmax,SBE5,TSMRE1,std,ARcoefficient4,TSMRE11,ESVD,ECM,FuzEn,LF/HF,SBE4,TSMRE13,LZ,first𝑍𝐶,TSMRE2,SBE3,TSMRE12,SBE7, SBE2,TSMRE15,var𝐒,TSMRE8,SampEn,firstACmin,SBE6,max𝐒,SBE8,TSMRE14,TSMRE5,TSMRE10,𝑟max,TSMRE19,TSMRE6,TSMRE16,RE(𝑡,𝑠),LF,std(𝑡,𝑠).
240 TSMRE3,mean,first𝑍𝐶,SBE8,ApEnmax,TSMRE1,ESVD,TSMRE17,LF/HF,std,TSMRE31,TSMRE2,ARcoefficient4,TSMRE28,SBE3,LZ ofAC,TSMRE13,RE(𝑡,𝑠),SBE6, TSMRE15,SBE2,std(𝑡,𝑠),SampEn,SBE7,VLF,TSMRE30,ECM,normalizeLF,ApEn,mean(𝑡,𝑠),TP,TSMRE4,SBE4,SBE5,HF,FuzEn,SBE1,TSMRE18,TSMRE16,normalizeHF.
270 TSMRE3,mean,LZ ofAC,std,SBE5,ApEnmax,first𝑍𝐶,TSMRE1,TSMRE10,LZ,ARcoefficient2,ESVD,ECM,ARcoefficient1,SBE4,ARcoefficient4,TSMRE4,TSMRE2, SBE2,SBE8,TSMRE32,TSMRE30,SBE7,var𝐒,LF/HF,SBE6,SBE3,TSMRE22,VLF,DispEn,TSMRE27,TSMRE25,TSMRE31,SBE1,firstACmin,TP,TSMRE19,ARcoefficient3,
TSMRE29,TSMRE20.
300 TSMRE3,mean,LZ ofAC,ApEnmax,TSMRE1,SBE5,ARcoefficient4,std,TSMRE2,LF/HF,ESVD,ECM,TSMRE10,DispEn,normalizeLF,SampEn,TSMRE16,TSMRE12,
TSMRE30,HF,ARcoefficient2,TSMRE32,SBE6,TSMRE25,TSMRE15,ARcoefficient3,mean(𝑡,𝑠),TP,TSMRE4,TSMRE8,std(𝑡,𝑠),TSMRE9,ARcoefficient1,SBE3,VLF, TSMRE18,TSMRE11,var𝐒,LF,SBE2.
Table 3
Featureranking.Top40featuresfordifferent𝐿usingthealgorithmFS2. 𝐿 FS2
30 mean,ApEn,first𝑍𝐶,LF,TSMRE10,ARcoefficient4,TSMRE30,𝑟max,normalizeLF,SBE7,SBE1,TSMRE4,std(𝑡,𝑠),ARcoefficient1,std,SBE2,RE(𝑡,𝑠),TSMRE29,TSMRE8,VLF, TSMRE3,LZ,max𝐒,TP,TSMRE27,ARcoefficient3,SBE6,DispEn,TSMRE23,TSMRE2,TSMRE21,TSMRE12,SampEn,FuzEn,TSMRE16,TSMRE17,var𝐒,firstACmin,ApEnmax, ESVD.
60 mean,ApEn,ApEnmax,TSMRE3,SBE5,std,𝑟max,first𝑍𝐶,normalizeHF,TSMRE8,TSMRE15,TSMRE18,SBE4,TSMRE23,DispEn,TSMRE20,ARcoefficient1,mean(𝑡,𝑠), TSMRE28,max𝐒,TSMRE7,VLF,SBE2,firstACmin,TSMRE11,SampEn,TSMRE12,TSMRE14,RE(𝑡,𝑠),TSMRE31,LF/HF,SBE6,TSMRE9,TSMRE32,LZ ofAC,TSMRE16,ESVD, TSMRE1,FuzEn,LF.
90 mean,ApEn,ApEnmax,first𝑍𝐶,TSMRE6,std,SBE4,ESVD,TSMRE11,TSMRE3,SBE6,SBE2,DispEn,TSMRE20,LZ ofAC,TSMRE2,var𝐒,ARcoefficients1,TSMRE5,SBE3, max𝐒,mean(𝑡,𝑠),TSMRE24,TSMRE15,TSMRE17,RE(𝑡,𝑠),TSMRE16,LZ,TSMRE23,TSMRE13,TSMRE30,TSMRE19,normalizeHF,firstACmin,ARcoefficients4,𝑟max,AR coefficients2,ECM,TSMRE8,TSMRE14.
120 TSMRE3,mean,first𝑍𝐶,SBE1,normalizeLF,SBE7,TSMRE18,ApEnmax,ESVD,TSMRE28,std,TSMRE1,FuzEn,SBE5,TSMRE2,firstACmin,𝑟max,TSMRE27,SBE6,mean(𝑡,𝑠), SBE4,TSMRE26,TSMRE21,SBE8,TSMRE31,TSMRE29,TSMRE22,LF,LZ,std(𝑡,𝑠),var𝐒,TSMRE25,TSMRE15,TSMRE8,LZ ofAC,TSMRE20,ECM,ARcoefficients2,ARcoefficients 1,TSMRE24.
150 TSMRE3,mean,first𝑍𝐶,ApEnmax,SampEn,SBE5,ESVD,TSMRE1,TSMRE29,SBE6,SBE1,normalizeHF,HF,LZ,LZ ofAC,std,TSMRE2,ApEn,TSMRE16,firstACmin,LF, var𝐒,TSMRE13,TSMRE20,TSMRE31,TSMRE17,LF/HF,TSMRE24,SBE4,ECM,SBE2,normalizeLF,FuzEn,TSMRE6,SBE3,RE(𝑡,𝑠),TSMRE15,𝑟max,SBE8,TSMRE17. 180 TSMRE3,mean,first𝑍𝐶,SBE1,VLF,SBE5,ApEnmax,FuzEn,SBE4,ESVD,ECM,SBE2,TSMRE1,std,TSMRE29,TSMRE11,normalizeHF,DispEn,SBE3,LZ ofAC,TSMRE30,
TSMRE19,SBE8,TSMRE17,SampEn,TSMRE2,SBE6,firstACmin,LF,SBE7,std(𝑡,𝑠),var𝐒,LZ,ARcoefficients1,TSMRE13,TSMRE24,max𝐒,TSMRE10,TSMRE23,HF. 210 TSMRE3,mean,LZ ofAC,ApEnmax,LF/HF,TSMRE1,SBE6,mean(𝑡,𝑠),ECM,ARcoefficients4,FuzEn,TSMRE12,TSMRE23,SBE7,ESVD,TSMRE2,TSMRE28,std,TSMRE17,
TSMRE17,SampEn,TSMRE18,𝑟max,SBE8,LF,VLF,TSMRE27,SBE5,TSMRE4,TSMRE30,first𝑍𝐶,TSMRE8,TSMRE15,TP,SBE4,std(𝑡,𝑠),LZ,SBE3,TSMRE16,TSMRE5,ApEn.
240 TSMRE3,mean,LZ ofAC,SBE5,std,ApEnmax,LF/HF,TSMRE1,ESVD,TSMRE26,TSMRE2,LF,TSMRE30,firstZC,TSMRE13,TSMRE19,ApEn,SBE6,TSMRE31,SBE2,TSMRE24, TSMRE10,LZ,SBE8,TSMRE11,ECM,SampEn,ARcoefficients1,TSMRE15,TSMRE28,TSMRE29,var𝐒,FuzEn,ARcoefficients2,max𝐒,SBE7,TP,TSMRE14,TSMRE20,VLF. 270 TSMRE3,mean,LZ ofAC,SBE5,std,ApEnmax,ESVD,TSMRE11,RE(𝑡,𝑠),first𝑍𝐶,ECM,SBE4,TSMRE2,ApEn,TSMRE14,TSMRE9,LZ,ARcoefficients2,LF/HR,ARcoefficients
1,SBE2,TSMRE20,TP,std,SampEn,TSMRE24,TSMRE25,TSMRE17,TSMRE31,SBE3,SBE6,max𝐒,TSMRE7,TSMRE16,SBE7,TSMRE12,TSMRE11,TSMRE13,ARcoefficients3, firstACmin.
300 TSMRE3,mean,LZ ofAC,TSMRE1,ApEnmax,SBE5,ESVD,TSMRE2,LF/HF,ECM,FuzEn,ARcoefficients4,TSMRE14,LF,first𝑍𝐶,TSMRE16,SBE4,TSMRE26,SBE7,TSMRE29, TSMRE19,normalizeLF,TSMRE27,SBE2,ARcoefficients2,TSMRE8,DispEn,SBE6,std(𝑡,𝑠),ARcoefficients1,ARcoefficients3,TSMRE13,LZ,var𝐒,TSMRE32,VLF,SBE8, TSMRE6,SBE1,ApEn.
Table 4
Featureranking.Top40featuresfordifferent𝐿usingthealgorithmFS3. 𝐿 FS3
30 mean,HF,LF,ApEnmax,TP,std,mean(𝑡,𝑠),VLF,TSMRE6,TSMRE5,TSMRE7,TSMRE8,TSMRE4,TSMRE9,TSMRE10,TSMRE3,TSMRE2,ApEn,ECM,normalizeLF,ESVD,var𝐒, SBE1,TSMRE1,LF/HF,max𝐒,SBE4,FuzEn,TSMRE12,normalizeHF,SBE5,SBE8,TSMRE27,TSMRE11,SampEn,ARcoefficients1,TSMRE26,TSMRE28,SBE7,TSMRE25. 60 mean,ApEnmax,TSMRE1,HF,ESVD,ECM,ARcoefficients1,TSMRE2,TSMRE19,TSMRE16,mean(𝑡,𝑠),TSMRE18,SBE1,TSMRE17,LF,RE(𝑡,𝑠),var𝐒,max𝐒,TP,TSMRE20,
normalizeLF,TSMRE15,VLF,SBE5,std,TSMRE14,TSMRE21,normalizeHF,std(𝑡,𝑠),LF/HF,TSMRE22,TSMRE25,TSMRE4,TSMRE24,SBE2,TSMRE23,SampEn,𝑟max,SBE8, TSMRE13.
90 mean,ApEnmax,TSMRE2,TSMRE3,ARcoefficients1,ECM,first𝑍𝐶,ESVD,HF,SBE1,normalizeLF,LF/HF,SBE5,normalizeHF,mean(𝑡,𝑠),TSMRE26,TSMRE30,TSMRE25, TSMRE27,TSMRE28,TSMRE29,TSMRE31,VLF,TSMRE23,LF,TSMRE24,TSMRE32,TSMRE21,std(𝑡,𝑠),TSMRE22,TSMRE20,TP,max𝐒,TSMRE4,firstACmin,std,ARcoefficients
2,ARcoefficients4,TSMRE3,RE(𝑡,𝑠),DispEn.
120 mean,ApEnmax,TSMRE1,TSMRE2,first𝑍𝐶,ARcoefficients1,ECM,SBE1,ESVD,SBE5,HF,firstACmin,normalizeLF,ARcoefficients4,mean(𝑡,𝑠),TSMRE32,normalizeHF, LF/HF,ARcoefficients2,TSMRE30,TSMRE3,SBE8,TSMRE31,VLF,TSMRE4,DispEn,LF,TSMRE22,TSMRE5,SBE2,TSMRE28,TSMRE29,TP,TSMRE26,std,𝑟max,TSMRE20, ApEn,TSMRE24,TSMRE18.
150 mean,ApEnmax,TSMRE1,first𝑍𝐶,TSMRE2,ARcoefficients1,ARcoefficients4,firstACmin,normalizeLF,LF/HF,ESVD,SBE1,SBE5,ARcoefficients2,normalizeHF,ECM, TSMRE3,HF,LF,mean(𝑡,𝑠),TSMRE5,TSMRE4,SBE8,TSMRE32,SBE2,TSMRE31,𝑟max,VLF,TSMRE28,TSMRE29,TSMRE30,TSMRE26,SampEn,DispEn,TSMRE22,LZ ofAC, TSMRE24,TSMRE20,TP,TSMRE19.
180 mean,ApEnmax,TSMRE1,first𝑍𝐶,TSMRE2,ARcoefficients1,ARcoefficients4,firstACmin,SBE5,ARcoefficients2,normalizeLF,ESVD,SBE1,ECM,normalizeHF,LF/HF, TSMRE3,HF,SBE8,mean(𝑡,𝑠),TSMRE4,VLF,LF,DispEn,TSMRE30,TSMRE32,SBE2,TSMRE5,TSMRE31,𝑟max,SBE4,ApEn,TSMRE28,TSMRE27,TSMRE29,LZ ofAC,TSMRE7,
TSMRE6,TSMRE25,SampEn,TSMRE26.
210 mean,ApEnmax,TSMRE1,first𝑍𝐶,TSMRE2,ARcoefficients1,ARcoefficients4,firstACmin,ARcoefficients2,SBE5,normalizeLF,SBE1,LF/HF,normalizeHF,ESVD,LZ ofAC,ECM,TSMRE3,SBE8,HF,TSMRE32,TSMRE4,TSMRE5,LF,SBE4,SampEn,DispEn,mean(𝑡,𝑠),VLF,LZ,TSMRE6,TSMRE7,SBE6,TSMRE30,TSMRE31,SBE2,𝑟max,ApEn, SBE7,TSMRE29.
240 mean,ApEnmax,TSMRE1,first𝑍𝐶,ARcoefficients4,firstACmin,TSMRE2,ARcoefficients1,ARcoefficients2,SBE5,normalizeLF,ESVD,SBE1,LF/HF,HF,normalizeHF, ECM,TSMRE3,LZ ofAC,DispEn,SBE8,TSMRE32,mean(𝑡,𝑠),TSMRE4,VLF,SBE2,TSMRE31,LF,ApEn,TSMRE5,SBE4,𝑟max,LZ,TSMRE29,SBE6,TSMRE30,TSMRE7,SampEn,
TSMRE6,TSMRE19.
270 mean,ApEnmax,TSMRE1,first𝑍𝐶,ARcoefficients4,ARcoefficients1,TSMRE2,firstACmin,ARcoefficients2,SBE5,LZ ofAC,normalizeLF,LF/HF,normalizeHF,SBE8, SBE1,ESVD,TSMRE3,HF,DispEn,ECM,TSMRE4,SBE4,TSMRE32,TSMRE5,LZ,SBE6,mean(𝑡,𝑠),SBE2,TSMRE31,LF,TSMRE7,ApEn,VLF,SampEn,TSMRE30,𝑟max,TSMRE6, SBE7,TSMRE8.
300 mean,TSMRE1,ApEnmax,first𝑍𝐶,ARcoefficients4,ARcoefficients1,firstACmin,ARcoefficients2,TSMRE2,SBE5,LZ ofAC,normalizeLF,LF/HF,SBE1,ECM,SBE8, normalizeHF,ESVD,TSMRE3,DispEn,SBE4,HF,mean(𝑡,𝑠),TSMRE5,𝑟max,TSMRE7,TSMRE32,SBE2,TSMRE4,SBE6,SampEn,VLF,SBE7,ApEn,LF,TSMRE30,TSMRE31,LZ, TSMRE9,SBE3.
Table 5
Confusionmatrixofthefinalresultsindatabaseof4500 remainingpatients fordifferentvaluesof𝐿.Theperformanceobtainedcanbeseeninshadesof gray.FS 1:FFS-SVMwithpenaltyerrorinminorityclass.FS 2:FFS-SVMwith artificialbalance.FS 3:variableselectionwithRF.Wakingandsleepingstates arelabeledas𝑊and𝑆.
1. PreprocessingHRsignalstohavezeromeanandunitvarianceand segmentationintonon-overlapwindowsoflength𝐿.
2. Featureextractionandhyperparametersoptimizationusinga sub-setofthedatabasetodesignthesystem.
3. Featureselection toobtaintheoptimumfeaturesforthechosen classifier.
4. Extractionoftheoptimumselectedfeaturesforthechosen classi-fierusingasubsetofthedatabasetotestthesystemandtrainthe classifier.
Inordertoreusethemethoddescribedinthisarticlewithnew pa-tients,itisnecessarytoapplythepreprocessingstepsoastostandardize andsegmentthesignal Then,theselectedfeatureswiththefounded optimalhyperparametersshouldbeextractedandusedwiththetrained classifier.Althoughthedesigndescribedinthisworkiscomputationally complex,itsuseisfastoncethesystemhasbeendesigned.
Wehavebeenanticipatinginprevioussectionsthediscussionabout thelength𝐿ofthesegmenttobeclassified.Rememberthatthelength ofthesegmentsusedinahypnogramis30s.Itiseasytonotethatthe smaller𝐿makesiteasiertotranslatethisschemetothehypnogram.
To explain this, let the hypnogram 𝐻 be a sequence as 𝐻 = {𝑡𝑊
1,𝑡𝑆1,𝑡𝑊2,𝑡𝑆2,…,𝑡𝑆𝑁−1,𝑡𝑊𝑁},where𝑡𝑊𝑖and𝑡𝑆𝑖arethelengthsof𝑖-th awakeandasleepsegments.Incaseofawake,theFig.4showsthe per-centage𝑃 ofthetotalsleeptimeonlyconsideringsegmentsoflength greaterthan𝐿,thatis
𝑃(%) = ∑ 𝑖∈𝑡𝑊𝑖 ∑ ∀𝑖𝑡𝑊𝑖 ⋅100, (13)
whereisthesetof𝑡𝑊𝑖> 𝐿.Forthecaseofasleepisanalogous. Intherealapplication,theHRsignalissegmentedintonon-overlap windowsof length𝐿,andthenthesegments areclassified obtaining thehypnogram.Ifthereareasleep/awakesegmentsoflengthlessthan 𝐿,somewindowswillnotbelongtoasinglestate.Thatis,when𝐿
in-Table 6
Performanceofthealgorithmsindatabaseof4500remainingpatientsfor differ-entvaluesof𝐿.FS1:forwardfeatureselectionandSVMwithpenaltyerrorin minorityclass.FS2:forwardfeatureselectionandSVMwithartificialbalance. FS3:variableselectionwithrandomforest.Thebestresultsarehighlightedin boldtype. Acc Sp Se PPV NPV 𝐿 FS 1 𝟕𝟑.𝟕 𝟖𝟎.𝟗 54.6 𝟒𝟖.𝟔 83.1 FS 2 73.6 80.6 55.0 48.4 83.6 30 FS 3 69.7 72.7 𝟔𝟐.𝟖 43.1 𝟖𝟒.𝟔𝟓 FS 1 𝟕𝟗.𝟒 𝟖𝟔.𝟎 63.8 𝟓𝟖.𝟑 86.5 FS 2 79.2 85.4 64.7 57.6 86.7 60 FS 3 76.6 80.2 𝟔𝟗.𝟖 52.5 𝟖𝟕.𝟔 FS 1 𝟖𝟎.𝟔 𝟖𝟔.𝟎 67.8 𝟓𝟗.𝟑 87.7 FS 2 80.4 85.7 68.2 59.0 87.8 90 FS 3 78.2 81.4 𝟕𝟐.𝟑 54.4 𝟖𝟖.𝟔 FS 1 𝟖𝟏.𝟒 𝟖𝟔.𝟒 70.4 𝟔𝟎.𝟓 88.5 FS 2 𝟖𝟏.𝟒 86.1 70.9 60.3 88.7 120 FS 3 79.4 82.2 𝟕𝟒.𝟒 56.0 𝟖𝟗.𝟒 FS 1 𝟖𝟐.𝟑 𝟖𝟔.𝟕 72.8 𝟔𝟏.𝟖 89.3 FS 2 82.0 86.2 73.3 61.1 89.4 150 FS 3 80.3 83.0 𝟕𝟔.𝟎 57.3 𝟗𝟎.𝟎 FS 1 𝟖𝟑.𝟏 𝟖𝟕.𝟐 74.4 𝟔𝟑.𝟐 89.8 FS 2 82.8 86.7 74.7 62.4 89.9 180 FS 3 81.2 83.8 𝟕𝟕.𝟏 58.6 𝟗𝟎.𝟒 FS 1 𝟖𝟑.𝟔 𝟖𝟕.𝟑 75.9 𝟔𝟒.𝟎 90.3 FS 2 83.4 87.0 76.1 63.4 90.3 210 FS 3 81.9 84.3 𝟕𝟖.𝟑 59.8 𝟗𝟎.𝟖 FS 1 𝟖𝟒.𝟐 𝟖𝟕.𝟕 77.2 𝟔𝟓.𝟐 90.7 FS 2 84.0 87.4 77.3 64.6 90.7 240 FS 3 82.6 84.9 𝟕𝟗.𝟏 61.0 𝟗𝟏.𝟏 FS 1 𝟖𝟒.𝟕 𝟖𝟕.𝟗 78.3 𝟔𝟔.𝟎 91.1 FS 2 84.6 87.8 78.3 65.7 91.1 270 FS 3 83.1 85.3 𝟕𝟗.𝟗 62.0 𝟗𝟏.𝟒 FS 1 𝟖𝟓.𝟐 𝟖𝟖.𝟑 79.0 𝟔𝟕.𝟎 91.3 FS 2 85.0 88.1 79.2 66.7 91.4 300 FS 3 83.6 85.9 𝟖𝟎.𝟑 63.1 𝟗𝟏.𝟓
Fig. 4.Thepercentage𝑃(%)ofthetotalasleep/awaketimeonlyconsidering segmentsoflengthgreaterthan𝐿.
creases,thesegmentswithmixawakeandasleepstagesalsoincrease. Theclassifier wasnot designedforthese mixtures. Fig.4showsthe magnitudeofthismixtureincrementwithL.Ontheotherhand,aswe reportedintheresults,asweincreased𝐿,theperformanceofthe algo-rithmimproves,becausethereismoreinformationtodetectdynamic changesandthefeaturescan be calculatedmore exactly.Thereis a trade-offbetween theperformanceandtheabilitytoapplythe algo-rithminarealsituationmediatedby𝐿.WhenchoosingalargerLto obtainbetterclassificationresults,wesacrificeaccuracyinthe
bound-Table 7
Comparisonwiththeliterature.
Method Signal N. of classes N. of patients Epoch time Acc Se Sp Prec NPV
Beattie et al. [25] PPG + accelerometer 5 60 30s 90.6 69.3 94.6 70.5 94.3
PPG 2 10 30s 76.8 76 77 41.2 93.8
Uçar et al. [26] HRV 2 10 30s 72.4 74 72 35.9 92.9
PPG + HRV 2 10 30s 76.7 80 76 41.4 94.7
Adnane et al. [22] ECG 2 18 30s 80 69.1 84.5 64.5 87
Xiao et al. [23] ECG 3 45 5min 83.9 51.1 90.2 49.58 90.7
aryoftheasleep/awaketransitionandprobablywillmisssomeshort transitions.
Thedevelopment ofthis algorithmis atanearly stage.Beforeto beappliedinclinicalpractice,itisnecessarytoperformalargescale assessmentofthemethodtovalidateitsuse.
Asmentionedpreviously,inthisworkweusedtheheartratesignal withasamplingfrequencyof1Hz.TheAASMstipulatestheuseof25
Hzinoximetryasdesirable,and10Hzasminimumrecommended,but therearenospecificrecommendationsaboutthesamplingfrequencyof theHR[1].ConsideringtherangeofpossiblesHRfrequencies,thereis noneedforahighsamplingfrequency.
Theuseofadifferentsamplingfrequencytothatweuseinthiswork couldchangetheperformanceobtained,sincemanyfeaturesvarywith thesamplingfrequency.Inthecaseofapplyingthedesignedsystemto signalswithasamplingfrequencygreaterthan1Hz,itwillbenecessary tosubsamplethesignal.Conversely,theuseofsignalswithasampling frequencysmallerthan1Hzisnotpossiblewithoutre-performingall experimentstofindnewoptimalparameters.
Thereareseveralpreviousworksthatperformautomaticsleepstage classification.EEGisgenerallyused,butseveralalternativeshavebeen proposedforECG.However,asfarasweknow,therearenotstudies usingonlyHRfromPPG.Thecomparisonsbetweenstudiesarenot sim-ple.Differentsignals,databasesandnumberofclassesareused.Inorder tocomparewithourwork,incaseswhereitwasnecessary,the differ-entsleepstageswereconsideredasunique.However,tobefair,wewill reportwhichworksdiscriminatedsleepstagesinmoredetail.
Beattieetal.[25] usedPPGsignalsandaccelerometer.Inthatwork theauthorsconsidered5classes.ThedatabaseusedbyBeattiewas com-posedof60participantswereself-reportednormalsleepers.Wecannot make adirect comparisonbecausetheyhaveadditionalinformation. Theyuse thePPGsignal(notonlytheHRcalculatedfrom it),in ad-ditiontotheaccelerometersignals.Thebestaccuracy,sensitivityand specificityobtainedinthisworkwere90.6%,69.3%and94.6% respec-tively.
Uçaretal.[26] usedPPGandHRVfrom PPG,andthe combina-tionofthesetwotoclassifyinawakeandasleep.Thesignalsusedin thisworkcontainmoreinformationthanthoseofourwork.The con-fusionmatrixwasnotreportedinthispaper,itwasdeducedfromthe datareportedbytheauthors.Thebestaccuracy,sensitivityand speci-ficitywere76%,74%and80%respectively.Thedatabaseusedcontains registersof10patients.
Adnaneetal.[22] usedECGsignalfrom18patients(4normal sleep-ers,6mixednormalandinsomniacsleepers,and8insomniacsleepers). They onlyconsideredtwo classes.The bestaccuracy,sensitivityand specificitywere80%,69.1%and84.5%respectively.
Xiaoetal.[23] extracted41featuresfromECGandusedRFto dif-ferentiateamongwake,REMandnon-REMstages.Theresultsreported were83.94%,51.15%and90.15%ofaccuracy,sensitivityandspecificity, respectively.Theauthorsonlyanalyzeddatalabeledwith“stationary”, thatis,theyclassified5-minutewindowscorrespondingtoasingleclass. Yücelba¸setal.[24] usedECGsignalsandclassifythesleepstagein wake,REMandnon-REM.Theyusedtwodifferentdatabases.Intotal,
28patientswereconsidered.Thereportedresultswerediscriminated byhealthysubjectsandpatients.Forthefirstdatabase,theaccuracies
was87.11%forthehealthyand78.08%forthepatient.Forthesecond database,77.02%and76.79%.Thereporteddatadonotallowto com-pareallperformancemeasures.
Theresultshereobtainedareencouraging,becauseitaddressesa limitationofallapneadiagnosismethodsbasedonlyondesaturation. Therisk of overfittingin our algorithmis minimal, becausewe use alargenumberofrecordsregisteredinrealconditions.Althoughwe haveappliedstrategiestopreventtheunbalanceof classes,itcanbe seenthatinallthedevelopedmethodsthereisstillabiastowardsthe majorityclassthatshouldbeaddressedinfuturework.
TheTable7summarizessimilarworks.Otherrelatedresults,even obtainedwithEEG,canbefoundin[24].
Infuturework,thealgorithmdevelopedforpatientswillbeadapted andappliedtoobtainsimplifiedhypnogramsandtotalsleeptime esti-mation.Finally,theapneadetectionandsleepestimationsystemsfor OSAHSdiagnosiswillbeevaluatedtogether.
6. Conclusions
Inthiswork,wedevelopedanautomaticsystemtoclassifythesleep stageinawakeorasleepusingmachinelearningtechniquesfrom pho-toplethysmographicHRsignals.Itwasshownthatinformation theory-relatedfeaturesandcomplexitymeasures,andtheirextensionsto time-frequencydomain,areusefultodifferentiatebetweenawakeandasleep stages.Itwasshownthatverysimpleandinexpensivesignalssuchas thoseobtainedbypulseoximetrycanachieveperformancescomparable tothoseobtainedwithsignalsthatcontainmoreinformation.Theuse ofalargedatabaseallowsagoodgeneralizationcapacityofthe devel-opedmethod.Wedevelopedthreealternativestoeliminatethepossible redundancyoftheextractedfeatures,FFSschemesbasedonSVMand variableselectionwithRFwithartificialbalanceoftrainingdata,and FFS-SVMwithpenaltyerrorsinminorityclasswithoutbalancedclass. TheFFS-SVMwithpenalty errorin minorityclasshasslightlybetter performancethantheother methods.However,allperformances are verysimilar.Asfuturework,wewilladaptthealgorithmtoobtain sim-plifiedhypnogramsandtotalsleeptimeestimation.Theultimateaimis tousethisalgorithmandanapneaeventdetectorforOSAHSdiagnosis. Declarations
Authorcontributionstatement
RamiroCasal:Conceivedanddesignedtheexperiments;Performed the experiments; Analyzed and interpreted the data; Contributed reagents,materials,analysistoolsordata;Wrotethepaper.
Leandro E. Di Persia, Gastón Schlotthauer: Conceived and de-signedtheexperiments;Analyzedandinterpretedthedata;Contributed reagents,materials,analysistoolsordata.
Fundingstatement
ThisworkwassupportedbytheNationalAgencyforScientificand TechnologicalPromotion(ANPCyT)underprojectsPICT2014-2627and 2015-0977, UniversidadNacional del Litoral under projects CAI+D