Automatic Vehicle Detection, Tracking and
Recognition of License Plate in Real Time Videos
Lucky Kodwani
Department of Electronics and Communication Engineering
National Institute of Technology Rourkela
Automatic Vehicle Detection, Tracking and
Recognition of License Plate in Real Time Videos
Thesis submitted in partial fulfilment of the requirements for the degree of
Master of Technology
in
Communication and Signal Processing
by
Lucky Kodwani
(Roll: 211EC4105)
Under the guidance of
Prof. Sukadev Meher
Department of Electronics and Communication Engineering
National Institute of Technology Rourkela
Department of Electronics and Communication Engg
National Institute of Technology Rourkela
R
OURKELA-769 008, O
DISHA, I
NDIAMay 29, 2013
Certificate
This is to certify that the thesis titled as
Automatic Vehicle Detection,
Tracking and Recognition of License Plate in Real Time Videos
by
Lucky Kodwani
is a record of an original research work carried out
under my supervision
and guidance in partial fulfilment of the requirements
for the award of the degree of Master of Technology degree in
Electronics
and
Communication
Engineering
with
specialization
in
Communication and Signal Processing
during the session 2012-2013.
Sukadev Meher
Acknowledgement
I owe deep gratitude to the ones who have contributed greatly in completion of this thesis. Foremost, I would like to express my sincere gratitude to my advisor, Prof. Sukadev Meher for providing me with a platform to work on challenging areas of vehicle detection, tracking and automatic license plate recognition for real time videos. His profound insights and attention to details have been true inspirations to my research. Next, I would like to express my respects to Prof. S. K. Patra, Prof. K.K.Mahapatra , Prof. S. K. Behera , Prof. Poonam Singh, and Prof. A.K. Sahoo for teaching me and also helping me how to learn. They have been great sources of inspiration to me and I thank them from the bottom of my heart.
I would like to thank all the faculty members and staff of the Department of electronics and communication engineering, N.I.T.Rourkela for their generous help in various ways for completion of this thesis.
I would like to thank my lab mates Mr Deepak Panda, Mr Adiya Acharya, Mr Deepak Singh and Mr Bodhisattwa Charkraborty for their time to time advice and encouragement in my project work. Their help can never be penned with words. I would like to thank all my friends and especially my classmates Sonia Das for all the thoughtful and mind stimulating discussions we had, which prompted us to think beyond the obvious and Imran Khan for his help and support.
Most importantly, none of this would have been possible without the love and patience of my family. My family, to whom this dissertation is dedicated to, has been a constant source of love, concern, support and strength all these years. I would like to express my heartfelt gratitude to them especially to my mother.
i
Abstract
Automatic video analysis from traffic surveillance cameras is a fast-emerging field based on computer vision techniques. It is a key technology to public safety, intelligent transport system (ITS) and for efficient management of traffic. In recent years, there has been an increased scope for automatic analysis of traffic activity. We define video analytics as computer-vision-based surveillance algorithms and systems to extract contextual information from video. In traffic scenarios several monitoring objectives can be supported by the application of computer vision and pattern recognition techniques, including the detection of traffic violations (e.g., illegal turns and one-way streets) and the identification of road users (e.g., vehicles, motorbikes, and pedestrians). Currently most reliable approach is through the recognition of number plates, i.e., automatic number plate recognition (ANPR), which is also known as automatic license plate recognition (ALPR), or radio frequency transponders.
Here full-featured automatic system for vehicle detection, tracking and license plate recognition is presented. This system has many applications in pattern recognition and machine vision and they ranges from complex security systems to common areas and from parking admission to urban traffic control. This system has complex characteristics due to diverse effects as fog, rain, shadows, uneven illumination conditions, occlusion, variable distances, velocity of car, scene's angle in frame, rotation of plate, number of vehicles in the scene and others. The main objective of this work is to show a system that solves the practical problem of car identification for real scenes. All steps of the process, from video acquisition to optical character recognition are considered to achieve an automatic identification of plates.
Detection of moving objects in video streams is the first relevant step of information and background subtraction is a very popular approach for foreground segmentation. In this thesis, different background subtraction methods are simulated to overcome the problem of illumination variation, shadows, background clutter and camouflage. Next step is License plate extraction which is an important stage in license plate recognition for automated transport system. We are proposing two methods for extraction of license plates and comparing it with other existing methods. The Extracted license plates are segmented into individual characters by using a region-based method. The recognition scheme combines adaptive iterative thresholding with a template matching algorithm. The
ii
method is robust to illumination, character size and thickness, skew and small character breaks. The main advantages of this system is its real-time capability and that it does not require any additional sensor input (e.g. from infrared sensors) except a video stream. This system is evaluated on a large number of vehicle images and videos. The system is also computationally very efficient and it is suitable for others related image recognition applications. This system has wide range of applications such as access control, tolling, border patrol, traffic control, finding stolen cars, etc. Furthermore, this technology does not need any installation on cars, such as transmitter or responder.
iii
Contents
Chapter 1 ... 1
Introduction ... 1
1.1 Traffic surveillance: ... 1
1.2 Overview of the proposed model ... 3
1.2.2 Block Diagram of the Proposed System ... 5
1.2 Motivation ... 6
1.3 Problem statement ... 6
1.4 Factors influencing the performance of system ... 8
1.5 Organization of the Thesis ... 9
Chapter 2 ... 10
Vehicle Detection... 10
2.1 Categorization of motion detection ... 11
2.1.1 Frame differencing ... 11
2.1.2 Optical Flow ... 11
2.1.3 Background subtraction ... 11
2.2 Related Work... 12
2.2.1 Simple Background Subtraction ... 12
2.2.2 Running Average ... 13
2.2.3 Simple Statistical Difference (SSD) ... 13
2.2.4 Motion Detection Based on Sigma – Delta Estimation (∑ -∆) ... 14
2.2.5 Sigma-Delta Background Estimation with Confidence Measurement ... 15
2.2.6 Gaussian mixture model (GMM) ... 18
2.2.7 Algorithm for Background Estimation ... 19
2.3 Experimental Results... 20
2.3.1 Accuracy Metrics ... 27
Chapter 3 ... 37
LICENSE PLATE EXTRACTION ... 37
3.1 Pre Processing ... 38
3.1.1 Conversion of RGB image into a Gray-scale Intensity image ... 38
3.1.2 Conversion of Intensity image into a Binary image ... 38
iv
3.2 License Plate Extraction ... 40
3.2.1 Hough transform ... 41
3.2.2 Template Matching ... 42
3.2.3 Region Growing ... 44
3.2.4 Histogram approach ... 46
3.3 Proposed Method I for license plate extraction ... 46
3.3.1. Sobel edge detection ... 47
3.3.2. Removal of unwanted small connected component ... 48
3.3.3. Checking for the Noisiest Parts ... 49
3.4 Proposed Method- II for license plate extraction ... 51
3.4.1 Pre-processing ... 51
3.4.2 Morphological Operation ... 52
3.4.4 Block Variance Algorithm... 54
3.5.1 Measure of Effectiveness... 58 3.6 Comparison ... 59 Chapter 4 ... 60 Character Extraction ... 60 4.1. Character Extraction ... 60 4.1.1 Histogram approach ... 60
4.1.2 Connected pixels approach ... 61
4.2.1. Pre-processing ... 62
4.2.2. Flow Chart of template matching algorithm ... 63
4.2.3 Template shape ... 64
4.2.4 Measure of Effectiveness... 66
4.2.5 Template Matching using Euler Number ... 68
4.3 Considering the format of number plate ... 69
4.3.1. Format of Registration Number in India ... 69
4.3.2. Classification of characters in License Plate ... 69
4.3.2.1 Combinations of Characters ... 69
4.3.2.2 Grouping of Alphabets and Numbers ... 70
Chapter -5... 74
Conclusion and Future work ... 74
v
List of Figures
CHAPTER-1
Figure 1. 1:ANPR system implementation in practical scenario ... 4
Figure 1. 2:Flow chart of the system ... 4
Figure 1. 3:Block diagram of the system ... 5
Figure 1. 4:Standard license plates used in developed countries ... 7
Figure 1. 5:Indian license plates ... 7
Figure 1. 6:Example of Some Distorted Image ... 9
CHAPTER-2 Figure 2. 1 : Function used for incremental update of the confidence measurement. ... 16
Figure 2. 2: Results of Frame Difference Algorithm ... 21
Figure 2.3 : Results of Running Average Algorithm ... 22
Figure 2. 4 : Results of Simple Statistical Difference (SSD) Algorithm ... 23
Figure 2. 5 :Results of Gaussian mixture model (GMM) Algorithm ... 24
Figure 2. 6 :Results of Sigma-Delta Background Estimation with Confidence Measurement Algorithm ... 25
Figure 2. 7 : Results of Algorithm for Background Estimation Algorithm ... 26
Figure 2. 8: Traffic.21 sequence: Fitness coefficients ... 32
Figure 2. 9: Traffic.21 sequence: Error coefficients ... 32
Figure 2. 10: Traffic.38 sequence: Fitness coefficients ... 33
Figure 2. 11: Traffic.38 sequence: Error coefficients ... 33
Figure 2.12: Traffic.89 sequence: Fitness coefficients ... 34
Figure 2. 13: Traffic.89 sequence: Errors coefficients ... 34
Figure 2. 14 :Traffic.98 sequence: Fitness coefficients ... 35
Figure 2. 15: Traffic.98 sequence: Errors coefficients ... 35
Figure 2. 16: Fitness coefficient and error coefficient for Campus_raw.avi video ... 36
CHAPTER- 3 Figure 3. 1:Flow chart of license plate recognition ... 37
Figure 3. 2: Conversion from RGB Image to GRAY Image, GRAY Image to Binary Image... 39
Figure 3. 3: Hough Transform Approach ... 41
Figure 3. 4: Template created through opacity-merging of the probabilities ... 43
vi
Figure 3. 6: Steps for Region Growing ... 45
Figure 3. 7: Histogram Approach ... 46
Figure 3. 8: Flow Chart of the Method ... 47
Figure 3. 9: Car Image (a) CAR-1 (b) CAR -2 ... 48
Figure 3. 10: Sobel edge detected Images (a) CAR-1 (b) CAR-2 ... 48
Figure 3. 11: Noise removed images (a) CAR-1 (b) CAR-2 ... 49
Figure 3. 12: License Plate Area ... 49
Figure 3. 13: Flow chart of Block Variance Technique ... 51
Figure 3. 14: Probing of an image with a structuring element... 52
Figure 3. 15 :(a) Erosion and Dilation (b) Opening (c) Closing. ... 53
Figure 3. 16: Results of Proposed Block Variance Algorithm ... 55
Figure 3. 17: Result of block variance technique for CAR-2 and CAR-3 ... 56
Figure 3. 18: Some more results for block variance technique... 57
Figure 3. 19 : Measure of effectiveness ... 59
CHATER-4 Figure 4. 1: Histogram approach for character Recognition ... 61
Figure 4. 2: Connected pixels approach for character extraction ... 61
Figure 4. 3: Flow Chart of Template Matching ... 63
Figure 4. 4: Results of template matching ... 65
vii
List of Tables
Chapter -2
Table2. 1: Basic Sigma-Delta Background Estimation ... 15
Table2. 2: Sigma-Delta with Confidence Measurement ... 17
Table2. 3: Confusion Matrix ... 27
Table2. 4: pixel based accuracy result for frame difference. ... 29
Table2. 5 : pixel based accuracy result for Running Average ... 29
Table 2. 6: pixel based accuracy result for Simple Statistical Difference (SSD). ... 30
Table2. 7: pixel based accuracy result for Gaussian mixture model (GMM). ... 30
Table2. 8: pixel based accuracy result for Sigma-Delta Background Estimation with Confidence Measurement. ... 30
Table2. 9: pixel based accuracy result for W4 algorithm ... 31
Table2. 10: Results for Campus_raw.avi video ... 36
Chapter-3 Table3. 1:Capture Rate for license plate detection ... 58
Table3. 2:Comparison of different license plate extraction method ... 59
Chapter -4 Table4. 1:Read rate for character recognition ... 67
Table4. 2 :Combination of characters ... 70
Table 4. 3:Comparison of Templates ... 71
Table 4. 4: Registration Marks allotted to States and Union Territories in India are: ... 71
Lucky Kodwani 211EC4105 Page 1
Chapter 1
Introduction
The escalating increase of contemporary urban and national road networks over the last three decades emerged the need of efficient monitoring and management of road traffic. Conventional techniques for traffic measurements, such as inductive loops, sensors or EM microwave detectors, suffer from serious shortcomings, expensive to install, they demand traffic disruption during installation or maintenance, they are bulky and they are unable to detect slow or temporary stop vehicles. On the contrary, systems that are based on video are easy to install, use the existing infrastructure of traffic surveillance. Furthermore, they can be easily upgraded and they offer the flexibility to redesign the system and its functionality by simply changing the system algorithms. Those systems allow measurement of vehicle’s speed, counting the number of vehicles, classification of vehicles, and the identification of traffic incidents (such as accidents or heavy congestion).There is a wide variety of systems based on video and image processing employing different methodologies to detect vehicles and objects.
1.1
Traffic surveillance:
Traffic surveillance system is an active research topic in computer vision that tries to detect, recognize and track vehicles over a sequence of images and it also makes an attempt to understand and describe object behaviour, vehicle activity by replacing the aging old traditional method of monitoring cameras by human operators. A computer vision system can monitor both immediate unauthorized behaviour and long term suspicious behaviour, and hence alerts the human operator for deeper investigation of the event. The video surveillance system can be manual, semi-automatic, or fully-automatic depending on the human involvement. Human operator is responsible for monitoring in manual video surveillance system. The entire task is done by him by watching the visual information coming from the different cameras. It’s a tedious and arduous job of an operator to watch the multiple screens and at the same time to be vigilant from any
Lucky Kodwani 211EC4105 Page 2 unfortunate event. These systems are proving to be ineffective for busy large places as the number of cameras exceeds the capability of human experts. Such systems are in widespread across the world. The semi-automatic traffic surveillance system takes the help of both human operator and computer vision. The object is being tracked by the computer vision algorithm and the job of classification, personal identification, and activity recognition is done by the human operator. Lower level of video processing is used in these systems, and much of the task is done with the help of human operator intervention. In the fully-automatic system there is no human intervention and the entire job is being done by the computer vision. These systems are intelligent enough to automatically track, classify, and recognise the object. In addition, it intelligently detects the suspicious behaviour and does the activity recognition of the object.
In urban environment, monitoring congestion across the road, vehicle interaction and detection of traffic rule violation can be done with visual surveillance systems [1]. The Video surveillance system can prevent serious accidents, so that precious lives can be saved. ANPR is a very specialized well-researched application for video analytics. Toll stations of freeways have dedicated lanes with cameras, where registered users can slowly pass without stopping [2]. In contrast, inner city congestion charge systems (e.g., Stockholm, Sweden; London, U.K., and Singapore) have to be less intrusive and operate on the normal flow of passing traffic (free-flow tolling).
For most traffic surveillance systems there are three major stages which are used for estimation of desired traffic parameters i.e. vehicle detection, tracking, and classification. For detection of vehicles, most of the methods [6]-[12] assume that the camera is static and then desired vehicles can be detected by image differencing. Tracking is a very important issue in computer vision. Recently, there is a deep interest in surveillance applications. The main purpose of tracking in computer vision is to recognize and locate a prototype in a series of sequential frames. Many applications are based on tracking such as video processing, security, surveillance and automatic procedures. Then, different tracking scheme are designed to track each vehicle. After that, several vehicle features like shape, length, width, texture, license number etc., are extracted for vehicle classification. Every visual surveillance systems start with detecting moving object in video streams.[19]
Lucky Kodwani 211EC4105 Page 3 Traffic surveillance system can provide effective and efficient application ranging from commercial and public security, Military security, visual surveillance, crowd flux statistics and congestion analysis, person identification, detection of anomalous behaviour, etc.
1.2 Overview of the proposed model
A typical surveillance system consists of a traffic camera network, which processes captured traffic video on-site and transmits the extracted parameters in real time. Here our focus is on the study of algorithmic part of such a system.
In this thesis, we present full-featured vehicle detection, tracking and license plate recognition system framework, particularly designed to work on video footage. This system mainly having four modules:-
Video Acquisition
Vehicle detection and tracking License plate extraction Character recognition unit
This system is used to detect, recognize and track vehicle from incoming video frames in dynamic scenes then extract the license plate from it as shown in Figure 1.1. It has found numerous applications as wide as possible such as: access control in security sensitive areas, securities for communities and important buildings, detection of military target areas, traffic surveillance in cities and highways, detection of anomalies behaviour, traffic control management for recognize vehicles that commit traffic violation, such as occupying lanes reserved for public transport, breaking speed limits, crossing red light, entering restricted area without permission; and among many other applications.
The system is designed for real time videos where a camera is used for continuous recording of videos. The view of camera or the area covered by camera is fixed between entry zone and exist zone. Each frame is continuously processed to check the presence of a vehicle. A defined connected component area is taken as threshold; if the detected area
Lucky Kodwani 211EC4105 Page 4 Figure 1. 1 ANPR system implementation in practical scenario
is above that threshold value then it will be recognized as a vehicle and will be tracked. A distance is defined between the vehicle and the camera and when the vehicle comes within that range i.e vehicle’s connected component area is maximum, these frames of video are passed to license plate recognition algorithm. After that recognition of character takes place and data is stored and compare with data base. The flow chart of the system is shown in Figure 1.2.
Lucky Kodwani 211EC4105 Page 5 .
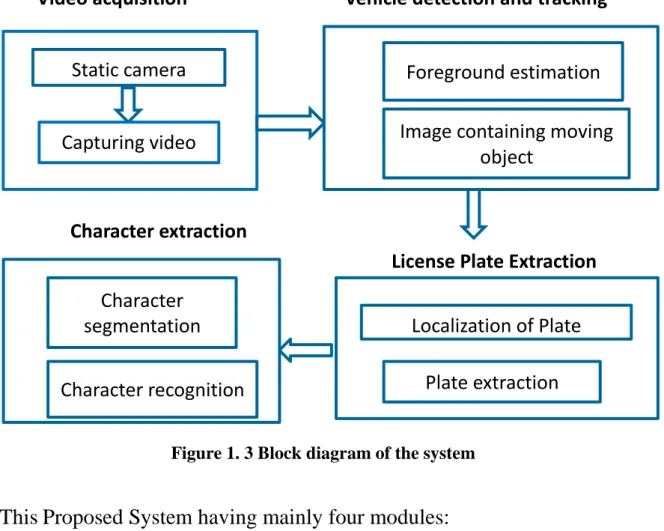
1.2.2 Block Diagram of the Proposed System
Figure 1. 3 Block diagram of the system
This Proposed System having mainly four modules:
Video Acquisition – In this module videos are taken by the static camera situated at traffic scenario. A camera network that has the ability to transmit images in real time to a central operational centre. The processing of the images can be carried out on-site saving valuable network bandwidth as it transmits only the outcome of the calculations. The whole process can also be performed either in real time video streaming from an operational centre or in already stored video material. Vehicle Detection And Tracking – In vehicle detection we have simulated various
background subtraction techniques available in the literature. The background subtraction technique should overcome the problems of varying illumination condition, background clutter, camouflage and shadow. Motion segmentation of foreground object has been done in real time. It’s hard to get this entire problem
Video acquisition
Foreground estimation
Image containing moving
object
Localization of Plate
Plate extraction
License Plate Extraction
Vehicle detection and tracking
Character extraction
Character recognition
Character
segmentation
Static camera
Capturing video
sequences
Lucky Kodwani 211EC4105 Page 6 solved in one background subtraction technique. So the idea was to simulate and evaluate their performance on various video data taken in different situations.
License Plate Extraction - License plates are first located in current frame then they are extracted using various available techniques in the literature based on Hough Transform method, Template matching technique, Region growing algorithm, Histogram Approach and Edge Detection Approach.
Character Extraction – Images of the extracted plates are the input to this module. Here first license plate image is cropped in lines, and then characters are segmented and recognized.
1.2 Motivation
Traffic surveillance is the most active research topic in computer vision for humans and vehicles. Our aim is to develop an intelligent automatic License plate recognition in real time surveillance videos and replacing the age old traditional method of monitoring by human operators. Now a day the license plate recognition has been essential due to the rapidly growing number of cars. The increasing number of automobiles has facilitated human life but it has also lead to various issues of traffic congestions, parking problems, accidents etc. Our motivation in doing is to design a traffic surveillance system for vehicle detection, tracking and license plate recognition in real time videos using visual surveillance techniques.
1.3 Problem statement
To design and develop a real-time detection, tracking and license plate recognition system that will work efficiently under the conditions of slow moving objects and the objects that are merged into the background due to a temporary stop and becoming foreground again, adaptive to different traffic environment conditions, robustness against progressive or sudden illumination changes, Occlusions, identification time of the system should be as short as possible. The system should detect all the types of vehicles, recognize all the license plates of the country and should also be resistant to any kinds of disturbances, which may occur in images and mechanical plate damages which may appear in reality.
Lucky Kodwani 211EC4105 Page 7 The attributes of the License plates play important role in the recognition process. The size, colour of the license plate, its font face i.e. size, colour of each character, spacing between characters, the number of lines in the license plate, script, characters’ height and width are maintained very strictly in developed countries. There are several countries in the world who have adapted this very method of standardizing the License plate. Some of the standard license plates used in developed countries are shown in Figure 1.4.
Figure 1. 4 standard license plates used in developed countries
But in India, the license plate is purely localized and people don’t follow the standard pattern assigned by Indian government, so the recognition process is quite difficult. Some of the Indian license plates with variations in shape, script, etc. are shown in Figure: 1.5.
Lucky Kodwani 211EC4105 Page 8 Apart from these conditions, the algorithms applied for the recognition also plays a vital role. If the quality of the algorithm is good, then more varieties of images can be given as input to the system, and this will also reduce the computation speed of the process. The most basic issues in the real-time ALPR system is the accuracy and the recognition speed.
Every system should fulfil the following demands:
The identification time of the system should be as short as possible. The system should detect all the types of vehicles.
The system should recognize all the license plates of the country.
The system should also be unaffected to any kinds of disturbances, which may occur in images and mechanical plate damages which may appear in reality. Other than this, there are several other parameters on which the quality of the recognition depends. These limitations are
High quality imaging – the quality of the captured image is high, so that it will be easy to evaluate the attributes of the image.
Minimal skewing and rotation – the camera is fit such that the captured image or video will not suffer much decent angle of skewing and rotation.
Better Flash – as the License plate is retro-reflective in nature, so if high illumination will be there, then the LP region will be much more brightened and the attributes of the license plate will not be much clearer.
1.4 Factors influencing the performance of system
Factors, which may have a negative influence on the results of this system, can be classified into a few groups: weather conditions, lighting, license plate placement in the picture, vehicle movement, mechanical plate damages, and other captions in the picture etc. some examples are shown in figure 1.6. Most of the above mentioned factors could be eliminated by the use of proper lighting, specialist equipment recording the videos, designing a workplace and by the use of proper computer image processing techniques. Without such care the system may become a highly complicated problem.
Lucky Kodwani 211EC4105 Page 9
Figure 1. 6 Example of Some Distorted Image
1.5 Organization of the Thesis
The remaining part of the thesis is organized as follows
Chapter 2 presents a brief survey of vehicle detection in real time. Different methods are discussed in detail and their comparisons are shown.
Chapter 3 describes the license plate extraction using different existing methods and proposing two methods and showing their comparisons with other existing methods. Chapter 4 character segmentation part is discussed.
Lucky Kodwani 211EC4105 Page 10
Chapter 2
Vehicle Detection
Traffic surveillance is used by private companies, governments and public organizations for efficient management of transport networks, road safety, public safety in highways and busy streets. A static camera observing a scene is a common case of a surveillance system. Identifying intruding objects is an important step in analysing the scene and successful segmentation of moving foreground object from the background ensures object classification, vehicle identification, tracking, and activity analysis, making these later steps more efficient.
The task of moving object segmentation is to extract meaningful information about the moving vehicle from video sequences, which provides the convenience of object-based representation and manipulation of video content. It is an essential step for many computer vision applications such as video compression, video retrieval, video surveillance, and pattern recognition. Conventional approaches to moving object segmentation include frame difference methods, background subtraction methods, and optical flow methods [3].
Foreground estimation and segmentation is the first stage of several traffic surveillance systems. The foreground regions are marked (e.g., mask image) for processing in the subsequent steps. There are two main different approaches to estimate the foreground, which both use strong assumptions to comply with the aforementioned definition. First, a background model of some kind can be used to accumulate information about the scene background of a video sequence. The model is then compared to the current frame to identify differences (or “motion”), provided that the camera is stationary. This concept lends itself well for computer implementation but leads to problems with slow-moving traffic. Any car should be considered foreground, but stationary objects are missed due to the lack of motion.[18]
Hu et al. [1] categorized motion detection into three major classes of method as frame differencing, optical flow, and background subtraction.
Lucky Kodwani 211EC4105 Page 11
2.1 Categorization of motion detection
2.1.1 Frame differencing
Frame differencing [4] is a pixel-wise differencing between two or three consecutive frames in an image sequence to detect regions corresponding to moving object such as human and vehicles. The threshold function determines change and it depends on the speed of object motion. If the speed of the object changes significantly, then it’s difficult to maintain the quality of segmentation. The inter-frame differencing approach detects parts of moving objects by comparing two successive frames. But, it can identify only differences in the background and, for that reason; it detects only parts of a vehicle covering the background in the previous frame. Despite some enhancing techniques [4] this approach cannot satisfactorily deal with realistic traffic circumstances where vehicles might remain still for a long time.
2.1.2 Optical Flow
To detect moving regions in an image, optical flow [5] uses flow vectors of the moving objects over time. It is used for motion-based segmentation and tracking applications. It is a dense field of displacement vectors which defines the translation of each pixel region. Optical flow is best suited in presence of camera motion, but however most flow computation methods are computationally complex and sensitive to noise.
2.1.3 Background subtraction
The background subtraction [6], [7], [8], [9], [10], and [11] is the most popular and common approach for motion detection. In this method the current image is subtracted from a reference background image, which is upgraded during a period of time. It works well only in the presence of stationary cameras. The subtraction leaves only non-stationary or new objects, which include whole silhouette region of an object. This approach is simple and computationally affordable for real-time systems, but is extremely sensitive to dynamic scene changes from lightning and extraneous event etc. Therefore it is highly dependent on a good background maintenance model.
Lucky Kodwani 211EC4105 Page 12 Here in this chapter we have simulated different background subtraction techniques available in the literature for motion segmentation of object. The problem with background subtraction [8], [9] is to automatically update the background from the incoming video frame and it should be able to overcome the following problems:
Motion in the background: Non-stationary background regions, such as leaves and branches of trees, a flag waving in the wind, or flowing water, should be identified as part of the background.
Illumination changes: The background model should be able to adapt, to gradual changes in illumination over a period of time,
Memory: The background module should not use much resource, in terms of computing power and memory.
Shadows: Shadows cast by moving object should be identified as part of the background and not foreground.
Camouflage: Moving object should be detected even if pixel characteristics are similar to those of the background.
Bootstrapping: The background model must be maintained even in the absence of training background (absence of foreground object).
2.2 Related Work
A large literature exists concerning moving object detection in video streams and to construct reliable background from incoming video frames. It’s hard to get all the above problem solved in one background subtraction technique. So the idea was to simulate different background subtraction techniques available in the literature and evaluate their performance on various video data taken in complex situation.
2.2.1 Simple Background Subtraction
In simple background subtraction technique an absolute difference is taken between every current image ( ) and the reference background image ( ) to find out the
Lucky Kodwani 211EC4105 Page 13 motion detection mask ( ) The reference image of the background is generally the first frame of a video, without containing foreground object.
( ) { | ( ) ( )|
(2. 1)
Where τ is a threshold, which decides whether the pixel is foreground or background. If the absolute difference is greater than or equal to τ, the pixel is classified as foreground; otherwise the pixel is classified as background.
2.2.2 Running Average
Simple background subtraction cannot handle illumination variation and results in noise in the motion detection mask. The problem of noise can be overcome, if the background is made adaptive to temporal changes and updated in every frame.
( ) ( ) ( ) ( ) (2. 2)
Where is a learning rate. The motion detection mask ( ) is calculated as follows: ( ) { | ( ) ( )|
( 2. 3)
- Threshold value 2.2.3 Simple Statistical Difference (SSD)
Simple Statistical Difference method (SSD) computes the mean and the standard deviation for each pixel (x, y) in the background image containing K images in the
time interval [
∑
( )
(2. 4) ( ∑ ( ( ) ) ) ⁄ (2. 5)For motion detection, difference between the current image ( ) and the mean
Lucky Kodwani 211EC4105 Page 14
( ) { ( ( ) )
(2. 6)
2.2.4 Motion Detection Based on Sigma – Delta Estimation (∑ -∆)
At each frame, Σ − ∆ (SDE) estimates the background by incrementing the value by one if it is smaller than sample, or decremented by one if it is greater than the sample [11]. This algorithm uses the sign function which is defined as
( ) {
(2. 7)
The background estimated by this method is an approximation of the median of (x, y).The absolute difference between (x, y) and (x, y) gives the difference ( ). The binary motion detection mask D(x, y) is computed from the comparison of difference
( ) and time variance ( ) If ( ) is smaller than time variance ( ), it corresponds to background pixel or otherwise it is the foreground pixel. The time variance ( ) of the pixels signifies their motion activity measure. As described in Table 2.1.
Lucky Kodwani 211EC4105 Page 15 Table2. 1: Basic Sigma-Delta Background Estimation
Algorithm 1: Background detection based on sigma - Delta Result : Binary motion detection mask ( )
Initialization
( ) ( ) // Initialize background model B
( ) // Initialize variance V N = 4
For each frame(t) do
For each pixel (x, y) do
( ) | ( ) ( )| // Compute current difference
If ( )
( ) ( ) ( ( ) ( ))
If ( ) ( ) // compute detection mask D
( )
Else
( )
If ( ) // update background
( ) ( ) ( ( ) ( ))
2.2.5 Sigma-Delta Background Estimation with Confidence Measurement
The adaptation of the basic sigma-delta algorithm introduces a confidence measurement that is tied to each pixel and quantifies the trust the current value of that pixel deserves. This enables a mechanism that provides better balance between adaptation to illumination or background changes and prevention against undesirable background-model contamination. The final goal is to preserve the background model from being corrupted with slow-moving vehicles or vehicles that are motionless for a time gap, without compromising real-time implementation. [12]
Lucky Kodwani 211EC4105 Page 16 Three new images are required with respect to the basic sigma-delta algorithm: 1) the frame counter image( ) ; 2) the detection counter image ( ) and 3) the confidence image( ).
The variance image in this algorithm represents the variability of pixel intensities when no objects are over that pixel. A low variance should be interpreted as having a “stable background model” that has to be maintained. A high variance should be interpreted as “the algorithm has to look for a stable background model.” The main background and variance-selective updating mechanism is linked to the “refresh period.” Each time that this period expires, then updating action is taken.
The detection ratio ( ) can be used as an estimation of the traffic flow. The values of this detection ratio above 80% are typically related to the presence of stopped vehicles or traffic congestion over the corresponding pixels. If this is not the case, then the updating action is permitted.
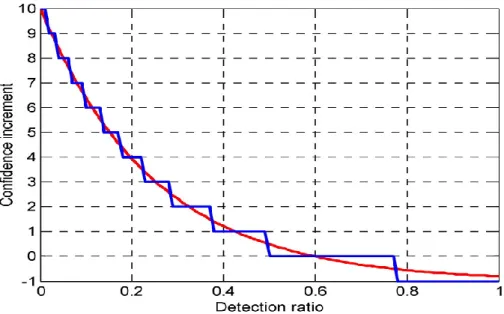
Figure 2. 1 : Function used for incremental update of the confidence measurement. A parallel mechanism is set up to update the confidence measurement. The principle mechanism is, higher the confidence level is, the lower the updating need for the corresponding pixel is. This is controlled by “confidence period” which is not a constant period of time depends on the confidence itself, for each particular pixel. Specifically, the confidence period length is given by a number of frames equal to the confidence value at the corresponding pixel. Each time the confidence period expires, the confidence measure
Lucky Kodwani 211EC4105 Page 17 Table2. 2: Sigma-Delta with Confidence Measurement
Lucky Kodwani 211EC4105 Page 18 is incrementally updated according to an exponentially decreasing function of the detection ratio as shown in Figure 2.1
( ) ( ( ) )). (2. 8)
The gain is tuned as the confidence maximum increment where as defining the increment decay rate. In our implementation ; therefore, the maximum confidence increment is ten frames, and , which adjusts the crossing of the function with − 0.5 around 75% – 80% of the detection rates. When the confidence is decremented down to minimum, background updating is force to occur.
2.2.6 Gaussian mixture model (GMM)
The GMM methodology models each pixel history as a cluster of Gaussian type distributions and uses an on-line approximation to update its parameters. As per this method, the background is found as the expected value of the distribution corresponding to the most populated cluster [13]. The stability of the Gaussian distributions is evaluated to estimate if they are the result of a more stable background process or a short-term foreground process. Each pixel is classified to be a background if the distribution that represents it is stable above a threshold. The model can deal with lighting changes and repetitive clutter. The computational complexity is higher than standard background subtraction methods. This methodology is greatly improved on grounds of performance by considering recursive equations to adaptively update the parameters of the Gaussian model. [14]- [15]
A pixel at time t is modeled as mixture of K Gaussian [10] distributions. The probability of observing the current pixel value is given by
( ) ∑ ( ) (2. 9)
Where , and are the estimate weight, mean value and covariance matrix of
Gaussian in the mixture at time t. ( ) is the Gaussian probability density
function equation (2) ( ) ( ) | |⁄ ( ) ( ) ( 2. 10)
Lucky Kodwani 211EC4105 Page 19 2.2.7 Algorithm for Background Estimation
[10] Algorithm involves locating moving objects in complex road scenes by implementing an advanced background subtraction methodology; this model is a simple and effective method for segmentation of foreground objects. In the training period each pixel uses three values; minimum ( ), maximum ( ), and the maximum intensity difference of pixels in the consecutive frames ( ), for modelling of the background scene.
Let V be an array containing N consecutive images, ( )†is the intensity of a pixel location ( ) in the i th image of V. ( )†and ( ) are the standard deviation and median value of intensities at pixel location (x,y) in all images in V. The initial background for a pixel location (x, y) is obtained as follows:
[ ( ) ( ) ( ) ] [ { ( )} { ( )} {| ( ) ( )|} ] ( 2. 11) Where | ( ) ( )| ( )
The background is changing, cannot remain same for a long period of time, so the initial background needs to be updated. uses pixel-based update method to cope with illumination variation and physical deposition of object. uses change map for background updating.The background reconstruction algorithm is a heuristic that provides a periodically updated background and enhances the efficiency of the well-known background subtraction methodology in case of outdoor environment, and it is a key process for a typical background subtraction algorithm, because it supports the weakest part of it, which is the initialization step.
A detection support map ( ) computes the number of times the pixel (x, y) is classified as background pixel.
( ) { ( )
( ) ( 2. 12 )
A motion support map ( ) computes the number of times the pixel (x, y) is classified as moving pixel.
Lucky Kodwani 211EC4105 Page 20 ( ) { ( ) ( ) ( ) ( ) ( 2. 13) Where ( ) { (| ( ) ( )| ) (| ( ) ( )| )
The new background model is given by:
[ ( ) ( ) ( ) { [ ( ) ( ) ( )] ( ( ) ) [ ( ) ( ) ( )] ( ( ) ) [ ( ) ( ) ( )] (2. 14) where k and r is taken to be 0.8 and 0.1 respectively. The current pixel (x, y) is classified into background and foreground by the following equation.
( ) { { (( ( ) ( ) ) ( ( ) ( )) ) (2. 15)
2.3 Experimental Results
Performance evaluation of different background subtraction techniques have been tested for traffiv.avi video taken from data base. Specification of traffic.avi video is:
Bits per Pixel = 24 Frame Rate = 15 Height = 120
Lucky Kodwani 211EC4105 Page 21 Video Format = RGB24
Width = 160
Simple Background Subtraction (Frame Difference) Original video Ground truth Foreground detection
Tracking
(a) (b) (c) (d)
Figure 2. 2 Results of Frame Difference Algorithm
Lucky Kodwani 211EC4105 Page 22 Running Average
Original video Ground truth Foreground detection
Tracking
(a) (b) (c) (d)
Figure 2.3 : Results of Running Average Algorithm
Lucky Kodwani 211EC4105 Page 23 Simple Statistical Difference (SSD)
Original video Ground truth Foreground detection
Tracking
(a) (b) (c) (d)
Figure 2. 4 : Results of Simple Statistical Difference (SSD) Algorithm
Lucky Kodwani 211EC4105 Page 24 Gaussian mixture model (GMM)
Original video Ground truth Foreground detection
Tracking
(a) (b) (c) (d)
Figure 2. 5 Results of Gaussian mixture model (GMM) Algorithm
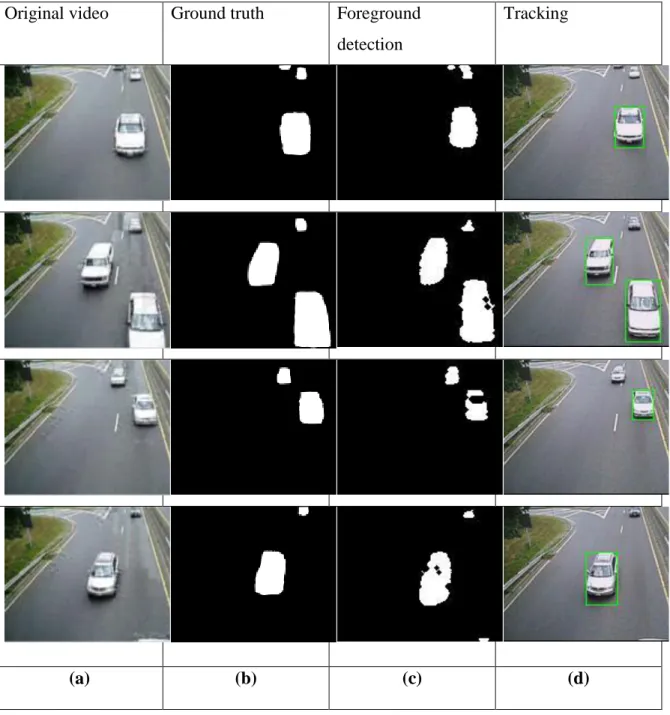
Lucky Kodwani 211EC4105 Page 25 Sigma-Delta Background Estimation with Confidence Measurement
Original video Ground truth Foreground detection
Tracking
(a) (b) (c) (d)
Figure 2. 6 Results of Sigma-Delta Background Estimation with Confidence Measurement Algorithm
Lucky Kodwani 211EC4105 Page 26 Algorithm for Background Estimation
Original video Ground truth Foreground detection
Tracking
(a) (b) (c) (d)
Figure 2. 7 Results of Algorithm for Background Estimation Algorithm
Lucky Kodwani 211EC4105 Page 27 2.3.1 Accuracy Metrics
In this section, a more technically accurate performance study is conducted, making use of some segmentation quality metrics for quantifying the correctness of the foreground detection provided by algorithm in the traffic.avi standard video in sequence traffic.21, taffic.38, traffic.89 and traffic.98.
In a binary decision problem, the classifier labels sample as either positive or negative. In our context, samples are pixel values, “positive” means foreground object pixel, and “negative” means background pixel.[19] To quantify the classification performance, with respect to some ground-truth classification, the following four basic measures can be used:
True positives (TP): correctly classified foreground pixels; True negatives (TN): correctly classified background pixels; False positives (FP): incorrectly classified foreground pixels; False negatives (FN): incorrectly classified background pixels;
Table 2. 3 Confusion Matrix Actual positives Actual negatives Estimated Positives TP FP Estimated Negatives FN TN
The confusion matrix can be used to represent a single point in either receiver operator characteristics (ROC) space or precision recall (PR) space. ROC curves show how the number of correctly classified positive examples varies with the number of incorrectly classified examples, i.e., TPR versus FPR, as given by
Lucky Kodwani 211EC4105 Page 28 FP rate: TPR =
(2. 17)
Precision:(2. 18)
Recall: RE = TPR. (2. 19) F-measure:= 2
(
)
(2. 20)
Jaccard coefficient:=
, 0 ≤
≤ 1 (2. 21)
Yule coefficient:=
+
-1, (−1 ≤
≤1) (2. 22)
Finally, Ilyas et al.[12] here a weighted Euclidean distance is presented, considering the deviations of FPR and TPR from their respective ideal values 0 and 1. It is defined as follows:
√( ) ( )( ) (2. 23)
Where γ (0 < γ < 1) is a weighting coefficient, which has to be adjusted according to the desired tradeoff between sensitivity and specificity. In this section, the following index sets have been considered as a valuable quantification of relative performance of each algorithm:
S = { , , } , E = { , }
The first set includes fitness coefficients with an ideal value equal to 1, whereas the second set includes fitness errors with an ideal value equal to 0.
Lucky Kodwani 211EC4105 Page 29 Table 2. 4: pixel based accuracy result for frame difference.
Frame difference (frame no.) 21 38 89 98 PR 0.9552 0.8137 0.8750 0.9003 RE 0.8458 0.9473 0.7459 0.7457 0.9376 0.8748 0.7723 0.8520 0.8206 0.7324 0.6064 0.7026 0.9369 0.7957 0.9484 0.9755 0.1201 0.0336 0.2933 0.2069 0.0797 0.0114 0.2211 0.1506 0.0271 0.0835 0.1271 0.0772
Table 2. 5 : pixel based accuracy result for Running Average Running average (Frame no.) 21 38 89 98 PR 0.9199 0.9019 0.7515 0.8736 RE 0.8391 0.9244 0.7329 0.7307 0.8774 0.9130 0.7420 0.7949 0.7359 0.7849 0.6728 0.7324 0.9038 0.8780 0.7377 0.8508 0.1260 0.0527 0.2180 0.2189 0.0846 0.0257 0.1598 0.1612 0.0307 0.0910 0.0839 0.0849
Lucky Kodwani 211EC4105 Page 30 Table 2. 6: pixel based accuracy result for Simple Statistical Difference (SSD).
SSD (Frame no.) 21 38 89 98 PR 0.9143 0.9626 0.8088 0.9112 RE 0.8731 0.9039 0.7227 0.7099 0.8932 0.9322 0.7630 0.8307 0.7572 0.8126 0.6959 0.7756 0.9012 0.9331 0.7932 0.9819 0.0966 0.0701 0.2268 0.2379 0.0606 0.0393 0.1669 0.1759 0.0138 0.0995 0.0889 0.0951
Table 2. 7: pixel based accuracy result for Gaussian mixture model (GMM).
GMM (Frame no.) 21 38 89 98 PR 0.8801 0.9280 0.7779 0.9516 RE 0.9972 0.9591 0.9111 0.8332 0.9346 0.9433 0.8774 0.8880 0.8171 0.8290 0.7359 0.7501 0.8752 0.9090 0.7755 0.9360 0.0892 0.0226 0.0772 0.1311 0.0732 0.1010 0.0634 0.0887 0.0524 0.0750 0.0456 0.0336
Table 2. 8: pixel based accuracy result for Sigma-Delta Background Estimation with Confidence Measurement.
Lucky Kodwani 211EC4105 Page 31 Sigma-delta with con. (Frame no.) 21 38 89 98 PR 0.9912 0.9992 0.8809 0.9697 RE 0.7395 0.7531 0.7337 0.6939 0.7987 0.8899 0.7996 0.7545 0.7350 0.7527 0.7380 0.6894 0.9438 0.9249 0.8644 0.9198 0.2988 0.2004 0.2173 0.2383 0.2256 0.1453 0.1591 0.2578 0.1302 0.0753 0.0833 0.1530
Table 2. 9: pixel based accuracy result for W4 algorithm
W4 (Frame no.) 21 38 89 98 PR 0.7296 0.8196 0.7127 0.6756 RE 0.9041 0.8175 0.7157 0.7501 0.8062 0.8655 0.7009 0.7102 0.7459 0.7201 0.6295 0.6424 0.7218 0.7972 0.7734 0.6561 0.0699 0.0592 0.1329 0.2898 0.0391 0.0319 0.1719 0.2186 0.0997 0.0972 0.0926 0.1261
Lucky Kodwani 211EC4105 Page 32 Figure 2. 8: Traffic.21 sequence: Fitness coefficients
Lucky Kodwani 211EC4105 Page 33 Figure 2. 10: Traffic.38 sequence: Fitness coefficients
Lucky Kodwani 211EC4105 Page 34 Figure 2.12: Traffic.89 sequence: Fitness coefficients
Lucky Kodwani 211EC4105 Page 35 Figure 2. 14 :Traffic.98 sequence: Fitness coefficients
Lucky Kodwani 211EC4105 Page 36 Results for Campus_raw.avi video has been taken from data base.
Table 2. 10: Results for Campus_raw.avi video
Parameters Fram_diff Runn_avg SSD GMM SD_CON W4
PR 0.7682 0.7132 0.8750 0.8303 0.9432 0.8632 RE 0.6852 0.7394 0.7975 0.8542 0.8321 0.9854 0.6532 0.6821 0.7372 0.8956 0.9376 0.8524 0.7542 0.7214 0.7211 0.7324 0.8306 0.9124 0.7102 0.7957 0.8612 0.9362 0.9296 0.8594 0.1286 0.0363 0.1252 0.1305 0.1102 0.1404 0.2356 0.0141 0.1752 0.1506 0.0977 0.0856 0.1925 0.0835 0.1986 0.0972 0.0172 0.1117
Lucky Kodwani 211EC4105 Page 37
Chapter 3
LICENSE PLATE EXTRACTION
License plate recognition (LPR) is one form of ITS (Intelligent Transport System) technology that not only recognizes and counts the number of vehicles but also differentiates them. For some applications, such as electronic toll collection and red-light violation enforcement, LPR records license plates alphanumerically so the vehicle owner can be assessed the appropriate amount of fine. In others cases, like commercial vehicle operations or secure-access control, a vehicle's license plate is compared against a database of acceptable ones to determine whether a truck can bypass a weigh station or a car can enter a gated community or parking lot. [20]
A license plate is the unique identification of a vehicle. The basic issues in real-time license plate recognition are the accuracy and the recognition speed. License Plate Recognition (LPR) has been applied in numerous applications such as automatically identifying vehicles in parking lots, access control in a restricted area and detecting and verifying stolen vehicles. Quality of algorithms used in a license plate detector determines the speed and accuracy of the license plate detection. In the past, a number of techniques have been proposed for locating the plate through visual image processing.
Figure 3. 1Flow chart of license plate recognition
Input Image Camera
License plate extraction /segmentation
Character segmentation
Optical Character Recognition
Lucky Kodwani 211EC4105 Page 38 A video is taken from a camera, and then each frame of the video is processed as the image. In this stage the license plate region from the given image is located and isolated. Quality of the image plays an important part hence prior to this stage pre-processing of the image is necessary. So first each frame pre-processed by binarization, noise reduction and edge detection. Then, the license plate is located by different image processing technique.
3.1 Pre Processing
Intensity transformations are applied to enhance the quality of the image for further processing. The following transformations are applied on the colour JPEG image:
Conversion of RGB image into a Gray-scale Intensity image. Conversion of Intensity image into a Binary image.
Conversion of Gray-scale Image into an edge detected image. 3.1.1 Conversion of RGB image into a Gray-scale Intensity image
MATLAB built-in functions are used for the above transformations.
The image that is acquired from the camera can be an RGB colour image or a Grayscale Intensity image. The algorithm has to check for the RGB image and then has to convert it into a Grayscale image, because all the further processing is done in Grayscale format. Grayscale is chosen because of its simplicity in processing and for its two dimensional matrix nature, and also it contains enough information needed for the actual recognition. The conversion is performed by using the MATLAB function rgb2gray.
3.1.2 Conversion of Intensity image into a Binary image
This transformation, also known as Image Quantization, produces a binary image from the intensity image by comparing pixel intensities with a threshold. This stage is very critical for the separation of license plate from the acquired car image. The license plate is assumed to have black characters on a white background and also it is assumed that all the license plates for various cars have approximately the same uniform colour.
Lucky Kodwani 211EC4105 Page 39 Taking the advantage of its brighter background area, the license plate can be separated from the relatively darker car image.
The threshold for binarization can be two types static or dynamic. In static general threshold is taken 150 (in gray scale of 0-255). This value reasonably quantizes those pixels, which represents the license plate and any other portions, which has a pixel-value more than the selected threshold. The remaining portions, which have a pixel-value less than the threshold value, are darkened, as shown in Figure 3.2. In dynamic threshold, the threshold taken will be the average of low and median gray scale values.
The conversion is done by using the MATLAB function im2bw.
Figure 3. 2: Conversion from RGB Image to GRAY Image, GRAY Image to Binary Image
Lucky Kodwani 211EC4105 Page 40 3.1.3 Conversion of Gray-scale Image into an edge detected image
The Gray scale image is converted into edge detected image. Edge supports six different edge-finding methods as follows
The Sobel method finds edges of an image using the Sobel approximation to the derivative. It produces edges at those points where the gradient of an image is maximum.
The Prewitt method finds edges using the Prewitt approximation to the derivative. It gives edges at those points where the gradient of an image is maximum.
The Roberts method finds edges using the Roberts approximation to the derivative. It produces edges at those points where the gradient of an image is maximum.
The Laplacian of Gaussian method finds edges by looking for zero crossings after filtering an image with a Laplacian of Gaussian filter.
The zero-cross method produces edges by looking for zero crossings after filtering an image with a filter you specify.
The Canny method finds edges by looking for local maxima of the gradient of an image. The gradient is calculated using the derivative of a Gaussian filter. This technique employs two thresholds, to identify strong and weak edges, and comprises the weak edges in the output only if they are connected to strong edges. This method is therefore less prone than others to be affected by noise, and more likely to detect the weak edges.
Out of all these, Sobel edge detection gives the better results. So Sobel edge detection is taken.The conversion is performed by using the MATLAB function edge.
3.2 License Plate Extraction
Once the Pre-processing is done there are many ways to extract the License plate. They are
Hough Transform Template matching
Lucky Kodwani 211EC4105 Page 41 Region growing
Histogram Approach 3.2.1 Hough transform
In Hough transform approach, the first step is to threshold the Gray scale source image. Then the resulting image is passed through two parallel processes for the extraction of horizontal and vertical line segments respectively.
The first step in both of these sequences is to extract edges. The result is a binary image with edges highlighted. This image is then used as input to the Hough transform, which produces a list of lines in the form of accumulator cells. These cells are then analysed and line segments are computed.
Finally the list of horizontal and vertical line segments is combined and any rectangular regions matching the dimensions of a license plate are kept as candidate regions. This also gives the output of the algorithm.
Lucky Kodwani 211EC4105 Page 42 3.2.2 Template Matching
The main concept behind extraction through template matching is, that by comparing each portion of the investigated image to a template license plate, the actual license plate in the image is found as the region bearing the most resemblance to the template.
The way the template is constructed plays a significant role in the success of template matching. There are no rules for template construction but the template must be constructed in such a way, that it has all the characteristics of a license plate as it is presented in the source image.[25]
Advantages Explanation
Scaling invariant Since the algorithm does not look for regions of particular size, it is invariant to scaling of the license plate
Relatively independent of license plate colour
As long as the license plate is brighter than the surroundings, the plate is usually correctly extracted.
Limitations Explanation
Trouble detecting vertical lines Vertical lines in the license plate are typically more than a factor four shorter than the horizontal lines and thus more susceptible to noise.
Finds more than just the license plate
All rectangular regions with dimensions equal to that of a license plate are identified, which is sometimes many. This makes it difficult to choose the correct candidate later.
Lucky Kodwani 211EC4105 Page 43 When examining the source images in the training set, it is quite obvious that there are two major differences in the plates. The plates vary in size because of the fact that the cars are at different distances and the license plates vary in light intensity due to different lighting conditions when the images are taken. Both are issues that cannot be handled by the template construction. The size issue cannot be helped at all. This observation might very well turn out to be critical for this approach, but for now that fact will be ignored and the attention turned to the lighting issue. This can be helped by proper image pre-processing.
Figure 3. 4: Template created through opacity-merging of the probabilities The left hand side shows an alphabet template and the right hand side a digit template.
Advantages Explanation
Single and simple similarity measure Template matching is a strong approach or finding a single similarity measure between two images. Through a simple off-the-page algorithm this measure can be easily calculated with good results without an investigation of the specifics of the region sought after. Often, using a sample region will be sufficient to identify similar regions
Limitations Explanation
Slow algorithm A large input image and a smaller template
Lucky Kodwani 211EC4105 Page 44 calculations in the many nested summations a demanding task.
Not invariant to rotation and perspective distortion
If the region sought after is rotated or distorted in the input image, the region may very well bear little or no resemblance to the template on a pixel by pixel basis. This means the similarity measurement will fail. Not invariant to scaling Scaling of input images proves to be an
unsurpassable problem. It is an impossible task to examine the input image using all possible sizes for the template, and even the smallest variation in size will often lead to a wrong result.
Static threshold The images vary a great deal in overall brightness, depending on the surroundings. 3.2.3 Region Growing
The basic idea behind region growing is to identify one or more criteria that are characteristic for the desired region. Once the criteria have been established, the image is searched for any pixels that fulfil the needs. Whenever such a pixel is encountered, its neighbours are checked, and if any of the neighbours also match the criteria, both of the pixels are considered as belonging to the same region. Figure 3.6 visualizes these steps. The criteria can be static pixel values, or depend on the region that is being expanded.
Figure 3. 5: Largest contained Rectangle
Lucky Kodwani 211EC4105 Page 45 Figure 3. 6: Steps for Region Growing
Advantages Explanation
Fast algorithm. Each pixel is examined no more than once
for each neighbour. Invariant to distance between camera and
Vehicle
Candidates with the correct shape are extracted by this method and it does not depend on size of regions.
Limitations Explanation
High demands for memory The recursive nature of the algorithm stores temporary results for each call to the recursive function.
Static threshold The images vary excessively in overall brightness, depending on the surroundings.