RELATIONSHIPS BETWEEN IMAGE-BASED AND MECHANICAL BONE PROPERTIES WITH PAIN IN KNEE OSTEOARTHRITIS
A Thesis Submitted to the College of Graduate and Postdoctoral Studies In Partial Fulfillment of the Requirements
For the Degree of Doctor of Philosophy In the Division of Biomedical Engineering
University of Saskatchewan Saskatoon
By
WADENA DELSIE BURNETT
i
PERMISSION TO USE
In presenting this thesis in partial fulfillment of the requirements for a Postgraduate degree from the University of Saskatchewan, I agree that the Libraries of this University may make it freely available for inspection. I further agree that permission for copying of this thesis/dissertation in any manner, in whole or in part, for scholarly purposes may be granted by the professor or professors who supervised my thesis/dissertation work or, in their absence, by the Head of the Department or the Dean of the College in which my thesis work was done. It is understood that any copying or publication or use of this thesis/dissertation or parts thereof for financial gain shall not be allowed without my written permission. It is also understood that due recognition shall be given to me and to the University of Saskatchewan in any scholarly use which may be made of any material in my thesis.
Requests for permission to copy or to make other uses of materials in this thesis/dissertation in whole or part should be addressed to:
Head of the Division of Biomedical Engineering Room 2B60, 57 Campus Drive
University of Saskatchewan
Saskatoon, Saskatchewan S7N 5A9 Canada
OR
Dean
College of Graduate and Postdoctoral Studies University of Saskatchewan
116 Thorvaldson Building, 110 Science Place Saskatoon, Saskatchewan S7N 5C9
ii ABSTRACT
Pain is the predominant symptom of OA, a debilitating disease marked by changes in cartilage and subchondral bone, but pain pathophysiology is poorly understood. Bone is densely
innervated and may be linked to OA-related knee pain. Quantitative computed tomography (QCT) is an in vivo image-based technique with the potential to quantify bone mineral density (BMD) to explore the role of bone in OA-related pain. When coupled with subject-specific finite element (FE) modeling, it may be possible to clarify the mechanical role of bone in OA-related knee pain.
The objectives of this study were to assess if: 1) tibial subchondral BMD is associated with OA-related nocturnal knee pain using depth-specific QCT image processing, 2) tibial epiphyseal and metaphyseal BMD is associated with OA-related knee pain using a modified depth-specific CT image processing tool, 3) subchondral cyst characteristics are associated with OA-related knee pain, and 4) FE-derived mechanical outcomes at the proximal tibia are
associated with OA-related pain.
Lateral focal subchondral BMD was 33% higher in participants with severe nocturnal pain than participants with no nocturnal pain at the 2.5-5mm depth (p=0.028) and 32% higher at 5-10mm from the subchondral surface (p=0.049). At the epiphyseal and metaphyseal depths, higher total pain was associated with lower medial epiphyseal BMD (R2=-0.40, p=0.002), and lower metaphyseal BMD (R2=-0.35, p=0.017). At the lateral region, subchondral cyst number (r=0.55, p<0.001) and cyst number per proximal tibial volume (r=0.52, p<0.001) were both associated with BMD, and lateral cyst number and volume were associated with joint space narrowing (r=0.52 to 0.68, p<0.001) and alignment (r=0.44 to 0.62, p<0.001). In our FE study, principal compressive stress was associated with nocturnal pain at most lateral regions (r=0.33 to 0.50, p<0.05). Principal compressive stress at the lateral region ranged from 47% to 67% higher (p<0.05) in participants with severe nocturnal pain than participants with no pain.
This series of studies suggests that pain in patients with knee OA may be associated with BMD throughout various depths at the proximal tibia as well as FE-based bone mechanical outcomes, such as principal compressive stress. These findings suggest previously unexplored associations between OA-related knee pain and BMD or mechanical outcomes, emphasizing that bone may have a mechanical role in OA-related pain pathogenesis.
iii
ACKNOWLEDGEMENTS
Thank you to my supervisors, Dr. JD Johnston and Dr. Saija Kontulainen, for providing me with a supportive research environment and the opportunity to grow with such a motivated, team. Thank you for letting me explore as many opportunities as I could and for providing me with a place where I knew I was always welcome to return.
Thank you to my Advisory Committee: Dr. Allan Dolovich, Dr. David Hunter, Dr.
Stephan Milosavljevic, and Dr. David Wilson; and to my External Examiner: Dr. Gregory Wohl. Thank you to my co-authors: Christine McLennan, Diane Hazel, and Dr. Carl Talmo. Thank you to Hanieh Arjmand for your dedication to our finite element work. Your willingness to teach me how they all came together made all the difference.
Thank you to my research group. It’s been a pleasure to work with individuals with so many unique perspectives, in and out of research.
Thank you to my many research and teaching mentors: Dr. Emily McWalter, Dr. Steve Machtaler, Dr. David Cooper, Dr. Terry Fonstad, Dr. Brian Eames, Tracy Walker, Dr. Joyce McBeth, Dr. Joel Frey, Dr. Lisa Feldman, Dr. Joy Agnew, Dr. Jim Bugg, Dr. Sean Maw, Debbie Rolfes, Noreen Predicala, and Dr. Bruce Sparling.
Thanks to Liv Marken and the Writing Centre for providing me with opportunities leading to my growth as a writer.
Thanks to Victoria Martinez and the Outreach Team at CLS for sparking my love for science communication and knowledge translation.
Thanks to Meena, my sister-from-another-mister. We kept each other focused, and for that I am eternally grateful.
Thanks to Shaun, my Superman and my partner in conventions, concerts, and comics. Thanks to my family: Mom, Dad, Wyatt, Chelsey, but especially to Porter and Weston. You kept me grounded when things got rough, and you were always there for support.
I would like to acknowledge funding from the Canadian Arthritis Network, the Division of Biomedical Engineering, the College of Engineering, Natural Sciences and Engineering Research Council of Canada, that Canadian Institutes for Health Research, the College of Graduate Studies and Research, and the Canadian Federation of University Women—Saskatoon Branch.
iv PREFACE
Sections of this thesis have been submitted as multi-authored papers in refereed journals or as chapters of books. Trained technicians carried out computed tomography imaging, and
participating orthopaedic surgeons and clinicians performed clinical diagnoses. Dr. JD Johnston developed and modified depth-specific image processing technique, and Hanieh Arjmand and Dr. Majid Nazemi developed finite element modeling processes and material mapping programs, with input and guidance by myself. I performed data analysis and manuscript preparation, and co-authors contributed in statistical guidance and editing the manuscripts for submission to refereed journals and subsequent revisions.
Published Papers:
1. Burnett WD, Kontulainen SA, McLennan CE, Hazel D, Talmo C, Hunter DJ, Wilson DR, Johnston JD. Knee osteoarthritis patients with severe nocturnal pain have altered tibial subchondral bone mineral density. Osteoarthritis & Cartilage. 2015; 23(9): 1483-1490. Epub April 20, 2015.
Authors’ contribution: Dena Burnett carried out the image processing, contributed to statistical analysis and interpretation of data, and composed the draft manuscript. Dr. Saija Kontulainen contributed to statistical analysis and interpretation of data. Christine McLennan contributed to study design and acquisition of patient data. Diane Hazel contributed to coordination of the study and acquisition of patient data. Dr. Carl Talmo contributed to study design, participant recruitment and acquisition of patient data. Dr. David Hunter contributed to study design and coordination. Dr. David Wilson contributed to study design. Dr. JD Johnston conceived the study, assisted in image processing, and interpretation of data. This research is discussed in Chapter 4 of this thesis.
The results of this study were presented at local and international conferences:
i. American Society of Bone and Mineral Research Annual Meeting. Houston, TX, September 12-15, 2014. Poster No. MO0204
v
iii. University of Saskatchewan Life and Health Sciences Research Day.
Saskatoon, SK. March 14, 2014. Awarded First Place Poster – Imaging Group
2. Burnett WD, Kontulainen SA, McLennan CE, Hazel D, Talmo C, Wilson DR, Hunter DJ, Johnston JD. Proximal tibial trabecular bone mineral density is related to pain in patients with osteoarthritis. Arthritis Research & Therapy. 2017; 19(1): 200. Available September 12, 2017.
Authors’ contribution: Dena Burnett contributed in conceiving the study, carried out the image processing, contributed to statistical analysis and interpretation of data, and composed the draft manuscript. Dr. Saija Kontulainen contributed to statistical analysis and interpretation of data. Christine McLennan contributed to study design and
acquisition of patient data. Diane Hazel contributed to coordination of the study and acquisition of patient data. Dr. Carl Talmo contributed to study design, participant
recruitment and acquisition of patient data. Dr. David Wilson contributed to study design. Dr. David Hunter contributed to study design and coordination. Dr. JD Johnston
conceived the study, assisted in image processing, and interpretation of data. This research is discussed in Chapter 5 of this thesis.
The results of this study were presented at international conferences:
i. ISMRM Workshop on Imaging Based Measures of Osteoarthritis. Monterey, CA. September 12, 2015. Podium Presentation. Awarded Highest Ranked Trainee Abstract.
3. Johnston JD, Burnett WD, Kontulainen SA. Subchondral bone features and mechanical properties as biomarkers of osteoarthritis. In: VR Preedy (ed.) Biomarkers in Bone Disease. Biomarkers in Disease: Methods, Discoveries and Applications. Springer: Dordrecht. 2016. Epub July 19, 2016.
Authors’ contribution: Dr. JD Johnston drafted the manuscript. Dena Burnett performed literature review and assisted in drafting the manuscript. Dr. Saija Kontulainen assisted in
vi
literature review and drafting the manuscript. Portions of this literature review are discussed in Chapter 2 of this thesis.
Submitted Papers
1. Burnett WD, Kontulainen SA, McLennan CE, Hazel D, Talmo C, Wilson DR, Hunter DJ, Johnston JD. Knee osteoarthritis patients with more subchondral cysts have altered tibial subchondral bone mineral density. BMC Musculoskeletal Disorders. Submitted
December 1, 2017.
Authors’ contribution: Dena Burnett contributed in conceiving the study, carried out the image processing, contributed to statistical analysis and interpretation of data, and composed the draft manuscript. Dr. Saija Kontulainen contributed to statistical analysis and interpretation of data. Christine McLennan contributed to study design and
acquisition of patient data. Diane Hazel contributed to coordination of the study and acquisition of patient data. Dr. Carl Talmo contributed to study design, participant
recruitment and acquisition of patient data. Dr. David Wilson contributed to study design. Dr. David Hunter contributed to study design and coordination. Dr. JD Johnston assisted in study conception and image processing, and interpretation of data. This research is discussed in Chapter 6 of this thesis.
The results of this study were and will be presented at local and international conferences: i. Alberta Biomedical Conference. Banff, AB. November 10-12, 2017. Podium
Presentation.
ii. American Society of Bone and Mineral Research Annual Meeting. Montreal, QC September 28-30, 2018. Abstract submitted April 11, 2018.
2. Burnett WD, Arjmand HA, McLennan CE, Hazel D, Talmo C, Wilson DR, Hunter DJ, Kontulainen SA, Johnston JD. Mechanical stress and strain at the proximal tibia are related to pain in patients with knee osteoarthritis: A subject-specific finite element study. Plan to submit to Scientific Reports, August 2018.
vii
Authors’ contribution: Dena Burnett contributed in conceiving the study, carried out the finite element analysis, contributed to statistical analysis and interpretation of data, and composed the draft manuscript. Hanieh Arjmand developed finite element modeling techniques, contributed to interpretation of data, and assisted in composing the draft manuscript. Dena Burnett and Hanieh Arjmand share first-authorship of this paper. Christine McLennan contributed to study design and acquisition of patient data. Diane Hazel contributed to coordination of the study and acquisition of patient data. Dr. Carl Talmo contributed to study design, participant recruitment and acquisition of patient data. Dr. David Wilson contributed to study design. Dr. David Hunter contributed to study design and coordination. Dr. Saija Kontulainen contributed to statistical analysis and interpretation of data. Dr. JD Johnston assisted in study conception and finite element modeling techniques, and interpretation of data. This research is discussed in Chapter 7
of this thesis.
The results of this study were and will be presented at local and international conferences: i. Alberta Biomedical Conference. Banff, AB. October 21-23, 2016. Poster
Presentation.
ii. International Workshop on Osteoarthritis Imaging. Menton, France. July 5-8, 2018. Abstract to be submitted May 10, 2018.
3. Burnett WD, Kontulainen SA, Johnston JD. Image-based bone features and mechanical properties as biomarkers of osteoarthritis-related knee pain. Plan to submit to Journal of Musculoskeletal and Neuronal Interactions, August 2018.
Authors’ contribution: Dena Burnett contributed to literature review and composed the draft manuscript. Dr. Saija Kontulainen assisted in literature review and drafting the manuscript. Dr. JD Johnston assisted in literature review and drafting the manuscript. Portions of this literature review are discussed in Chapter 2 of this thesis.
viii TABLE OF CONTENTS page PERMISSION TO USE ... i ABSTRACT ... ii ACKNOWLEDGEMENTS ... iii PREFACE ... iv
TABLE OF CONTENTS ... viii
LIST OF TABLES ... xii
LIST OF FIGURES ... xvi
LIST OF ABBREVIATIONS AND SYMBOLS ... xx
GLOSSARY ... xxiii
1. INTRODUCTION ... 1
1.1. Overview ... 1
1.2. Scope ... 2
2. LITERATURE REVIEW ... 3
2.1. Functional Anatomy and the Knee Joint ... 3
2.2. Osteoarthritis ... 7
2.3. Clinical Classification and Diagnosis ... 9
2.3.1. Imaging OA ... 9
2.3.1.1. Radiography and Radiographic OA ... 9
2.3.1.2. Magnetic Resonance Imaging (MRI) ... 10
2.3.2 Symptomatic OA ... 11
2.4 OA-related Pain ... 12
2.5. Image-based relationships between bone and pain ... 15
2.5.1. Alignment ... 15
2.5.2. Osteophytes ... 16
2.5.3. Sclerosis ... 20
2.5.4. Attrition ... 22
ix
2.5.6. Bone Marrow Lesions ... 26
2.5.7. Bone Mineral Density ... 30
2.5.7.1. DXA and Areal Bone Mineral Density (aBMD) ... 30
2.5.7.2. Bone Mineral Density (BMD) ... 33
2.6. Finite Element Modeling ... 35
2.6.1. Overview ... 35
2.6.2. Subject-specific FE models ... 35
2.6.2. Subject-specific FE Analysis of OA Bone ... 36
2.6.3. Subject-Specific FE and pain ... 38
2.7. Summary ... 38
3. RESEARCH QUESTIONS AND OBJECTIVES ... 40
3.1. Research Questions ... 40
3.2. Research Objectives: ... 40
4. SUBCHONDRAL BMD AND NOCTURNAL PAIN ... 41
4.1. Synopsis ... 41 4.2. Introduction ... 41 4.3. Methods... 42 4.3.1. Study Participants ... 42 4.3.2. Patient Assessment ... 43 4.3.3. CT Acquisition ... 43 4.3.4. CT Image Analysis ... 43 4.3.5. Internal Control ... 45 4.3.6. Statistical Analysis ... 45 4.4. Results ... 45 4.5. Discussion ... 51 4.6. Conclusion ... 53
5. EPIPHYSEAL AND METAPHYSEAL BMD AND PAIN ... 55
5.1. Synopsis ... 55
5.2. Introduction ... 55
x 5.3.1. Study Participants ... 56 5.3.2. Participant Assessment ... 56 5.3.3. CT Acquisition ... 56 5.3.4. CT Image Analysis ... 57 5.3.5. Statistical Analysis ... 59 5.4. Results ... 60 5.5. Discussion ... 63 5.6. Conclusion ... 67
6. SUBCHONDRAL CYSTS AND PAIN ... 68
6.1. Synopsis ... 68 6.2. Introduction ... 68 6.3. Methods... 69 6.3.1. Study Participants ... 69 6.3.2. Participant Assessment ... 69 6.3.3. QCT Acquisition ... 70 6.3.4. CT Image Analysis ... 71
6.3.4.1. Isolate Subchondral Region ... 71
6.3.4.2. Cysts ... 71 6.3.4.3. BMD ... 72 6.3.5. Regional Analysis ... 72 6.3.6. Statistical Analysis ... 73 6.4. Results ... 74 6.5. Discussion ... 79 6.6. Conclusion ... 82
7. MECHANICAL FE OUTCOMES AND NOCTURNAL PAIN ... 83
7.1. Synopsis ... 83 7.2. Introduction ... 83 7.3. Methods... 84 7.3.1. Study Participants ... 84 7.3.2. Participant Assessment ... 84 7.3.3. CT Acquisition ... 85
xi 7.3.4. CT Image Analysis ... 86 7.3.5. FE Analysis ... 86 7.3.6. Statistical Analysis ... 90 7.4. Results ... 90 7.4.1. Participant Characteristics ... 90
7.4.2. Associations Between Mechanical Quantities and Clinical Characteristics ... 91
7.4.3. Differences Across Pain Groups ... 95
7.5. Discussion ... 103
7.6. Conclusion ... 108
8. DISCUSSION ... 109
8.1. Overview of Findings ... 109
8.2. Comparison to Existing Findings ... 110
8.3. Strengths and Limitations ... 112
8.4. Clinical Significance ... 114 8.5. Conclusions ... 115 8.6. Contributions ... 116 8.7. Future Research ... 117 REFERENCES ... 120 APPENDIX ... 145
xii
LIST OF TABLES
page
Table 2-1. Kellgren-Lawrence (KL) scoring system for radiographic OA severity59. ... 10
Table 2-2. Whole-Organ Magnetic Resonance Imaging Score (WORMS) for scoring OA
severity using MRI65. ... 11
Table 2-3. Western Ontario and McMaster Universities Osteoarthritis Index (WOMAC)
questionnaire subsections with corresponding question elements75. ... 12
Table 2-4. Western Ontario and McMaster Universities Osteoarthritis Index (WOMAC) 5-point Likert scale scoring values75. ... 12
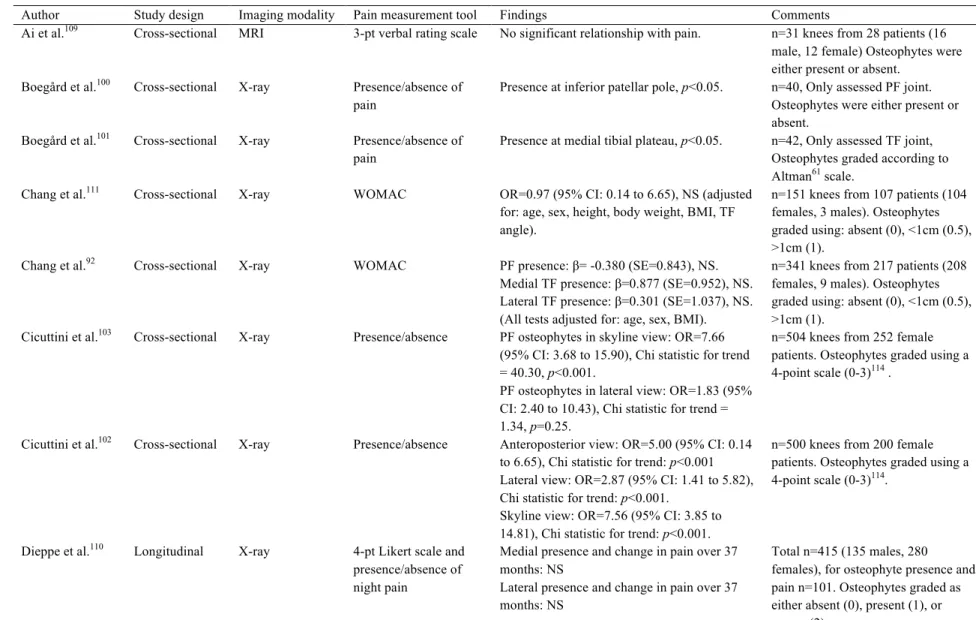
Table 2-5. Summary of image-based studies evaluating relationships between osteophytes and OA-related pain. ... 17
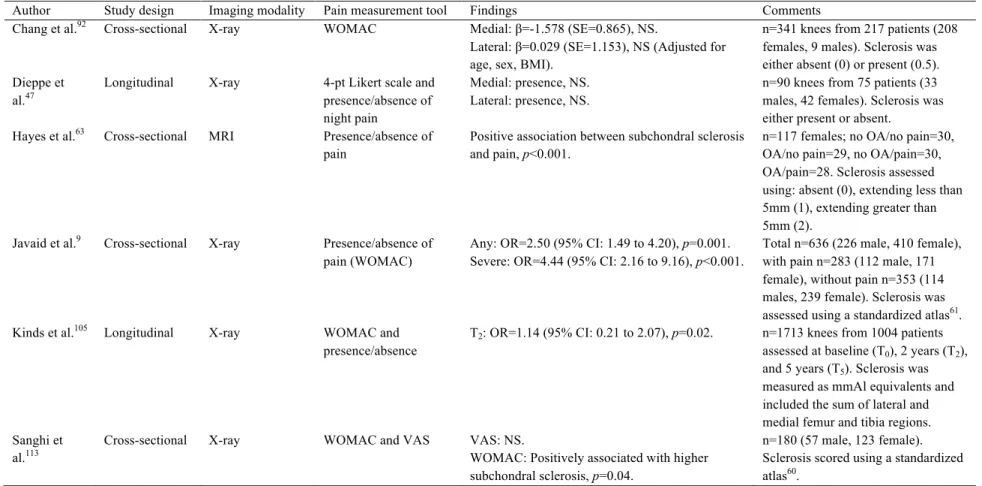
Table 2-6. Summary of image-based studies evaluating relationships between sclerosis and OA-related pain. ... 21
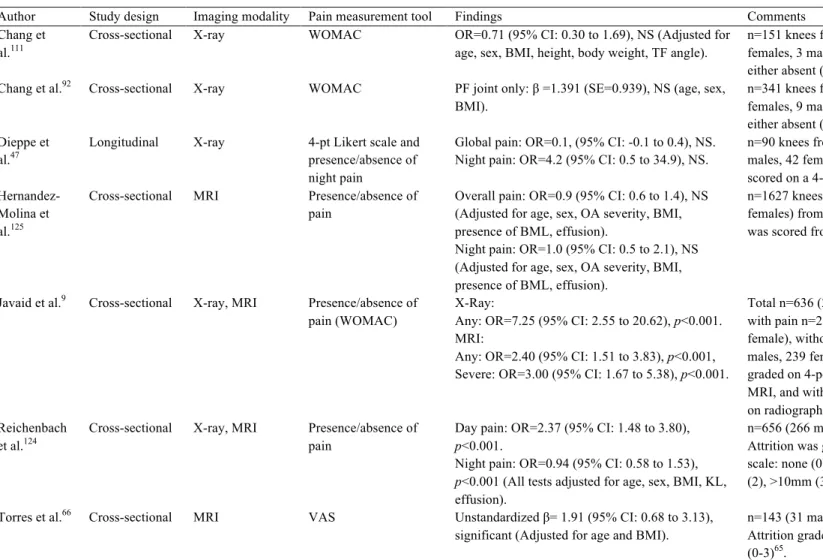
Table 2-7. Summary of image-based studies evaluating relationships between attrition and OA-related pain. ... 23
Table 2-8. Summary of image-based studies evaluating relationships between subchondral cysts and OA-related pain. ... 25
Table 2-9. Summary of image-based studies evaluating relationships between bone marrow lesions (BML) and OA-related pain. ... 27
Table 2-10. Summary of image-based studies evaluating relationships between bone mineral density (BMD) and OA-related pain. ... 32
Table 4-1. Background characteristics and clinical data for study participants and groups. ... 46
Table 4-2. Spearman rank correlation coefficients (ρ) for relationship between BMD
measurements and WOMAC pain score while lying down. Bolded values indicate p<0.05. ... 46
Table 4-3. Pair-wise comparison of tibial bone mineral density (BMD) measurements in patients with knee osteoarthritis with ‘no pain’ and ‘moderate pain’ while lying down, including mean ± standard deviation (SD), adjusted mean difference, percent difference from ‘no pain’, 95% confidence interval (CI), and p-value. ... 49
xiii
Table 4-4. Pair-wise comparison of tibial bone mineral density (BMD) measurements in patients with knee osteoarthritis with ‘no pain’ and ‘severe pain’ while lying down, including mean ± standard deviation (SD), adjusted mean difference, percent difference from ‘no pain’, 95% confidence interval (CI), and p-value. Bolded values indicate p<0.05. ... 50
Table 5-1. Descriptive statistics for background characteristics of study participants. ... 61
Table 5-2. Adjusted coefficients of determination (R2), standardized beta coefficients (β), and level of significance (p) of the base model (age, sex, and BMI) and change in base model R2 (Δ) when including bone mineral density (BMD) at the total and regional proximal tibia to predict variance in total WOMAC pain. Significant R2, Δ, and β are bolded. ... 62
Table 6-1. Descriptive statistics for characteristics of study participants ... 74
Table 6-2. Cyst parameters, mean ± SD (range). ... 75
Table 6-3. Correlation coefficients between cyst parameters and patient and clinical OA characteristics over the total proximal tibia. Pearson’s correlation coefficient was used for all continuous variables. Spearman’s correlation coefficient (italics) was used for all categorical variables where noted. Significant associations are marked. ... 77
Table 6-4. Correlation coefficients between cyst parameters and patient and clinical OA
characteristics at the medial region. Pearson’s correlation coefficient was used for all continuous variables. Spearman’s correlation coefficient (italics) was used for all categorical variables. Significant associations are marked. ... 77
Table 6-5. Correlation coefficients between cyst parameters and patient and clinical OA
characteristics at the lateral region. Pearson’s correlation coefficient was used for all continuous variables. Spearman’s correlation coefficient (italics) was used for all categorical variables. Significant associations are marked. ... 78
Table 7-1. Background characteristics and clinical data for study participants and groups. ... 91
Table 7-2. Spearman’s rank correlation coefficients (ρ) for relationships between regional principal compressive stress and OA characteristics (OA severity, total WOMAC pain, nocturnal pain, and alignment). For alignment, positive relationships represent associations with valgus alignment, and negative relationships represent associations with varus alignment. Bolded values indicate p< 0.05. ... 92
xiv
Table 7-3. Spearman’s rank correlation coefficients (ρ) for relationships between regional principal compressive strain and OA characteristics (OA severity, total WOMAC pain, nocturnal pain, and alignment). For alignment, positive relationships represent associations with valgus alignment, and negative relationships represent associations with varus alignment. Bolded values indicate p< 0.05. ... 93
Table 7-4. Spearman’s rank correlation coefficients (ρ) for relationships between medial and lateral stiffness and OA characteristics (OA severity, total WOMAC pain, nocturnal pain, and alignment). For alignment, positive relationships represent associations with valgus alignment, and negative relationships represent associations with varus alignment. Bolded values indicate p< 0.05. ... 94
Table 7-5. Comparison of regional principal compressive stress in patients with knee OA with no pain and moderate pain, including mean ± standard deviation (SD), adjusted mean difference, percent difference from no pain, 95% confidence intervals (CI), and p-values. Bolded values indicate p<0.05. ... 98
Table 7-6. Comparison of regional principal compressive stress in patients with knee OA with no pain and severe pain, including mean ± standard deviation (SD), adjusted mean difference, percent difference from no pain, 95% confidence intervals (CI), and p-values. Bolded values indicate p<0.05. ... 99
Table 7-7. Comparison of regional principal compressive strain in patients with knee OA with no pain and moderate pain, including mean ± standard deviation (SD), adjusted mean difference, percent difference from no pain, 95% confidence intervals (CI), and p-values. ... 100
Table 7-8. Comparison of regional principal compressive strain in patients with knee OA with no pain and severe pain, including mean ± standard deviation (SD), adjusted mean difference, percent difference from no pain, 95% confidence intervals (CI), and p-values. Bolded values indicate p<0.05. ... 101
Table 7-9. Comparison of stiffness outcomes in patients with knee OA with no pain and moderate pain as well as severe pain including mean ± standard deviation (SD), adjusted mean difference, percent difference from no pain, 95% confidence intervals (CI), and p-values. ... 102
xv
Table A-2. Spearman’s rank correlation coefficients (ρ) for relationships between regional von Mises stress and OA characteristics (OA severity, total WOMAC pain, nocturnal pain, and alignment). For alignment, positive relationships represent associations with valgus alignment, and negative relationships represent associations with varus alignment. Bolded values indicate p< 0.05. ... 146
Table A-3. Spearman’s rank correlation coefficients (ρ) for relationships between regional von Mises strain and OA characteristics (OA severity, total WOMAC pain, nocturnal pain, and alignment). For alignment, positive relationships represent associations with valgus alignment, and negative relationships represent associations with varus alignment. Bolded values indicate p< 0.05. ... 147
Table A-4. Comparison of regional von Mises stress in patients with knee OA with no pain and moderate pain, including mean ± standard deviation (SD), adjusted mean difference, percent difference from no pain, 95% confidence intervals (CI), and p-values. Bolded values indicate p<0.05. ... 148
Table A-5. Comparison of regional von Mises stress in patients with knee OA with no pain and severe pain, including mean ± standard deviation (SD), adjusted mean difference, percent difference from ‘no pain’, 95% confidence intervals (CI), and p-values. Bolded values indicate p<0.05. ... 149
Table A-6. Comparison of regional von Mises strain in patients with knee OA with no pain and moderate pain, including mean ± standard deviation (SD), adjusted mean difference, percent difference from no pain, 95% confidence intervals (CI), and p-values. Bolded values indicate p<0.05. ... 150
Table A-7. Comparison of regional von Mises strain in patients with knee OA with no pain and severe pain, including mean ± standard deviation (SD), adjusted mean difference, percent difference from no pain, 95% confidence intervals (CI), and p-values. Bolded values indicate p<0.05. ... 151
xvi
LIST OF FIGURES
page
Figure 2-1 Anterior views of the bone of the knee joint, including the patella (A) and with the patella removed (B). Bones include the distal femur, proximal tibia, and proximal fibula.
Modified from Grey’s Anatomy34. ... 3
Figure 2-2. Anatomical features of the proximal tibia include the medial and lateral plateaus as well as the intercondylar tubercles (or tibial spine). Adapted from teachmeanatomy.com. ... 4
Figure 2-3. Axial view of the articulating surface of the proximal tibia, including medial and lateral menisci overlying articular cartilage. Modified from Grey’s Anatomy34 ... 4
Figure 2-4. Representative diagram of the tissue layers of cartilage and subchondral bone regions, including articular cartilage, tidemark, calcified cartilage, subchondral cortical bone, subchondral trabecular bone, and epiphyseal trabecular bone. Adapted from Madry et al.
(2010)40. ... 6
Figure 2-5. Computed tomography (CT) image in the sagittal plane of the proximal tibia including subchondral cortical bone, subchondral trabecular bone, epiphyseal line (epiphyseal scar)41, epiphyseal trabecular bone, and metaphyseal trabecular bone. ... 6
Figure 2-6. Characteristics of OA include cartilage wear, joint space narrowing, osteophytes, and sclerosis. Adapted from Felson 20061. ... 8
Figure 2-7. Schematic diagram of a hypothetical process of pain pathogenesis and joint remodelling, emphasizing that subchondral bone remodelling could be the primary source of OA-related pain. In this model, the joint attempts to regulate abnormal biomechanics through joint remodelling and subchondral bone changes. If abnormal biomechanics are successfully controlled, the joint self-stabilizes; if abnormal biomechanics are not successfully controlled, then the joint continues to proceed through bone remodelling, in an attempt to alter joint shape. Joint repair depends largely on the response and remodelling of subchondral bone; with
increased bone turnover potentially increasing joint pain. Adapted from Dieppe 199945. ... 14
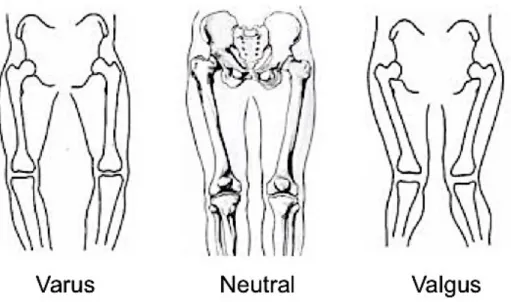
Figure 2-8. Tibial position in varus (left), neutral (middle), and valgus (right) alignment.
xvii
Figure 2-9. Sample CT images of knees with no osteophytes (left) and severe medial and lateral osteophytes on both the femur and tibia (right). ... 16
Figure 2-10. Sample radiographs of knees with no sclerosis (left) and severe medial tibial sclerosis (right). Adapted from Altman 200760. ... 20
Figure 2-11. Sample radiographs of knees with no attrition (left) and severe attrition at the medial tibial plateau (right). Adapted from Altman et al.61 ... 22
Figure 2-12. Sample CT images in coronal (left) and sagittal (right) views of OA patient with mild subchondral cysts (top row) and severe subchondral cysts (bottom row). ... 24
Figure 2-13. Sample MR image of OA patients with grade 1 BML (A) and grade 3 BML (B). Adapted from Seah 2012140 ... 26
Figure 2-14. Representative ROI used in studies evaluating proximal tibial aBMD159. ... 31
Figure 2-15. Tibial subchondral BMD measurements of patients with OA (top row) and healthy participants (bottom row) at three depths from the subchondral surface (0-2.5mm, 2.5mm, 5-10mm) using depth specific QCT imaging techniques.22 ... 34
Figure 2-16. Patellar subchondral BMD measurements of OA patients with low pain at rest (top row) and high pain at rest (bottom row) at three depths from the subchondral surface (0-2.5mm, 2.5-5mm, 5-7.5mm) using depth-specific QCT imaging techniques. 19. ... 34
Figure 2-17. Comparison of von Mises stress distribution at the proximal tibia in participants with early OA with (right) and without (left) simulated subchondral cysts131. ... 37
Figure 2-18. Representative von Mises stress distributions between OA and healthy participants at the proximal tibia. Yellow indicates high stress, while black indicates low stress30, 31. ... 38
Figure 4-1. Representative topographical maps of tibial BMD at depths of 0-2.5mm (top row) and 2.5-5mm (bottom row) in one participant reporting ‘no pain’, ‘moderate pain’, and ‘severe pain’ while lying down. Regional analysis includes average BMD of the lateral and medial plateaus, and average maximum BMD of a 10mm diameter focal spot (shown in upper left-hand image) localized on the maximum value of each lateral and medial plateau. ... 47
Figure 4-2. Adjusted mean regional BMD of each group (‘no pain’, ‘moderate pain’, and ‘severe pain’) at depths of 0-2.5mm, 2.5-5mm, and 5-10mm from the subchondral surface. Statistically
xviii
significant differences (p<0.05) between groups are noted with brackets. Error bars represent 95% confidence intervals. ... 48
Figure 5-1. Methodological process consists of converting CT grayscale intensities to BMD using a QCT reference phantom (A), followed by building two imaged volumes for each tibia, one with manual correction at the epiphyseal line and one using the full tibia (B). Imaged
volumes were divided into lateral and medial regions (C), then the outer 2.5mm and subchondral 7.5mm depth were removed from each imaged volume (D). BMD measurements included epiphyseal BMD between the epiphyseal line and 7.5mm from the subchondral surface and metaphyseal BMD 10mm distal from the epiphyseal line (E). ... 59
Figure 5-2. Scatter plots and coefficients of determination (R2) of the relationships between total WOMAC score and A) total epiphyseal BMD (p=0.040), B) lateral epiphyseal BMD(p=0.187), C) medial epiphyseal BMD (p=0.015), and D) total metaphyseal BMD (p<0.009). The single outlier is noted as a circle, and was not included in the bivariate analysis. ... 61
Figure 6-1. Process for identifying, isolating, and measuring cysts included isolating the
subchondral region of 7.5mm from the subchondral surface (A), cyst identification on CT images (B), and segmenting individual cysts using semi-automatic region growing for larger cysts manual segmentation for smaller cysts (C). Segmented image volumes were then used to measure cyst parameters, and regional BMD excluding cysts which included total, lateral, and medial regions (D). ... 73
Figure 6-2. Scatterplot and Pearson’s correlation coefficient (r) of the relationship between lateral BMD and lateral cyst number (Cyst.N), suggesting that more numerous cysts in the lateral region contributed to higher lateral BMD surrounding cysts. ... 76
Figure 7-1. Process for developing subject-specific FE models. Grayscale Hounsfield units from CT images were converted to bone mineral density (BMD) values (A), serial images (B) were segmented (C) – coronal view of femur in blue and tibia in green – to create imaged volumes for each included bone. Imaged volumes were rendered and smoothed to create three-dimensional geometries (D), which were meshed with 10-node tetrahedral elements (E). All meshed models included the femur, tibia, and fibula (not pictured) within a cylinder representing surrounding soft tissue. BMD-based material properties were assigned and mapped to each model (F). To
xix
calculate lateral stiffness, the medial side was isolated from the model by assigning soft tissue material properties to the medial distal femur (G). ... 87
Figure 7-2. Analysis at the proximal tibia included cortical and trabecular bone at subchondral, epiphyseal, and metaphyseal depths in medial, central, and lateral regions. ... 89
Figure 7-3. Representative finite element model outputs for principal compressive stress (top row) and principal compressive strain (bottom row) in one participant from each group. ... 96
Figure 7-4. Adjusted mean principal compressive stress of each group (‘no nocturnal pain’, ‘moderate nocturnal pain’, and ‘severe nocturnal pain’) at subchondral, epiphyseal, and
metaphyseal depths of the lateral region of the proximal tibia. Statistically significant differences (p<0.05) across groups are noted with brackets. Error bars represent 95% confidence intervals. 97
xx
LIST OF ABBREVIATIONS AND SYMBOLS
Abbreviation Definition
2D Two-dimensional
3D Three-dimensional
aBMD Areal bone mineral density (mg/cm2) Avg. Cyst.V Average cyst volume
BMD Bone mineral density(mg/cm3)
BMI Body mass index
BML Bone marrow lesion
BV/TV Bone volume fraction
CI Confidence interval
CT-TOMASD Computed tomography topographical mapping of subchondral density
Cyst.N Cyst number
Cyst.N/TV Cyst number per total volume Cyst.V/TV Cyst volume per total volume
CV%RMS Root mean square coefficient of variations
DOF Degrees of freedom
DXA Dual energy x-ray absorptiometry, also DEXA E-BMD Density-modulus equations
FE Finite element
FSA Fractal signature analysis
HMH Half maximum height
HR-pQCT High-resolution peripheral quantitative computed tomography
HU Hounsfield units
ICC Intra-class correlation coefficient
JSN Joint space narrowing
K2HPO4 Dipotassium phosphate
KL Kellgren-Lawrence
KOOS Knee Osteoarthritis Outcome Scale M:L Medial to lateral ratio
xxi
MANCOVA Multivariate analysis of covariance Max.Cyst.V Maximum cyst volume
micro-CT Micro-computed tomography Min.Cyst.V Minimum cyst volume
MR Magnetic resonance
MRI Magnetic resonance imaging
NS Not significant
OA Osteoarthritis
OARSI Atlas Osteoarthritis Research Society International Radiographic Atlas
OR Odds ratio
PF Patellofemoral
pQCT Peripheral quantitative computed tomography QCT Quantitative computed tomography
ROI Region of interest
SD Standard deviation
SD.Cyst.V Cyst volume standard deviation
SE Standard Error
TF Tibiofemoral
Tot.Cyst.V Total cyst volume
TKR Total knee replacement
VAS Visual analog scale
vBMD Volumetric bone mineral density, same as BMD VIF Variance inflation factor
WOMAC Western Ontario and McMaster Universities Osteoarthritis Index WORMS Whole-Organ Magnetic Resonance Imaging Score
xxii
Symbol Definition
p P-value, level of significance r Pearson’s correlation coefficient
β Beta coefficient, or regression coefficient
τ Thompson tao
ρ Spearman’s rank coefficient
ρapp Apparent density
ρash Ash density
ρreal Real density
R2 Coefficient of determination
d Depth
dss Subject-specific depth
Δ Change in, e.g., ΔR2 is a change in coefficient of determination
xxiii GLOSSARY
TERM DEFINITION
Areal bone mineral density Bone mineral mass per unit area (aBMD)
Anisotropic Material with different physical properties (e.g., material stiffness) in different directions.
Anterior Front plane of a body; referring to surface facing forward. Attrition Flattening of cortical bone near articular surface of a joint. Axial Oriented along the long axis of the body.
Bone mineral density Bone mineral mass per unit volume (BMD)
Bone marrow lesion Region of increased signal in bone marrow on fat-suppressed T2-weighted MIR images.
Coronal Plane that divides the body into anterior and posterior sections.
Cortical bone Bone tissue referring to bone of the cortex or outer shell of bone.
Distal Pertaining to the end of an extremity situated furthest from the center of a body (e.g., the distal femur is located at the tibiofemoral joint).
Epiphyseal Pertaining to the epiphysis
Epiphysis Region of bone between subchondral bone and epiphyseal plate (or line).
Ex vivo Experiment done on a tissue out of its natural environment. In vitro Experiment taking place outside a living organism.
In vivo Latin term for “within the living”; experiment using an entire living organism.
Inferior Bottom plane of a body; referring to the bottom surface of region.
xxiv
Isotropic Object with equal dimensions in all directions (e.g., isotropic voxel); a material with similar physical properties (e.g., material stiffness) in all directions.
Joint space narrowing Reported change in joint space width on radiographs. Lateral Located at or extending to the side.
Medial Located at or extending to the center. Metaphyseal Pertaining to the metaphysis.
Metaphysis Narrow region of bone between the epiphysis and the diaphysis (shaft).
Osteophyte Bony projection that forms along the periphery of joints. Patellofemoral joint Joint comprised of articulating surfaces of the patella and the
femur.
Peripheral Located at the edge of a surface.
Pixel A picture element; two-dimensional unit of a digital image. Posterior Back plane of a body; referring to a surface facing rearward. Proximal Pertaining to the end of an extremity situated nearest to the
center of a body (e.g., the proximal tibia is located at the tibiofemoral joint).
Sagittal Plane that divides a body into left and right portions. Sclerosis Region of increased bone mineral density as apparent on
radiographs; stiffening of hardening of a structure. Structural stiffness Describes bone’s response to deflection; dependent upon
both material stiffness properties and displacement.
Subchondral bone Bone region below cartilage; pertaining to the region of bone immediately adjacent to articular cartilage.
Subchondral cyst Spherical of ellipsoidal cavities within the subchondral bone region.
xxv
Tibiofemoral joint Joint comprised of articulating surfaces of the tibia and the femur.
Trabecular bone Bone tissue referring to bone with vertical or horizontal trabeculae, creating a spongy, cellular-like tissue; less dense than cortical bone.
Transverse Plane that divides the body into superior and inferior sections; also referred to as the axial plane.
Valgus Outward angulation of the distal segment of a bone or joint; synonymous with “knock-kneed”; opposite of varus. Varus Inward angulation of the distal segment of a bone or joint;
synonymous with “bow-legged”; opposite of valgus.
Voxel A volume element; three-dimensional unit corresponding to a pixel for a given slice thickness in CT images.
1
1. INTRODUCTION
1.1. Overview
Osteoarthritis (OA) is a painful debilitating disease characterized by cartilage degeneration and changes to the underlying subchondral bone1, 2. OA affects approximately 37% of Canadians aged 20 or older; of these, 29% experience knee pain3, which can lead to diminished quality of life4, 5. Pain is the dominant symptom of OA, which often initiates clinical intervention, and pain reduction as the primary focus of most treatment strategies1. Unfortunately, the source of OA-related knee pain is poorly understood.
Knee OA is commonly characterized by cartilage degeneration and subchondral bone changes including osteophytes, sclerosis, attrition, subchondral cysts, bone marrow lesions (BML), altered bone mineral density (BMD), and altered morphology or mechanical properties. Cartilage is aneural and insensate6, but subchondral bone is densely innervated7, 8 and a plausible site for OA-related pain initiation. Bone can also be viewed and assessed using various clinical imaging techniques, such as X-rays, quantitative computed tomography (QCT), magnetic resonance imaging (MRI), and dual-x-ray absorptiometry (DXA), each permitting in vivo evaluation of the associations between these bony features and OA-related pain.
Multiple studies have investigated the relationship between image-based bone features and OA-related pain. Although there are many reported associations between bony features and OA-related knee pain9-12, there are few consistent relationships between pain severity and bony feature severity. Alterations in BMD and the relationships between BMD and pain may be promising metrics to evaluate as it is associated with many other bony features, such as sclerosis13, BMLs14, 15, attrition16, and subchondral cysts17, 18, and can be evaluated using multiple imaging modalities.
Recent work using QCT-based depth-specific image processing at the patella19, 20 has reported that OA patients with more severe pain at rest have lower BMD in trabecular regions of the patella. As tibial BMD is associated with OA severity21-23, similar associations may present in subchondral cortical or trabecular bone at the tibia. Additionally, as commonly overlooked epiphyseal and metaphyseal trabecular bone is associated with OA severity24, BMD at these regions may also have a role in OA-related pain pathogenesis. These alterations in subchondral14, 22 and trabecular23 bone during OA, may also alter the mechanical environment of the proximal
2
tibia. This could have an effect various structural elements, such as mechanical properties25, loading patterns26-28, or localized bone remodeling29, each potentially relating to pain.
Subject-specific finite element (FE) modeling is a promising non-invasive image-based tool that can be used to investigate the structural role of bone in OA. Recent work in developing subject-specific FE models of the proximal tibia has shown differences in stress distributions through the proximal tibia of healthy participants and participants with OA30, 31. These same techniques could also be used to evaluate the relationship between mechanical outcomes and pain in OA patients. This work would aid in determining the mechanical role of bone in OA-related pain.
The overall aim of this dissertation research was to explore relationships between knee pain in patients with OA with QCT-based BMD at various depths of the proximal tibia
(subchondral BMD, epiphyseal BMD, metaphyseal BMD, cysts) as well as FE-based mechanical outcomes (stress, strain, stiffness). Findings from this in vivo research will help to determine how mechanics environment may influence pain in OA, and may provide insight into OA-related pain pathogenesis.
1.2. Scope
Chapter 2 provides a review of current literature evaluating relationships between image-based bony features and OA-related knee pain, the relationship between BMD and mechanical
environment of the proximal tibia, and the rationale behind this research. Chapter 3 includes my research questions, and objectives. Chapter 4 presents our study evaluating tibial subchondral BMD in patients with and without nocturnal knee pain. Chapter 5 describes our study exploring associations between proximal tibial epiphyseal and metaphyseal BMD and WOMAC pain. Chapter 6 describes our study exploring associations between proximal tibial cyst parameters (number, size, etc.) and characteristics of OA, including pain, as well as regional BMD. Chapter 7 presents our study using FE techniques to determine differences in mechanical outcomes (stress, strain, stiffness) between OA patients with and without nocturnal pain. Chapter 8 presents the overall contribution of this research, strengths, limitations, study conclusions, and recommendations for future research.
3
2. LITERATURE REVIEW
2.1. Functional Anatomy and the Knee Joint
The human knee is a complex joint composed of three bones: the proximal tibia, the distal femur, and the patella, and two distinct articulating joints: the patellofemoral (PF) joint and the
tibiofemoral (TF) joint (Figure 2-1). The TF joint, which can be divided into medial and lateral plateaus (Figure 2-2), provides flexing and extending motion of the leg, and is also the main load-bearing joint within the knee. Load-bearing tissues at the knee joint include meniscus, cartilage, and bone. The knee is a commonly affected site for osteoarthritis (OA) with
approximately 40-85% of cases occurring at the TF joint32, 33, with ~50% of cases occurring at the medial compartment 33.
Figure 2-1 Anterior views of the bone of the knee joint, including the patella (A) and with the patella removed (B). Bones include the distal femur, proximal tibia, and proximal fibula. Modified from Grey’s
4
Figure 2-2. Anatomical features of the proximal tibia include the medial and lateral plateaus as well as the intercondylar tubercles (or tibial spine). Adapted from teachmeanatomy.com.
The meniscus is composed of two fibrous, C-shaped fibrocartilage wedges located between the articulating surfaces of the distal femur and proximal tibia (Figure 2-3). These structures are semi-rigidly attached to the medial and lateral proximal tibial surface and function to transfer and distribute load through the underlying articular cartilage during movement and loading35, 36. Approximately 50% of the load on the proximal tibia is distributed through the meniscus to articular cartilage37, 38.
Figure 2-3. Axial view of the articulating surface of the proximal tibia, including medial and lateral menisci overlying articular cartilage. Modified from Grey’s Anatomy34
5
The joint surfaces of the proximal tibia, distal femur, and patella are covered with articular cartilage: a viscoelastic, fibre-reinforced material serving as a low-friction surface bearing material able to transmit loads to the underlying subchondral bone. Cartilage is
avascular8 and aneural7, 39, with consequently low levels of regeneration after damage or trauma. Immediately adjacent to the articular cartilage at the proximal tibia, are various layers of bony tissues including40:
• the tidemark, a thin outer border of the articulating bone surface and the boundary between articular and calcified cartilage (Figure 2-4);
• calcified cartilage, a partially mineralized cartilage layer interconnected with subchondral bone (Figure 2-4);
• subchondral cortical bone (or subchondral plate or endplate), a thin layer of compact highly mineralized layer of bone (Figure 2-4, Figure 2-5);
• subchondral trabecular bone, a layer of cancellous (or trabecular) bone immediately adjacent to the subchondral cortical bone which supports the overlying cortical shell (Figure 2-4, Figure 2-5);
• epiphyseal trabecular bone, a layer of trabecular bone between the subchondral trabecular bone and the epiphyseal scar which forms the proximal tibial epiphysis (Figure 2-4, Figure 2-5);
• epiphyseal scar (or epiphyseal line), a faint to distinct line distinguishing the epiphyseal and metaphyseal regions of the proximal tibia as a remnant of the epiphyseal or
childhood growth plate41 (Figure 2-5); and
• metaphyseal trabecular bone, trabecular bone forming the proximal tibial metaphysis (Figure 2-5).
6
Figure 2-4. Representative diagram of the tissue layers of cartilage and subchondral bone regions, including articular cartilage, tidemark, calcified cartilage, subchondral cortical bone, subchondral
trabecular bone, and epiphyseal trabecular bone. Adapted from Madry et al. (2010)40.
Figure 2-5. Computed tomography (CT) image in the sagittal plane of the proximal tibia including subchondral cortical bone, subchondral trabecular bone, epiphyseal line (epiphyseal scar)41, epiphyseal
7
“Subchondral bone” is a term used to describe the bony structure immediately adjacent to the articular cartilage, including both cortical and trabecular bone. This structure functions as the knee joint’s primary supportive and energy-transferring structure42. Subchondral bone and cartilage both have a role in the development and pathogenesis of OA42-45, but the distinct role and mechanical changes at various stages of disease severity still remains unknown.
Additionally, bone at the epiphyseal and metaphyseal depths may be involved in OA development and progression24, but their role or contribution are still unknown.
2.2. Osteoarthritis
Osteoarthritis (OA) is a degenerative joint disease affecting approximately 37% of Canadians over 20 years of age3 and 85% of Canadians over 75 years of age46. OA is characterized by various clinical symptoms, such as joint pain, swelling, stiffness, and loss of function45, 47-49, and morphological or physiological joint changes, such as cartilage degeneration, subchondral bone sclerosis, osteophyte presence, and changes in bone mineral density (BMD)2, 47-50 (Figure 2-6). Pain is the dominant symptom of OA51, but the source of OA-related pain is poorly understood. Unfortunately, OA is not typically detected or diagnosed until the patient begins to feel pain or joint discomfort, often after significant joint tissue damage.
OA is a complex disease involving many known and potential risk factors. Known risk factors can be systemic or biomechanical, and include: age, sex, hormonal status, bone metabolic biomarkers, joint mechanical environment, obesity, joint injury, and joint alignment48. As there is no known single risk factor, current disease management strategies focus on pain management, where treatments range along a spectrum from non-invasive pharmaceutical or physical
interventions to invasive surgical joint replacements. It is very likely that OA onset and progression is a result of a combination of risk factors, therefore treatment strategies typically incorporate a variety of methods1.
8
Figure 2-6. Characteristics of OA include cartilage wear, joint space narrowing, osteophytes, and sclerosis. Adapted from Felson 20061.
Disease characteristics include clinical symptoms, morphological changes, and
biomechanical alterations to the joint environment. Symptoms can include a combination of pain, joint dysfunction, limited or reduced motion, swelling, or stiffness1, 2. Morphological changes to the joint environment may include articular cartilage loss, synovial inflammation, or subchondral bone alterations including sclerosis, osteophytes, attrition, cysts, or bone marrow lesions
(BMLs)10, 52-54. Biomechanical changes include alterations in cartilage mechanical properties (lower compressive stiffness, lower shear stiffness, lower tensile stiffness)55 and altered mechanical stiffness in subchondral bone56 which could be the result of altered loading patterns57, 58.
9 2.3. Clinical Classification and Diagnosis
OA is clinically assessed using semi-quantitative scales either focusing on radiographic (or structural) progression or symptomatic progression. Radiographic OA is commonly assessed using radiographic atlases, such as the Kellgren-Lawrence (KL) scale59 or Osteoarthritis
Research Society International Radiographic Atlas (OARSI Atlas)60, 61, to evaluate and quantify evidence of visual radiographic changes, such as osteophyte presence, joint space narrowing, or sclerosis, within the knee joint. Symptoms of OA (e.g., pain, joint stiffness, inflammation, or loss of function) may or may not be present in all cases of radiographic OA62. For example, in a study of 6880 individuals, 14.6% reported knee pain but only 3.7% exhibited evidence of radiographic OA62. Of the individuals with radiographic OA, only 47% reported any symptoms; however, in those who reported symptoms, only 15% had radiographic evidence of OA. Severe radiographic OA may exist without pain or symptoms, and patients may experience painful symptoms of OA without radiographic evidence of severe OA33, 62, 63. The relationship between radiographic evidence of OA and related symptoms is unclear.
2.3.1. Imaging OA
Clinical imaging techniques currently used to assess OA and morphological OA-related characteristics include radiography or x-rays, dual-energy x-ray absorptiometry (DXA), magnetic resonance imaging (MRI), and computed tomography (CT).
2.3.1.1. Radiography and Radiographic OA
Radiographs are the most common and most accessible imaging tool to diagnose and measure OA severity. The most commonly used clinical radiographic OA scoring system is the KL scale59 (Table 2-1). The KL system uses radiographic images to grade radiographic OA severity according to qualitative, subjective assessments of sclerosis, osteophyte presence and size, and joint space narrowing (JSN). A KL score of 0 indicates no OA, a score of 1-2 indicates mild OA, whereas a score of 3-4 indicates moderate to severe OA. A similar scoring tool is the OARSI Atlas60, 61. In addition to the overall joint score, the OARSI system can be used for scoring specific qualities, such as only osteophyte size or JSN, providing additional freedom to evaluate and isolate certain radiographic qualities associated with OA. Radiographic scoring techniques could also be applied to sequential or reformatted CT images64
10
Table 2-1. Kellgren-Lawrence (KL) scoring system for radiographic OA severity59. Grade Qualifier Radiographical features
0 None Normal, no osteophytes, no evidence of OA 1 Doubtful Possible osteophytic lipping
2 Minimal Definite osteophytes, possible joint space narrowing, multiple of moderate osteophyte, definite joint space narrowing
3 Moderate Evidence of sclerosis, possible deformity of bone ends, possible bony attrition
4 Severe Large osteophytes, marked joint space narrowing, severe sclerosis, definite deformity of bone ends, definite bony attrition
2.3.1.2. Magnetic Resonance Imaging (MRI)
MRI offers non-ionizing three-dimensional (3D) imaging and also has the capability to observe changes in bone and surrounding soft tissues, thus providing an alternative to radiography to quantify OA severity. MRI is becoming more available, and can be used to evaluate joints with OA with severity scoring techniques, such as the Whole-Organ Magnetic Resonance Imaging Score (WORMS)65. This system evaluates 14 characteristics related to both bony and soft tissues: cartilage signal and morphology, subarticular bone marrow abnormalities, subarticular cysts, subarticular bone attrition, marginal osteophytes, medial and lateral meniscal integrity, anterior and posterior cruciate ligament integrity, medial and lateral collateral ligament integrity, synovitis, loose bodies, and periarticular cysts/bursae65. In addition to multiple tissue evaluation, the WORMS system also accommodates for regional analysis, dividing the knee joint into medial, lateral, posterior, central, and anterior regions. Each element is scored on individual scales, where bony feature scoring uses scales of 0 to 3 (subarticular bone marrow abnormalities, subarticular cysts, subarticular bone attrition) or 0 to 7 points (marginal osteophytes) (Table 2-2). Although the radiographic methods are the current “gold standard”, the WORMS scale is widely used in MRI-based studies in patients with OA9, 66-68.
11
Table 2-2. Whole-Organ Magnetic Resonance Imaging Score (WORMS) for scoring OA severity using MRI65.
Articular feature Severity scoring scale Subarticular bone
marrow abnormalities
0 = none, 1 = <25% of region, 2 = 25% to 50% of region, 3 = >50% of region
Subarticular cysts 0 = none, 1 = <25% of region, 2 = 25% to 50% of region, 3 = >50% of region Subarticular bone
attrition 0 = normal, 1 = mild, 2 = moderate, 3 = severe Marginal
osteophytes
0 = none, 1 = equivocal, 2 = small, 3 = small-moderate, 4 = moderate, 5 = moderate-large, 6 = large, 7 = very large
2.3.2 Symptomatic OA
Common symptoms of OA can include a combination of pain, stiffness, joint dysfunction, limited or reduced motion, or swelling. Pain is the dominant symptom of OA, with pain reduction as the primary focus of most treatment strategies1. Unfortunately, pain may not be apparent in early stages of OA69, 70, making early diagnosis and detection difficult. In many cases, joint degeneration may already be present within the knee joint before the patient seeks treatment71. Of note to this work is nocturnal pain, or pain lying in bed at night. Nocturnal pain is of particular concern to patients and clinicians as it disturbs sleep quality, thus disturbing quality of life5, and is most often unpredictable4, 72. Nocturnal pain is most likely to occur in late to final stages of OA progression73, typically manifesting after pain going up or downstairs, walking, standing, or sitting. Also, nocturnal pain, or pain lying down in bed at night, is often a required criteria for surgical interventions74.
The most common technique to assess and quantify OA-related symptoms at the knee is the Western Ontario and McMaster Universities Osteoarthritis Index (WOMAC)75, which assesses OA-related pain, stiffness, and physical function (Table 2-3). The pain subsection assesses pain while going up/down stairs, walking, standing, sitting, and lying down in bed at night. Patient responses can either be based on a self-reported visual analog scale (VAS), where the patient marks their level of pain for each element on a scale from 0 to 10075, or as a
questionnaire where patients are posed a series of questions, which are scored on a 5-point Likert scale and summed for a total possible pain score of 20 points (Table 2-4)75. Pain, stiffness, and function subsections can be used independently or collectively. Although the WOMAC tool is
12
most often reported in clinical studies, the Knee Osteoarthritis Outcome Scale (KOOS)76 or simply the presence or absence of pain63 are also used.
Table 2-3. Western Ontario and McMaster Universities Osteoarthritis Index (WOMAC) questionnaire subsections with corresponding question elements75.
Subsection Question elements
Pain Up/down stairs, Walking, Standing, Sitting, Lying in bed at night Stiffness Morning stiffness, Stiffness later in the day
Physical Function Descending stairs, Ascending stairs, Rising from sitting, Standing, Bending to the floor, Walking on a flat surface, Getting in/out of car, Going shopping, Putting on socks or shoes, Taking off socks of shoes, Rising from bed, Lying in bed, Getting in/out of the bath, sitting, Getting on/off the toilet, Performing heavy domestic duties, Performing light domestic duties
Table 2-4. Western Ontario and McMaster Universities Osteoarthritis Index (WOMAC) 5-point Likert scale scoring values75.
Response Score None 0 Mild 1 Moderate 2 Severe 3 Extreme 4 2.4 OA-related Pain
Evaluating and quantifying pain is challenging as pain is a subjective and patient-specific experience. As the knee is composed of many different tissues, with many different
characteristics, the source of OA-related knee pain is poorly understood and could be the result of multiple factors or multiple tissues71. Interestingly, patients with OA-related pain show similar changes in brain structure as patients with other diseases with chronic pain (fibromyalgia and complex regional pain syndrome) illustrating that although pain may be joint-specific, there may be additional underlying factors to consider such as pain duration (in years) and prolonged pain intensity77 . Also, within the knee joint, pain may be related to local changes in pain pathways, which could cause normal function and stimuli (which would otherwise be painless) to become painful1.
13
The large majority of our current understanding of OA pain pathogenesis relies primary on studies focusing on articular cartilage78. Although there is evidence of relationships between cartilage degeneration and OA-related pain79-82, cartilage is generally aneural and insensate83, and may not be the source of pain generation within the joint. Bone, on the other hand, is densely innervated7, 8 and may be a plausible site of pain initiation. Evidence from both human and animal studies suggest that subchondral bone may play a role in OA disease severity21, initiation45, 84, progression43, 85, and OA-related pain19.
OA-related pain may be attributed to abnormal joint biomechanics45, 47. One such theory suggests that a major element of OA initiation and progression is through adaptation and
subchondral bone remodelling of the affected joint to compensate for biomechanical
abnormalities45 (Figure 2-7). If abnormal mechanics are successfully controlled, the joint self-stabilizes. If abnormal mechanics are not successfully controlled, then the joint will continue to adapt through bone remodelling in an attempt to alter joint shape, potentially further altering local joint mechanics in a positive feedback loop, resulting in more severe pain.
14
Figure 2-7. Schematic diagram of a hypothetical process of pain pathogenesis and joint remodelling, emphasizing that subchondral bone remodelling could be the primary source of OA-related pain. In this model, the joint attempts to regulate abnormal biomechanics through joint remodelling and subchondral bone changes. If abnormal biomechanics are successfully controlled, the joint self-stabilizes; if abnormal
biomechanics are not successfully controlled, then the joint continues to proceed through bone remodelling, in an attempt to alter joint shape. Joint repair depends largely on the response and remodelling of subchondral bone; with increased bone turnover potentially increasing joint pain. Adapted
15
2.5. Image-based relationships between bone and pain
Clinical imaging (radiographs, DXA, MRI, and CT) can provide in vivo measurement techniques of bony structures in patients with OA. Commonly assessed structural bony features include alignment, osteophytes, sclerosis, attrition, subchondral cysts, BMLs, and BMD. As these are in vivo measurements, they also permit for non-invasive analysis of associations between bony features and OA-related pain.
2.5.1. Alignment
Alignment is not typically considered an imaged bony feature, but it is possible to measure (or estimate) knee alignment using radiographs, CT, or MRI. As previously mentioned, knee alignment is a commonly investigated risk factor for OA49, 86. In a neutrally aligned knee, the medial compartment supports from 60 to 80% of total joint load87. Minor alterations in
alignment, either malalignment laterally (valgus), or medially (varus) (Figure 2-8), may result in abnormal load distribution across the tibial plateau88. Although malalignment is commonly associated with OA progression89, 90, it may91-93 or may not94-96 be associated with OA-related pain. Malalignment may also contribute to other OA-related bony features such as osteophytes97 or attrition98.
Figure 2-8. Tibial position in varus (left), neutral (middle), and valgus (right) alignment. Adapted from teachmeanatomy.com.
16 2.5.2. Osteophytes
Osteophytes, or bone spurs or outgrowths along the joint margin, are perhaps the defining bony feature most associated with OA60, 61, 99 (Figure 2-9). Although the genesis or function of osteophytes within the knee joint is unclear, they may be assessed using radiographic (x-ray, DXA, or CT) or MR imaging tools, perhaps contributing to the volume of studies evaluating the association between osteophyte presence and OA-related knee pain. Osteophytes may9, 10, 47, 63, 66, 69, 99-108, or may not be92, 109-113 associated with OA-related knee pain (summarized in Table 2-5). Most often, more severe osteophytes were related to more severe pain9, 63, 69, 107. In addition, the relationship between osteophyte presence or size and pain may change with OA progression105, 106.
Figure 2-9. Sample CT images of knees with no osteophytes (left) and severe medial and lateral osteophytes on both the femur and tibia (right).
Table 2-5. Summary of image-based studies evaluating relationships between osteophytes and OA-related pain.
Author Study design Imaging modality Pain measurement tool Findings Comments
Ai et al.109 Cross-sectional MRI 3-pt verbal rating scale No significant relationship with pain. n=31 knees from 28 patients (16 male, 12 female) Osteophytes were either present or absent.
Boegård et al.100 Cross-sectional X-ray Presence/absence of
pain
Presence at inferior patellar pole, p<0.05. n=40, Only assessed PF joint. Osteophytes were either present or absent.
Boegård et al.101 Cross-sectional X-ray Presence/absence of
pain
Presence at medial tibial plateau, p<0.05. n=42, Only assessed TF joint, Osteophytes graded according to Altman61 scale.
Chang et al.111 Cross-sectional X-ray WOMAC OR=0.97 (95% CI: 0.14 to 6.65), NS (adjusted
for: age, sex, height, body weight, BMI, TF angle).
n=151 knees from 107 patients (104 females, 3 males). Osteophytes graded using: absent (0), <1cm (0.5), >1cm (1).
Chang et al.92 Cross-sectional X-ray WOMAC PF presence: β= -0.380 (SE=0.843), NS. Medial TF presence: β=0.877 (SE=0.952), NS. Lateral TF presence: β=0.301 (SE=1.037), NS. (All tests adjusted for: age, sex, BMI).
n=341 knees from 217 patients (208 females, 9 males). Osteophytes graded using: absent (0), <1cm (0.5), >1cm (1).
Cicuttini et al.103 Cross-sectional X-ray Presence/absence PF osteophytes in skyline view: OR=7.66
(95% CI: 3.68 to 15.90), Chi statistic for trend = 40.30, p<0.001.
PF osteophytes in lateral view: OR=1.83 (95% CI: 2.40 to 10.43), Chi statistic for trend = 1.34, p=0.25.
n=504 knees from 252 female patients. Osteophytes graded using a 4-point scale (0-3)114 .
Cicuttini et al.102 Cross-sectional X-ray Presence/absence Anteroposterior view: OR=5.00 (95% CI: 0.14
to 6.65), Chi statistic for trend: p<0.001 Lateral view: OR=2.87 (95% CI: 1.41 to 5.82), Chi statistic for trend: p<0.001.
Skyline view: OR=7.56 (95% CI: 3.85 to 14.81), Chi statistic for trend: p<0.001.
n=500 knees from 200 female patients. Osteophytes graded using a 4-point scale (0-3)114.
Dieppe et al.110 Longitudinal X-ray 4-pt Likert scale and
presence/absence of night pain
Medial presence and change in pain over 37 months: NS
Lateral presence and change in pain over 37 months: NS
Total n=415 (135 males, 280 females), for osteophyte presence and pain n=101. Osteophytes graded as either absent (0), present (1), or severe (2).