Utah State University Utah State University
DigitalCommons@USU
DigitalCommons@USU
All Graduate Theses and Dissertations Graduate Studies
5-2017
How High School Records and ACT Scores Predict College
How High School Records and ACT Scores Predict College
Graduation
Graduation
Lianqun SunUtah State University
Follow this and additional works at: https://digitalcommons.usu.edu/etd
Part of the Finance Commons
Recommended Citation Recommended Citation
Sun, Lianqun, "How High School Records and ACT Scores Predict College Graduation" (2017). All Graduate Theses and Dissertations. 6226.
https://digitalcommons.usu.edu/etd/6226
This Thesis is brought to you for free and open access by the Graduate Studies at DigitalCommons@USU. It has been accepted for inclusion in All Graduate Theses and Dissertations by an authorized administrator of DigitalCommons@USU. For more information, please contact digitalcommons@usu.edu.
COLLEGE GRADUATION
by
Lianqun Sun
A thesis submitted in partial fulfillment of the requirements for the degree
of MASTER OF SCIENCE in Economics Approved: ______________________ ____________________
Devon Gorry, Ph.D. Dwight Israelsen, Ph.D.
Major Professor Committee Member
______________________ ___________________
Jason Smith, Ph.D. Christopher Fawson, Ph.D.
Committee Member Committee Member
_______________________________________ Mark R. McLellan, Ph.D.
Vice President for Research and Dean of the School of Graduate Studies
UTAH STATE UNIVERSITY Logan, Utah
ii
Copyright © Lianqun Sun 2017 All Rights Reserved
ABSTRACT
How High School Records and ACT Scores Predict College Graduation
by
Lianqun Sun, Master of Science Utah State University, 2017
Major Professor: Dr. Devon Gorry Department: Economics and Finance
This thesis is based on the data analysis of a large public university’s admission and graduation records between 2006 and 2014. Probit regressions were applied to analyze the relationship between high school GPA, class rank, ACT scores, and
Advanced Placement (AP) test credits, and college graduation. All of the aforementioned variables were found to be significant predictors to college graduation rates. In both controlled and uncontrolled models, class rank had the largest predictive magnitude power to college graduation compared to other variables at the same significance level, followed by high school GPA, ACT scores and AP credits. In reviewing data from ACT component scores, ACT English and ACT Math were the only significant predictors to college graduation. There was heterogeneity for these variables across race, sex and residency, but at different significance levels.
iv PUBLIC ABSTRACT
How High School Records and ACT Scores Predict College Graduation
Lianqun Sun
The primary purpose of this study is to assess the degree to which ACT scores and high school records predict success in college. I used large public university
admission and graduation panel data in order to address the following questions: (1) Are high school records (class rank, high school grade point average (GPA), and Advanced Placement (AP) test credits) better predictors of college success than ACT scores, and which is the best predictor among high school records and ACT scores? (2) Is there any heterogeneity in these effects across race, sex and residency (state or non-state students)?
By answering these questions, this study can help college admissions departments improve their processes in order to select the best students who can succeed in college, and will benefit high school students and school counselors. High school students could focus on improving aspects that are helpful for their preparation to academic success in college. For example, students who do badly on their ACT English and Math can work harder to improve them. School advisors and counselors could use the results of this study to give practical and helpful suggestions to students so they may better prepare for college-level courses.
ACT English and ACT Math were the only significant predictors to college graduation. There was heterogeneity for these variables across race, sex and residency, but at different significance levels.
CONTENTS
Page
ABSTRACT ... iii
PUBLIC ABSTRACT ... iv
LIST OF TABLES ... vi
LIST OF FIGURES ... vii
INTRODUCTION ...1
LITERATURE REVIEW ...3
METHODOLOGY ... 7
Data Description ...7
Method Section ... 14
RESULTS AND CONCLUSION ...17
Results ...17
Conclusion ...26
vi LIST OF TABLES
Table Page
1 Descriptive Statistics ...9 2 Correlation of All Independent Variables ...18 3 The Marginal Effects of High School Scores and ACT Composite to College
Graduation ...18 4 Regression Results of ACT Component Scores to College Graduation ...22 5 The Interaction Variable Coefficients across Sex, Race, and Residency ...24
LIST OF FIGURES
Figure Page
1 Percentage of students by different groups and the graduation rate for each group ...10 2 Average high school GPA by sex, race, and residency...12 3 Average ACT English, Math, Reading, Science and Composite scores by
sex, race, and residency ...12 4 Average high school rank by sex, race, and residency ...13 5 AP students across sex, race, and residency ...14
INTRODUCTION
High school performance and standardized test scores (e.g. ACT and SAT scores) are important not only to students and parents, but for colleges and universities as they review applicants. Whether a high school student can gain admission to college or not is highly dependent on his or her high school records (e.g. GPA, class ranking, and AP credits) and standardized test scores. College admission policymakers are interested in recruiting outstanding or high potential students into college who are more likely to be successful in college. While academic success can be defined in many ways (e.g. college GPA, graduation rate, etc.), this study focuses primarily on college graduation. Many studies have shown that college performance is highly correlated with a student's high school performance. ACT scores and high school records are the most common metrics used to determine admission to college, but different schools place varying weight on their importance. Researchers have studied the relationship between college performance and high school records and ACT tests in various ways with different datasets, but the results are highly dependent.
The primary purpose of this study is to assess the degree to which ACT scores and high school records predict success in college. I use large public university admission and graduation panel data in order to address the following questions: (1) Are high school records (class rank, high school grade point average (HSGPA), and Advanced Placement [AP] test credits) better predictors of college success than ACT scores, and which is the best predictor among high school records and ACT scores? (2) Is there any heterogeneity in these effects across race, sex and residency (in-state or out-of-state students)?
improve their processes in order to select the best students who can succeed in college, and will benefit high school students and school counselors. High school students could focus on improving aspects that are helpful for their preparation to academic success in college. For example, students who do badly on their ACT English and Math can work harder to improve them. School advisors and counselors could use the results of this study to give practical and helpful suggestions to students so they may better prepare for college-level courses.
3 LITERATURE REVIEW
There have been many studies on how well high school records and standardized tests scores predict college success. Good high school performance usually predicts college success well, because high school performance measures a student’s potential and his or her preparedness for academic success in college. Standardized test scores have played an important role in college admissions determinations. For example, the ACT test is a nationwide college admissions examination, and contains four subject tests: English, Mathematics, Reading, and Science. ACT test scores sit on a scale of 1-36. In addition to the scores from these four subject tests, students also receive a composite score, which is the average of those four test scores. Most colleges weigh ACT scores more heavily than other high school performance indicators. Lenning (1975) shows that the ACT (as well as SAT) scores gives good prediction validity to freshman GPA. Noble & Sawyer (1987) show that ACT test scores had higher predictive ability than self-reported high school grades. Noble and Sawyer found that the ACT Composite score was an effective predictor to college achievement in all first-year college GPA level (2002).
SAT scores have been used longer than ACT test scores, and there have been more studies about how well SAT scores and high school records predict college GPA. Wilson’s early review found that the combination of SAT scores and high school records better predicted college cumulative GPA than either factor alone (1983). Ramist et al. also found that the average correlation between the combination of SAT and high school record and the first-year GPA was 0.65 by among 685 institutions with all components of SAT scores and high school records in the database (1994). Later researchers confirmed that the
combination of high school records and SAT scores has consistently been the best predictor for the cumulative GPA and first-year GPA (Ramist et al., 1990; Ramist, Lewis, & McCamley-Jenkins, 1994; Willingham, Pollack, & Lewis, 2000; Elliott & Strenta, 1988; Young, 1991a; Young, J. W., & Barrett, C. A., 1992; Ramist & Weiss, 1990; Leonard & Jiang, 1995.)
The high school grade point average (HSGPA) is calculated from grades received in high school courses, and measures students’ persistence and mastery of high school-level knowledge and skills. It has become more important in college admissions, and some scholars have found that HSGPA is a better predictor of college performance (college GPA) alone than other measures, e.g. placement test or standardized test scores. (Belfield & Crosta, 2012; Camara & Milewski, 2002; Geiser & Studley, 2001). The HSGPA is consistently the best predictor not only for freshman grades in college, but also for four-year outcomes (Geiser & Santelices, 2007; Burton & Ramist, 2001). The combination of high school grades and SAT scores are substantial and significant predictors to first-year college GPA, and high school grades are often slightly better predictors of college performance (Camara & Echternacht, 2000). Noble and Sawyer found that both HSGPA and ACT Composite score were effective in predicting first-year college GPA, but HSGPA were more effective and accurate at the 2.00, 2.50, and 3.00 levels of first-year GPA, but less effective at the 3.25, 3.50, and 3.75 levels of first-year GPA (2002). Myers and Pyles also found that the combination of high school grades and ACT test scores are better predictors of freshman GPA than ACT test scores alone (1992). Others have found that high school grades are the best predictor for students’ first-year college GPA, overall
5 college GPA, and college graduation, while standardized tests are mainly useful as a supplement factor (Atkinson & Geiser, 2009, Geiser & Studley 2003; Geiser, 2008b; Willingham & Breland, 1982; Ramist, 1984; Crouse & Trusheim, 1988; Bowen & Bok, 1998; Rothstein, 2004).
Besides ACT scores and HSGPA, class ranking and Advanced Placement (AP) test scores are also associated with college success. Belfield and Crosta found that placement test scores are positively associated—albeit weakly—with college GPA (2012). Sadler and Tai’s research showed that students who takes AP courses or honors science courses in high school perform better in their college science classes (2007). Similarly, Willingham and Morris’ study also found that students who take AP courses have better academic records and are more successful overall (1986). More specifically, Morgan and Ramist found that most students with AP test scores of 4 or 5 (out of the maximum 5) performed extremely well in their initial major courses after finishing general and introductory courses (1998). Regarding the relationship between AP exams and college graduation, Dougherty and Mellor found that passing AP exams is the best AP-related indicator that could improve the percentage of the students who graduate from school (1992).
Class rank is a ranking of a student’s overall academic performance compared to those of other students in his or her class. Crouse and Trusheim reported that the importance of high school class ranking in making admissions decisions by creating different regression equations with and without the SAT from various data sources to predict freshman GPA (1988). Niu and Tienda found that class ranking is a superior predictor for college performance and a better predictor than standardized test scores, and this
conclusion holds for all four measures of college performance, which includes freshman year cumulative GPA, four-year cumulative GPA, freshman year attrition, and four-year graduation rate (2012). Baron and Frank concluded that class ranking added significant effects in overall prediction of college course grades. In their paper, class ranking alone explained 0.305 variance of cumulative GPA, the highest among all variables. Manski and Wise found that by controlling for SAT scores, an increase in high school rank by one standard deviation is associated with an eleven-percentage point increase in graduation rates (1983). Willingham found that SAT and high school rank predict graduation rates, and also found that students with high SAT scores and high school rank were also more likely to complete double majors and to graduate earlier than others (1985). Baron and Norman examined how SAT scores and class ranking predict college performance, and found SAT scores are redundant when considering other variables together, for example, achievement test and high school class rank (1992). They also found that high school rank was a better predictor to cumulative college GPA alone or with other predictors, e.g. SAT scores (1992).
7 METHODOLOGY
Data Description
The data used in previous studies fall into two categories. The first category includes datasets from before 2000. For example, Geiser and Santelice (2007) used first-year students who entered the University of California between fall 1996 and fall 1999. Bridgeman, McCamley and Ervin (2000) collected data on incoming classes from 23 colleges from 1994 to 1995. Noble and Sawyer used large datasets from 1987 and 2002: The first covers 277 institutions that participated in Standard Research Services between 1980 and 1984, and drew mainly from students’ courses and plot questionnaire data; the second covers 216 institutions from ACT’s Prediction Research Service between 1996 and 1998. Rose and Bett (2001) used survey data between 1980 and 1992. Morgan and Ramist (1998) analyzed students’ records from 21 colleges in the fall of 1991. Dougherty, Mellor and Jian (2006) analyzed Texas graduates from high school and enrolled into Texas public colleges in 1998. Baron and Norman (1992) used enrolled freshmen’s data from University of Pennsylvania in the fall of 1983 and 1984.
The second category includes inconsistent and incomprehensive data on college graduation rates rather than college GPA after the year 2000. For example, Cohn, Balch and Bradley (2004) studied 521 out of 731 economics undergraduate students during spring 2000, fall 2000, and spring 2001 at the University of South Carolina. Robinson and Monks (2004) selected 2627 applicants enrolled in fall 2001 and 2445 applicants in 2000. Sawyer (2010) used a large database on the freshman classes of 192 four-year postsecondary
institutions from 2003 (1 percent of institutions), 2004 (31 percent), 2005 (68 percent), and 2006 (1 percent). Niu and Tienda (2012) did their analysis based on administrative data for five universities in Texas in fall 2002. Belfield and Crosta (2012) used administrative datasets provided by Statewide Community College System, which includes college transcripts (GPA) and high school data between fall 2008 and summer 2010. The databases in those papers after 2000 show data from either for one or two semesters, or specific courses. However, the database I used in my paper not only has administrative data from student’s high school, but also tracks students’ transfer and enrollment into different colleges. My research will contribute new prospective to the previous studies based on the complete and comprehensive dataset for students from the day they enrolled in college to the day they leave higher education.
In my research, the data was collected from a large public university, which includes undergraduate students’ admissions records and college graduation data between 2006 and 2014. Specifically, this dataset includes students who enrolled into the university in 2006, 2007, and 2008, and follows them until 2014. The students’ admissions record includes demographic information, e.g., sex, race, age, and residency as well as their submitted high school scores, e.g., HSGPA, ACT scores, class ranking, and AP credits. College success is also evaluated by the college graduation rate, which is a relatively new phenomenon as graduation rate data was first collected in 1996. According to the Baccalaureate and Beyond Longitudinal Study, the average time to get a bachelor’s degree is six years. College graduation is defined as a student finishing a four-year college within six years. Griesemer (2009) stated that a college’s graduation rate should be considered a
9 Table 1
Descriptive Statistics
key factor in selection for prospective students. College graduation rates are also a good measurement of how well an institution is doing, and how long it takes students to graduate for college admission boards. Part of my purpose for this paper is to provide practical and accurate suggestions to policy boards.
Table 1 is the summary of the main variables. 10,327 students have graduated. Graduation is a dummy variable: The number “1” indicates that the student graduated from a baccalaureate institution within six years; if not, the variable is “0.” The overall graduation rate for this university is around 45%, according to the definition of college graduation within 6 years after enrollment. Class ranking is the percentage ratio of class rank divided by class size. The smaller class ranking represents the better overall performance at class. The ACT test is more popular for this college and students instead
Variable Obs Mean Std. Dev. Mininum Maximum High School GPA 9,644 3.514 0.457 1.11 4 (HSGPA) ACT English 9,410 23.548 5.113 3 36 ACT Math 9,410 23.112 4.648 12 36 ACT Reading 9,410 24.781 5.254 10 36 ACT Science 9,410 23.497 4.036 10 36 ACT Composite 9,405 23.566 4.059 11 36 (ACTCOM) Class Ranking 8,203 0.308 0.234 0.0012 1 (RANK) AP Credit 2,402 3.67 8.506 0 68 (AP) graduation Rate 10,327 0.449 0.497 0 1 (GRAD)
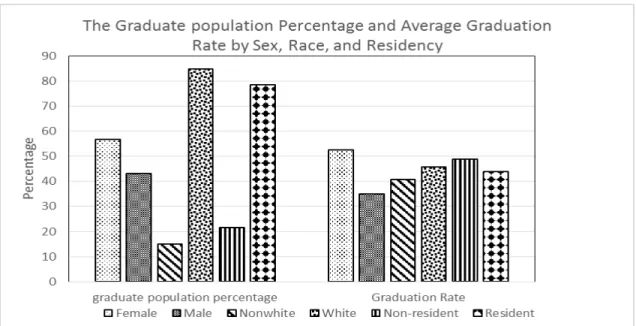
Figure 1. Percentage of students by different groups and the graduation rate for each group.
of SAT scores due to the colleges’ location. The average ACT test score is higher than the national average, which was 21.1 between 2006 and 2008.1 Other group variables used in
the regressions are sex, race and residency, which are all dummy variables. If sex= “1” means female, and “0” means male. White students is donated by race= “1”, and non-white students is when race= “0”. When residency= “1”, it means resident students, otherwise means nonresident students. Figure 1-5 are the charts of the average level of HSGPA, class rank, ACT scores, and AP scores across sex, race and residency groups.
Figure 1 shows the student population distribution and the graduation rates for different demographic groups. About 85% of the students are white, and only 15% are
1 National average ACT composite score is from “Table 155. ACT score averages and standard deviations, by sex and race/ethnicity, and percentage of ACT test takers, by selected composite score ranges and planned fields of study: Selected years, 1995 through 2010”, 2010, National Center for Education Statistics (NCES), https://nces.ed.gov/programs/digest/d10/tables/dt10_155.asp.
11 nonwhite. Nonwhite students includes Black, Hispanic, Asian/Pacific Island, and American Indian/Alaska Native. About 57% of the students are female students, and 43% are male. A large percentage of students are from in state, and only 20% are from other states.
The overall average graduation rate is 45%. Female student’s graduation rate is 52%, and the average graduation rate for males is 35%. This percentage is consistent with some previous studies. Astin and colleagues found that women are slightly more likely to graduate from college than men (1996). Bowen and Bok also found that female more likely to graduate than male (1998). Kanarek reported that female students in a large mid-Atlantic university were slightly more likely to graduate than men (1989). Nonwhite students’ graduation rate is 41%, which is not far away from white’s 46%. The graduation rate for nonresident student is five percent higher than for resident students. This may be because it is easier for resident students to get into college than it is for nonresident students. Nonresident students have more competition and have to pay higher tuition, and these costs may ration college admission to students who are more motivated to succeed.
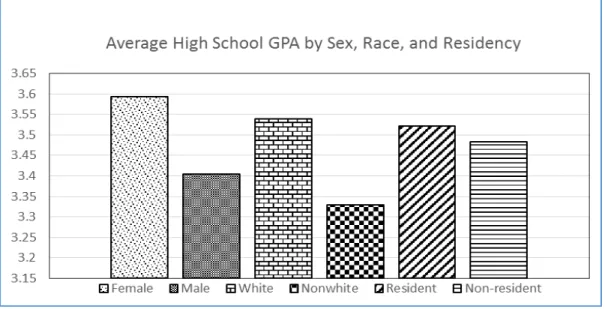
The overall HSGPA is 3.51. HSGPAs for female students average around 0.1 points higher than the overall level and 0.2 points higher than male students’ HSGPAs (see Figure 2). The average HSGPA for white students is 3.54 and 3.33 for nonwhite students. Both resident and nonresident student’s HSGPAs are very close to the overall average level.
Figure 3 shows the average level for all ACT scores by different groups. Female students’ average English and Reading scores are better than male students’ average English and Reading score. However, male students’ average ACT Math, Science, and
Figure 2. Average high school GPA by sex, race, and residency.
Figure 3. Average ACT English, Math, Reading, Science and Composite scores by sex, race, and residency.
Composite scores are higher than female students’ average. This might be one reason that male students are more likely to choose majors that are associated with math and science, and female students are more likely to choose language, nursing, or other majors that do
13
Figure 4. Average high school rank by sex, race, and residency.
not require much math skills. White students’ ACT English, Math, Reading, Science and Composite are all better than nonwhite students’ due to the large population of white students in this university. Nonresident students’ overall ACT scores are higher than resident students, which reflects the higher qualification to nonresident students to enroll into this university compared to resident students.
The overall average high school rank is 31%, which means student’s average high school overall performance is above 31%, compared to different groups in Figure 4. Males students’ class rank (36.7%) is much higher than female students’ (26.5%), which indicates that female students’ performance in class is better, since lower class rank means better class performance. Similarly, white students’ class performance (29.9%) is better than nonwhite (38.1%). Nonresidents’ class rank is higher than residents’ class rank—in other words, residents’ class performance is better than nonresident, which is consistent with
their HSGPA, since HSGPA is one of the main factors in calculating class rank.
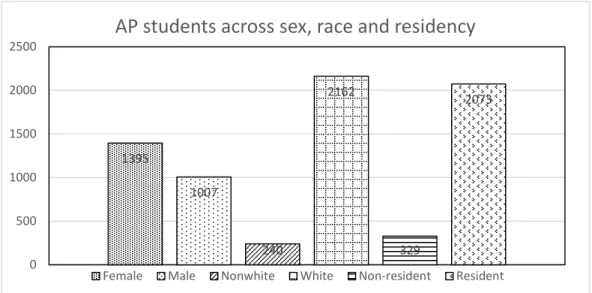
2,402 out of the surveyed 10,328 students received AP credits, which accounts for 23%. Of these 2,402 AP students, 90% of white students have AP credits, while only 10% of nonwhite students received AP credit. 16% more female students earned AP credits than male students. Nonresident students who have AP scores only account for 14% of the total number of AP students. The graduation rate for students who have AP scores is 61.5%, which is much higher the overall graduation rate (45%). In addition, the graduation rate for non-AP students is 40%, lower than the overall rate. Students who have AP scores are more likely to graduate from college than students who do not have AP credits.
Method Section
The unit measurement of each variable is quite different from one another, for example, HSGPA is measured by 0 to 4, while class ranking is between 0 and 1, and range
Figure 5. AP students across sex, race, and residency. 1395 1007 240 2162 329 2073 0 500 1000 1500 2000
2500
AP students across sex, race and residency
15 of ACT is between 1 and 36. In order to explain the marginal effects for each variable in a better way, all the variables are standardized by their standard deviation, which means each variable in the regression models is divided by its standard deviation. The same calculation to all the independent variables, and so, the marginal effect will be measured by one standard deviation change instead of one unit change for each variable.
Probit regression model will be mainly used in this paper, which is a Generalized Linear Model for binary outcome since the dependent variable is 1 or 0. The basic model is: 𝜋𝜋= 𝛼𝛼+𝛽𝛽𝛽𝛽, where 𝜋𝜋=𝑃𝑃(𝑌𝑌 = 1|𝛽𝛽) is the probability of success, while 𝜋𝜋=𝑃𝑃(𝑌𝑌 =
0|𝛽𝛽)is the probability of failure. The parameter β represents the change of the probability in per unit change of x (here is change in standard deviation). Therefore, based on the data, the specific Probit regression model is
𝜋𝜋= 𝛽𝛽0 + 𝛽𝛽1∗ 𝐻𝐻𝐻𝐻𝐻𝐻𝑃𝑃𝐻𝐻+𝛽𝛽2∗ 𝐻𝐻𝐴𝐴𝐴𝐴𝐴𝐴𝐴𝐴𝐴𝐴+𝛽𝛽3∗ 𝑅𝑅𝐻𝐻𝑅𝑅𝑅𝑅+𝛽𝛽4∗ 𝐻𝐻𝑃𝑃+𝜀𝜀 Formula (1)
Where 𝜋𝜋 =𝑃𝑃(𝑌𝑌= 1) is the probability of graduating from four-year colleges or universities. Table 3 and Table 4 are the regression results based on this method, and all the coefficients are the marginal changes to the probability of graduation based on one standard deviation change of each variable.
Besides the linear probability model, we test our heterogeneity across race, sex, and residency by creating an interaction variable. For example, the model for testing HSGPA across sex is:
𝜋𝜋= 𝛽𝛽0 + 𝛽𝛽1∗ 𝐻𝐻𝐻𝐻𝐻𝐻𝑃𝑃𝐻𝐻+ 𝛽𝛽2∗ 𝐻𝐻𝑆𝑆𝑆𝑆+ 𝛽𝛽3∗(𝐻𝐻𝐻𝐻𝐻𝐻𝑃𝑃𝐻𝐻 ∗ 𝐻𝐻𝑆𝑆𝑆𝑆) + 𝜀𝜀 Formula (2)
Where 𝜋𝜋 =𝑃𝑃(𝑌𝑌= 1) is the probability of graduating from four-year colleges or universities. The significant level of the coefficient for the interaction variable indicates whether the marginal effects of HSGPA has heterogeneity across sex or not. Similarly, we will use this method to test heterogeneity for other factors, e.g. class ranking, AP credits, and ACT composite, across sex, race and residency.
17 RESULTS AND CONCLUSION
Results
Table 2 shows the summary of the correlation among all independent variables, which will help explain and understand the coefficients from all regressions. Table 3 is the results for the main Probit regression models for HSGPA, ACT Composite, Class Rank, and AP credits, including R square for the model and standard error for each variable. Table 4 illustrates the results for ACT English, Math, Reading, and Science based on the linear probability regression for college graduation. Table 5 shows the interaction coefficients for high school GPA (HSGPA), ACT Composite (ACT COM), class ranking, and AP credits for different groups. In addition, t test can be applied to check which factor is a better predictor is among different pairs.
There is median correlation between ACT component scores and HSGPA since the correlation coefficients are between 0.3 and 0.5. Because the ACT Composite is the average of ACT component scores, they are highly correlated, and are therefore the reason I used the ACT Composite score in the main regression model. Class Rank is median correlated to all the other variables except HSGPA, and it is extremely high when correlated to HSGPA, which is because rank is mainly based on the HSGPA. AP credit has low correlation to all other variables.
Table 3 shows the Probit regression results regarding to the marginal effects of high school scores, ACT Composite, class ranking and AP credits (divided by their standard deviation) to college graduation based on Formula 1. For example, one standard
Table 2
Correlation of All Independent Variables
Table 3
The Marginal Effects of High School Scores and ACT Composite to College Graduation
deviation change in the HSGPA is associated with an 18.82% point increase in college graduation (see Model 1). The HSGPA is a strong predictor to college success even combining with other factors together (see Model 7), it can still predict college graduation, but the coefficient shrinks to 6% with the same strong statistical significance level. The
HSGPA ACT EnglishACT Math ACT ReadiACT Science ACT CompClass Ranki AP credits
HSGPA 1 ACT English 0.485 1 ACT Math 0.507 0.649 1 ACT Reading 0.366 0.736 0.547 1 ACT Science 0.389 0.654 0.724 0.673 1 ACT Composite 0.484 0.881 0.823 0.863 0.858 1 Class Ranking -0.943 -0.498 -0.523 -0.375 -0.407 -0.500 1 AP credits 0.243 0.333 0.367 0.315 0.326 0.383 -0.245 1
Graduation Model 1 Model 2 Model 3 Model 4 Model 5 Model 6 Model 7
HSGPA 0.1882*** 0.17*** 0.0597*** (0.0058) (0.0069) (0.0158) ACT Composite 0.1197*** 0.0315*** 0.0416*** 0.0322*** (0.0053) (0.0073) (0.0066) (0.0074) Class Ranking -0.1942*** -0.1741*** -0.1231*** (0.0062) (0.0072) (0.0153)) AP credits 0.0884*** 0.0218*** 0.0195*** 0.0198** (0.0052) (0.0065) (0.006) (0.0065) Adjusted R² 0.088 0.095 0.04 0.021 0.099 0.094 0.1 Obs 9643 8203 9405 10327 7922 9195 7922 Significance level: * p≤0.05, ** p≤0.01, *** p≤0.001
19 HSGPA is consistent with students’ work ethics, productivity and desire to learn, and it is a better measurement of student’s capability and diligence, which is what we discovered in our analysis. Therefore, a good HSGPA can indicate that that a student is prepared for college.
Class ranking has negative marginal effect to college graduation because the smaller class ranking indicates better performance at class. If class ranking decreases by one standard deviation, which is 0.24, the probability of college graduation will rise by 19.4 percentage points (see Model 2 in Table 3). Class ranking reflects students’ cumulative capability and overall performance at class, which includes their HSGPA, math skills, writing skills, etc. Comparing the prediction coefficients with HSGPA, class ranking has more predictive power than HSGPA at the same significance level. In Model 6 of Table 3, which compares all of the aforementioned high school factors together, class ranking still has the largest magnitude in predicting college graduation, which is 12.3 percentage points.
In order to check whether HSGPA and class ranking are significantly different, I also used the t test. The p value in the test is 0.0351, which means HSGPA and class ranking are significantly different at 5% level. This result implies that class ranking is a better predictor than HSGPA.
Because HSGPA and class ranking are highly correlated (-0.9431), I use Model 5 and Model 6 along with Model 7 in Table 3 to do informal robustness test of the model and serious multicollinearity. Take Model 5 and Model 7 for example. The coefficient of AP credit changes by 0.002, which is 9.2% between Model 5 and Model 7. For ACT Composite,
the coefficient between these two models changes even smaller, only 2.2%. The R square in these two models changes by 0.0013, which is only 1%. The goodness of fit of these models hardly change. Comparing Model 6 and Model 7, the coefficient of ACT Composite changes by 0.0094; and the coefficient of AP credit changes merely by 1.5%. The R square in these two models changes by 0.0066. HSGPA and class ranking do not have perfect collinearity but extremely high collinear, this model is robust to misspecification in order to test how other variables will be affected by either of them. The other two variables (ACT Composite and AP credit) in Model 7 (of Table 3) are very robust, and their coefficients are largely unaffected. The t-statistics are still very high, which means both of them are still good predictors.
The ACT Composite score is positively associated with college graduation rates. In Model 3 (of Table 3), the marginal effect to college graduation is 0.1197, which means that if the ACT Composite goes up by one standard deviation (which is 3.92), the probability of graduating from college will be increased by 11.97 percentage points, and it is statistically significant. However, the predictive power decreases, but stays between 3 to 4 percentage points’ level when adding other factors into the models (see Model 5, 6 & 7 in Table 3). It is significant because the change of coefficients waves very little even model includes different other variables.
By analyzing AP credits alone (see Model 4 in Table 3), the coefficient means if increases student’s AP credits by one standard deviation, the probability of graduating from college will increase by 8.84 percentage points with strong statistical significance. However, its R square is only 0.0215 which is much smaller than other models. Model 5,
21 & 6, it combines with other different variables (see Table 3), AP credits become smaller in magnitude but still statistically significant. The magnitude of coefficients in these two models are around 2 percentage points. In Model 7 (see Table 3), the coefficient stays the same level as in Model 5 & 6, but becomes less significant, which is at 1% significance level instead of 0.1%. Compare to other three factors, AP credit has smaller predictive power to college graduation (in Model 7), which is not surprising. AP credit is an optional requirement for most colleges and universities’ admission and there is heterogeneity across high schools of whether students have the opportunity to take AP courses. Some high schools do not offer AP courses, or only offer a small selection of AP courses due to the sizes and locations of high school. The availability of AP courses to students is quite different among different high schools. Since AP courses are college entrance level courses and comparatively difficult to high school students, students who take AP courses do not need to take some entrance level or general courses in college and can register for mid-level courses, which will help them finish college faster.
I also analyzed to check which ACT component score is better than the others in predicting college success rates. All ACT component scores are statistically significant when running regressions separately, ACT English and ACT math both have large magnitudes and higher R2 than ACT Reading and Science at the same significance level.
If the students increase their ACT English (see Model 1) by one standard deviation (5.11, see Table 1), the probability of graduating from college will increase by 13 percent. If the ACT Math score increases by one standard deviation (see Model 2), it is associated with the probability of graduating from colleges increasing by 11.44 percent (4.65, see Table 1).
Table 4
Regression Results of ACT Component Scores to College Graduation
Similarly, the marginal effect to college graduation for ACT Reading (standard deviation is 5.25, see Table 1) in Model 3 is 9.83 percentage points, and for ACT Science (standard deviation is 4.04, see Table 1) in Model 4 is 9.15 percentage points. In the cumulative Model 5, ACT English and Math are both statistically significant and positively predict college graduation. An increase in ACT English by one standard deviation is associated with an increase of the probability of college graduation by 9.88 percentage points. If the ACT Math score increases by one standard deviation, the probability of graduating from colleges increases by 6.56 percentage points. The marginal effect of ACT Reading in Model 5 is not statistically significant, while Science has negative marginal effect to college graduation, which is a very unusual result.
A t test is applied to test whether magnitudes are significantly different after controlling for other subjects between ACT English and Math, the corresponding p value is 0.0167, which means ACT English and Math are statistically different at 5% significance
The Marginal Effects of ACT scores to College graduation
Graduation Model 1 Model 2 Model 3 Model 4 Model 5
ACT English 0.13*** 0.0988*** (0.0054) (0.0089) ACT Math 0.1144*** 0.0656*** (0.0053) (0.0082) ACT Reading 0.0983*** 0.0057 (0.0053) (0.0084) ACT Science 0.0915*** -0.0241** (0.0052) (0.0087) Adjusted R² 0.046 0.037 0.027 0.024 0.051 Obs 9410 9410 9410 9410 9410 Significance level: * p≤0.05, ** p≤0.01, *** p≤0.001
23 level and English is a slightly better predictor than Math.
All ACT component scores are statistically significant in predicting college success, which explains why ACT scores are so popular to college entrance admissions. ACT scores, especially ACT English and Math, often act as main determining factors for honor classes and scholarships. ACT Math is also an important factor to decide whether to take math courses in college or not. If you do not do well in ACT Math, you can be advised to take introduction math courses to help you succeed in college. To policy makers, students who do poorly in ACT English and Math should receive immediate help before taking further college courses.
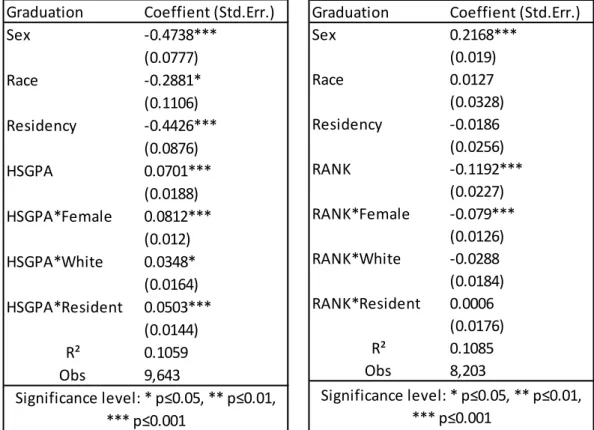
By applying Formula 2 in the Methodology section, I calculated the interaction variables for HSGPA, ACT Composite, Class Ranking, and AP credits in three groups: sex, race and residency. In Table 5-1, the HSGPA’s marginal effects to college graduation has heterogeneity across sex, race and residency at different significance levels. If the student is a female (when sex=1), and if the HSGPA is increased by one standard deviation, the probability of college graduation will also increase by 8.12 percentage points compared to a male student with similar circumstances where the p-value is at 0.1% significance level. If the student is a white and their HSGPA is increased by one standard deviation, the probability of college graduation for this student will also increase by an extra 3.48 percentage points compared to a nonwhite student with 5% statistical significance. If the student is a resident, the marginal effect of college graduation rate for HSGPA will increase by 3.91 percentage point more than for nonresident students, which has strong statistical significance.
Table 5-2 is the interaction coefficient list for class ranking, and only interaction coefficient (0.079) for class rank and sex is statistically significant (at 0.1 significance level). If the student is female, and her class ranking decreases by one standard deviation, the probability of graduating from college will increase by an additional 7.9 percentage points compared to a male student. This is one of the reasons that class rank is a better predictor. Class rank is not different across race and residency. There is not a difference for people who are white, black, Hispanic, or Asian, and there is no significant difference between resident and nonresident students.
Table 5
The Interaction Variable Coefficients across Sex, Race, and Residency
Table 5-1. Table 5-2. Graduation Coeffient (Std.Err.)
Sex 0.2168*** (0.019) Race 0.0127 (0.0328) Residency -0.0186 (0.0256) RANK -0.1192*** (0.0227) RANK*Female -0.079*** (0.0126) RANK*White -0.0288 (0.0184) RANK*Resident 0.0006 (0.0176) R² 0.1085 Obs 8,203 Significance level: * p≤0.05, ** p≤0.01, *** p≤0.001
Graduation Coeffient (Std.Err.)
Sex -0.4738*** (0.0777) Race -0.2881* (0.1106) Residency -0.4426*** (0.0876) HSGPA 0.0701*** (0.0188) HSGPA*Female 0.0812*** (0.012) HSGPA*White 0.0348* (0.0164) HSGPA*Resident 0.0503*** (0.0144) R² 0.1059 Obs 9,643 Significance level: * p≤0.05, ** p≤0.01, *** p≤0.001
25 Table Continues
Table 5-3. Table 5-4
Both ACT Composite and AP credits have heterogeneity for marginal effect to graduation across sex, and the ACT Composite heterogeneity has cross residency (see Table 5-3 and Table 5-4). Female students increase the probability of graduating from college by 7.35 percentage points more than male students if their ACT Composite is increased by one standard deviation at the same time, and the probability will increase by 4.69 percentage points if AP credit is increased by one standard deviation, and both are at 0.1% significance level. A resident student is 3.91 percentage points more likely to graduate from college than nonresident student with the same circumstances, with 1% statistical significance.
Graduation Coeffient (Std.Err.)
Sex 0.1661*** (0.0107) Race 0.0331* (0.0149) Residency -0.091*** (0.0131) AP 0.0843*** (0.0235) AP*Female 0.0469*** (0.0107) AP*White -0.0092 (0.0187) AP*Resident -0.0032 (0.0177) R² 0.0504 Obs 10,327 Significance level: * p≤0.05, ** p≤0.01, *** p≤0.001
Graduation Coeffient (Std.Err.)
Sex -0.2189*** (0.062) Race -0.0743 (0.0975) Residency -0.2507** (0.0788) ACTCOM 0.0447* (0.0202) ACTCOM*Female 0.0735*** (0.0108) ACTCOM*White 0.0127 (0.0171) ACTCOM*Resident 0.0391** (0.0142) R² 0.0739 Obs 9,405 Significance level: * p≤0.05, ** p≤0.01, *** p≤0.001
Overall, there is heterogeneity for HSGPA, ACT Composite, and class ranking’s marginal effect to graduation across sex, and for HSGPA and ACT Composite’s marginal effects across residency and only HSGPA across race with different significance level.
Conclusion
If we examine the adjusted R squared for all the regression results, R square is minimal. Even in the comprehensive Model 7 (see Table 3), the R square is still only 0.1. The small R square implies that there are other factors that might explain the data better, though they have not been included in this analysis. In my view, there are three main reasons why our data cannot better explain college graduation. First, whether students get married or not in college could affect their graduation rate and graduation time. Second, due to military service or religious service, some students choose to discontinue their college for a certain period of time, which would affect their graduation rate. Third, different financial circumstances can affect students’ completion times. Some students are from less wealthy families, and cannot afford expensive college tuition. They may be required to drop out of school temporarily. The longer they are away from school, the harder it might be to return. For these reasons, the standard cutoff date for students who graduate within six years will exclude those who graduate in seven or eight years.
Further research can extend the definition of graduation rate to seven or eight years instead of six years. In addition, further research could gather more data that obtains student marriage status, family background, work status, and military or religious service.
27 and AP credits are still statistically significant predictors to college graduation. There is heterogeneity for these variables across sex, race, and residency regarding to their marginal effects to college graduation.
College admission boards should consider placing more weight on high school class rank and high school GPA rather than ACT scores. In addition, when they are evaluating SAT scores, emphasis should be placed on both the ACT English and Math. By doing so, colleges and universities can admit students who are more likely to be successful from high school. Colleges should design specialized curricula, for high school students who do poorly on the ACT English or Math tests, and require them to take improvement courses. This would allow them to be more prepared for both general and advanced courses related to their major.
REFERENCES
Astin, A. W., Tsui, L. and Avalos, J. (1996). Degree attainment rate at American colleges and universities: Effect of race, gender, and institutional type. Washington, DC, American Council on Education.
Atkinson, Richard C. and Saul Geiser. (2009).Reflections on a century of college admission tests. Educational Researcher, December, 38(9), 665-676.
Baron, J., and Norman, F. M. (1992). SATs, achievement tests, and high-school class rank as predictors of college performance. Educational and Psychological Measurement, v52 n4 p1047-55.
Belfield, C., P., Crosta. (2012) Predicting Success in College: The importance of Placement Tests and High School Transcripts. CCRC Working Paper No. 42. CUNY, Columbia University.
Bowen, W.G.; Bok, D. (1998). The shape of the river: Long-term consequences of considering race in college and university admissions. Princeton, NJ, Princeton University Press.
Bridgeman, B., McCamley-Jenkins, L., and Ervin, N. (2000). Predictions of Freshman Grade-Point Average From the Revised and Recentered SAT 1, Reasoning Test. College Board Research Report NO. 2000-1 ETS RR No.00-1.
Burton, N., and Ramist, L. (2001) Predicting Success in College: SAT Studies of Classes Graduating Since 1980. College Board Research Report, No. 2001-2, College Entrance Examination Board, New York.
Camara, W., and G. Echternacht. (2000). The SAT I and high school grades: Utility in predicting success in college. College Board Report, No. RN-10. New York, College Board.
Cohn, E., Cohn, S., Balch, D., and Bradley, J. (2004) Determinants of undergraduate GPAs: SAT scores, high-school GPA and high-school rank. Economics of Education Review, 23 (2004), 577-586. University of South Carolina, Columbia. Crouse, J.; Trusheim, D. The case against the SAT. Chicago and London, The University
of Press; 1988.
Dougherty, C., Mellor, L., & Jian, S. (2006). The relationship between advanced placement and college graduation. Austin, TX, National Center for Educational Accountability.
29 Elliott, R., and Strenta, A. C. (1988). Effects of improving the reliability of the GPA on prediction generally and on comparative predictions for gender and race particularly. Journal of Educational Measurement, 25(4), 333–347.
Geiser, S. & Studley, R. (2001). UC and the SAT: Predictive validity and differential impact of the SAT I and the SAT II at the University of California, Office of the President, University of California.
Geiser, S. & Studley, R. (2003). UC and the SAT: Predictive validity and differential impact of the SAT I and the SAT II at the University of California, Educational Assessment, 8 (1), 1-26.
Geiser, S., and M, Santelices. (2007). Validity of High-School Grades in Predicting Student Success Beyond the Freshman Year: High-School Record vs. Standardized Tests as Indicators of Fourth-Year College Outcomes. Research & Occasional Paper Series, CSHE.6.07. University of California, Berkeley.
Griesemer, N. (2009). Graduation rates should be key factors in college selection. Retrieved from www.examiner.com/collegeadmissions-in-washington-dc/graduation-rates-should-be-key-factors-college-selection.
Kanarek, E. A. (1989). Exploring the murky world of admissions predictions. Paper presented at the Annual Forum of the Association for Institutional Research, Baltimore, MD.
Lenning, O.T. (1975). Predictive validity of the ACT tests at selective colleges. Report No. 69 [050269000]. Iowa City, IA, American College Testing.
Leonard, D. K., and Jiang, J. (1995). Gender bias in the college predictions of the SAT. Paper presented at the Annual Meeting of American Educational Research Association and the National Council for Measurement in Education, San Francisco, CA.
Manski, C. F., and Wise, D. A. (1983). College choice in America. Cambridge, MA, Harvard University Press.
Morgan, R., & Ramist, L. (1998). “Advanced placement students in college: An investigation of course grades at 21 colleges (ETS Report No. SR-98-13) Princeton, NJ, Educational Testing Service.
Myers, R. S., & Pyles, M. R. (1992). “Relationships among high school grades, ACT test scores, and college grades”, Mid-South Educational Research Association (1992 Annual Meeting), Knoxville, TN.
Niu, S. X., & Tienda, M. (2013). “Test Scores, Class Rank and College Performance: Lessons for Broadening Access and Promoting Success”, Rass Ital Sociol. 2012 April 1; 2, 199-266. Doi, 10.1423/37519.
Noble, J., and Sawyer, R.(1987)“Predicting Grades in Specific College Freshman Courses from ACT Test Scores and Self-Reported High School Grades.” ACT Research Report Series 87-20.
Noble, J., and Sawyer, R.(2002) “ Predicting Different Levels of Academic Success in College Using High School GPA and ACT Composite Score.” ACT Research Report Series 2002-4.
Ramist, L. (1984). Predictive validity of the ATP tests. In T. F. Donlon (Ed.), “The College Board technical handbook for the Scholastic Aptitude Test and Achievement Tests “, (pp. 141–170). New York, College Entrance Examination Board.
Ramist, L., and Weiss, G. (1990). The predictive validity of the SAT, 1964 to 1988. In W. Willingham, C.
Lewis, R. Morgan, and L. Ramist (Eds.), Predicting college grades: An analysis of institutional trends over two decades. Princeton, NJ, Educational Testing Service, pp. 117–140.
Ramist, L., Lewis, C., and McCamley, L. (1990). Implications of using freshman GPA as the criterion for the predictive validity of the SAT, In W. W. Willingham, C. Lewis, R. Morgan, and L. Ramist (Eds.), Predicting college grades: An analysis of trends
over two decades. Princeton, NJ, Educational Testing Service, pp. 253–288. Ramist, L., Lewis, C., and McCamley-Jenkins, L. (1994). Student group differences in
predicting college grades: Sex, language, and ethnic group (College Board Report Number 93-1; ETS RR-94-27). New York, College Board.
Ramist, L., Lewis, C., and McCamley-Jenkins, L. (1994). Student group differences in predicting college grades: Sex, language, and ethnic group (College Board Report Number 93-1; ETS RR-94-27). New York, College Board.
Robinson, M., and J., Monks. (2004). Making SAT scores optional in selective college admissions: a case study. Economics of Education Review 24 (2005), 393-405, University of Richmond, VA.
Rose, H., &Bett, J. R. (2001). Math matters: The link between high school curriculum, college graduation, and earnings. San Francisco, Public Policy Institute of California.
31 Rothstein JM. College performance predictions and the SAT. Journal of Econometrics.
2004; 121(12), 297–317.
Sadler, P., and Tai, R. (2007). Weighting for Recognition: Accounting for Advanced Placement and Honors Courses When Calculating High School Grade Point Average.” NASSP Bulletin, Vol.91, No. 1, March 2007 5-32.
Sawyer, R. (2010) Usefulness of High School Average and ACT Scores in Making College Admission Decisions. ACT Research Report Series 2010-2.
Willingham, W. W. (1985). Success in college: The role of personal qualities and academic ability. New York, College Board.
Willingham, W. W., & Breland, H. M. (1982). Personal qualities and college admissions. New York, College Entrance Examination Board.
Willingham, W. W., & Morris, M. (1986). Four years later: A longitudinal study of advanced placement students in college, New York, College Board Publications. Willingham, W. W., Pollack, J., and Lewis, C. (2000). Grades and test scores: Accounting
for observed differences. (ETS RR-00-15). Princeton, NJ, Educational Testing Service.
Young, J. W. (1991a). Gender bias in predicting college academic performance. Journal of Educational Measurement 28, 37–47.
Young, J. W., and Barrett, C. A. (1992). Analyzing high school transcripts to improve prediction of college performance. Journal of College Admission 137, 25–29. Camara, W. J., Kobrin, J.L. and Milewski, G.B. (2002). The utility of SAT I and SAT II
for admissions decisions in California and the nation, College Board Research Report No.2002-6.