as a factor in information security policies. International Journal of
Trend in Research and Development. pp. 54-64. ISSN 2394-9333 ,
This version is available at https://strathprints.strath.ac.uk/63070/
Strathprints is designed to allow users to access the research output of the University of Strathclyde. Unless otherwise explicitly stated on the manuscript, Copyright © and Moral Rights for the papers on this site are retained by the individual authors and/or other copyright owners. Please check the manuscript for details of any other licences that may have been applied. You may not engage in further distribution of the material for any profitmaking activities or any commercial gain. You may freely distribute both the url (https://strathprints.strath.ac.uk/) and the content of this paper for research or private study, educational, or not-for-profit purposes without prior permission or charge.
Any correspondence concerning this service should be sent to the Strathprints administrator:
The Strathprints institutional repository (https://strathprints.strath.ac.uk) is a digital archive of University of Strathclyde research outputs. It has been developed to disseminate open access research outputs, expose data about those outputs, and enable the
ISSN: 2394-9333, www.ijtrd.com
Evaluating Readability as a Factor in Information
Security Policies
Yazeed Alkhurayyif
Department of Computer and Information Sciences University of Strathclyde
Glasgow, UK
George R S Weir
Department of Computer and Information Sciences University of Strathclyde
Glasgow, UK
Abstract— Researchers have designed a number of software readability metrics that evaluate how difficult a passage is to comprehend; yet, little is known about the impact of readability on the interpretation of information security policies (ISPs) and whether experiment of readability may prove to be a useful factor. This paper examines and compares eight ISP documents on nine mechanical readability formula results with outcomes from a human-based comprehension test. The primary focus is to identify if we might rely on a software readability measure for assessing the difficulty of a text document in the domain of Information Security Policies. Our results reveal that traditional readability metrics are ineffective in predicting the human estimation. Nevertheless, readability, as measured using a bespoke readability metric, may yield useful insight upon the likely difficulty that end-users face in comprehending an ISP document. Thereby, our study aims to provide a means to enhance the comprehensibility of ISPs.
Keywords— Readability; Readability formula; Readability metric; Comprehension test
I. INTRODUCTION
With advances in technology and the increase in its use across organisations, the demand to protect confidential information has become the requirement of the age [1]. Organisations should have security policies that include pertinent documentation to reflect local information security philosophy and commitment [2]. As Higgins [3] emphasises
“without a policy, security practices will be developed without clear demarcation of objectives and responsibility”. An effective ISP will not be achieved unless users are familiar with its content and comply with its requirements. Therefore, institutions must strive to achieve information security policy compliance via comprehensibility. In light of changing circumstances and technological progress, ISPs should be regularly enhanced and updated to maintain fit to the
institution‟s vision and mission, whilst always meeting the minimal requirement of comprehensibility.
Several factors enable compliance with regulations and rules of security and one of these is the comprehensibility of the ISP itself. In part, this can be estimated by applying a readability formula to the text of information security policies. Readability is a characterisation of how straightforwardly textual material can be read and understood and over the years many different readability formulae have been proposed. For example, McLaughlin [4] developed a readability formula as a mathematical equation influenced by regression analysis, which shows the relationship between two variables, a gauge of the difficulty experienced by individuals reading a given written material, and a measure of the linguistic characteristics
of that content. Such a formula can be utilised to estimate reading difficulty from the linguistic characteristics of the texts, but its effectiveness is dependent upon how well it matches the human ability to comprehend any text.
The rest of this paper is organised as follows. We outline relevant literature on readability, before detailing the methodology used in the study. This includes our selection of
eight sample policies, an experts‟ insight stage, focus group
interviews, development of comprehension tests, a pilot study and main study, before making a comparison of comprehension results against nine readability metrics. We present the data collection and analysis and discuss the results of the main readability metrics study. The final section provides concluding remarks, as well as noting limitations, and then offers suggestions for future work.
II. BACKGROUND
A. The Role and Importance of Information Security Policy Information security policies often form part of an
organisation‟s official regulatory framework. The role of the information security policy is to ensure that any decisions and actions are consonant with the objectives of an organisation. Most organisations now impose ISPs or „conditions of use‟ agreements upon their employees. The need to ensure that employees are informed and aware of their obligations toward information security is apparent. Less obvious is the correlation between the provision of such policies and their compliance. Although information security policies and procedures are routine in most organisations, many people ignore such precautions. One potential cause of such behaviour may be reduced if institutional ISPs are specific and clear to those who are required to comply with them.
Policies should be considered as rules or principles that users understand and follow. To this end, ISPs have to be expressed in a manner that is received as commonplace and an accepted as part of regular tasks [5]. Users are frequently identified as the key vulnerability in an organisation‟s information security profile and are often the main cause of security incidents. Höne and Eloff [6] believe that users ignore ISPs because they do not fully understand the policy. Hence, if users do not fully understand its content, a major factor in security incidents may be the security policy itself. Accordingly, authors responsible for writing an ISP should try to ensure that the information in the policy reaches its audience easily and effectively.
B. How to Make Successful ISPs
There is no obvious single approach to ISP design or content selection that is guaranteed to help an organisation accomplish its information security aims, but key among the
ISSN: 2394-9333, www.ijtrd.com
requirements is successfully clarifying the requirements and concepts of the information security policy to the users (op. cit.). Thereby, evaluating policy comprehensibility may assist in determining whether the ISP is likely to be effective. For instance, if the auditors of an ISP certify that controls and security measures are working sufficiently with the policy, this indicates a good fit between the policy and those charged with its application. Of course, in the contrary situation, insufficient controls and security measures may produce an ineffective policy [5].
Authors should consider the writing style and the way in which the ISP is presented to users. Höne and Eloff [6] suggest that the ISP document should be presented in beautiful and attractive style in order to catch the users‟ attention and ensure the desired objectives are delivered. Notably, organisations should not leave the documenting of ISPs to technical staff in isolation from others. Although they may have experience of information security technologies, this may not be matched by their experience of users‟ understanding and how IS may suit the broader organisational culture (op. cit.).
An ISP cannot be successful unless users are familiar with it. Consequently, institutions should strive to distribute the ISP efficiently and be open to address any issues related to the transparency of its content. Additionally, the ISP should be regularly enhanced and updated to ensure continued fit with
the institution‟s vision and mission. Another aspect of the required transparency is that ISP authors should consider the readability of their text, as this is fundamental to its comprehensibility and thereby its effective operation.
C. Gauging the Success or Effectiveness of ISPs
Some factors may minimise the efficacy of ISPs even before the ISP is introduced (proactive/prior factors) while other factors may minimise the efficacy after the ISP is in use (reactive/post factors). A list of relevant factors would include: readability of ISP documents, level of user awareness, ethical conduct policies, organisational culture, adoption of recognised standards, proportion of detecting viruses and unauthorised software, audit results, outcomes of users surveys, levels of user compliance, reducing lost productivity, reducing security incidents, level of user training, consistency in enforcement of ISPs and standards, senior management commitment to IS initiatives, appropriate employee education and awareness on information asset protection, achieve ISPs target within available budget, balance of effort between achieving short-term goals with anticipating long-term targets,
extent of alignment of ISPs with the organisation‟s objectives
and cost justification for IS [7]–[10].
The present article focuses on evaluating the effect of readability on the interpretation of ISPs and considers experimentally whether readability measurement may prove to be a useful factor. The ease of reading information security policy documents is a “proactive factor”. Investigating the readability of ISPs may help in complying with regulations and rules of security, which result in increased effectiveness of information security policies. In principle, this may be achieved by testing documents using software readability formulae and/or testing human readers using comprehension tests. Readability formulae may help in assessing the clarity of information security policies and could offer an easy means for an organisation to gauge their own policy through self-assessment [11]. Unlike other measures, readability metrics can assist in improving the inherent properties of information security policies, i.e., their textual content and comprehensibility. The supposition is that whenever the policy
is not fully understood or the text‟s content is hard to read,
then the policy will not readily be used or will be used insufficiently [5], [12]. Ideally, institutions need to make certain that their security policies can be understood by all employees regardless of their level of education.
Whenever a document is intended to be presented to any group of people, readability or reading ease formulae may be employed to estimate the level of the document and gauge how straightforward it is to comprehend the text. A readability index is evaluated by using statistical text analysis. Traditional readability formulae are commonly based on quantifiable textual aspects such as length of words, the length of sentences, and a number of syllables or differences between these constructs [13]. However, according to Gray and Leary [14], there are more than 220 factors that can affect readability. They classified the factors into four groups (Content, Style, Format, and Features of Organisation). An ideal readability metric would take many variables into account. However, in reality, this may be problematic if some factors prove intractable to easy measurement. Readability formulae usually return an approximation of a text‟s difficulty. This is often expressed as a grade level, i.e., the years of education study required to be capable of understanding the text [15].
D. Readability Metrics
There are over 200 readability metrics but in this paper, we will describe eight of the most common traditional readability formulae, as well as the Strathclyde Readability Measure (SRM) - developed at our institution as a „new generation‟ of readability metric. The readability metrics described in this article were used in analysing a set of eight sample policies. Before considering the results of these measures, we will outline the characteristics of the metrics.
1) Flesch Reading Ease and Flesch-Kincaid formula The Flesch Reading Ease (FRE) formula is probably the earliest readability metric and one of the most commonly used. This was published in 1948 by Rudolph Flesch and is based on the number of syllables and the number of sentences for each 100-word block of text [16]. The results of this formula are calculated on a scale of 1 to 100, with less than 30 being text that is very complicated to understand and with greater than 90 being text that is very easy to understand [5].
A modified version of the FRE formula called Flesch-Kincaid Grade Level (FKGL), was developed later (1975) by J. Peter Kincaid and other readability scientists assigned by the United States Navy. Both formula versions are based on the same core measures (word length and sentence length); however, they have different weighting factors that result in different readability scores [5], [15], [17].
Despite its popularity, in terms of common usage, the FRE has several recognised weaknesses arising from the selected readability factors. A principal concern is the sole reliance on
„internal‟ characteristics of the considered texts. Nevertheless, Crossley and others [18] state that the FRE formula created higher inter-correlations compared with the Automated Readability Index and the Gunning Fog Index Readability (FOG) formula [5], [15], [17].
2) Gunning Fog Index (FI)
This readability formula is another well-known traditional readability metric, developed in 1952 by Robert Gunning, and it is similar to FKGL except that it counts the percentage of words with more than two syllables instead of counting all of the syllables in a word. In addition, the Gunning Fog Index was created specifically for adult level materials and became
ISSN: 2394-9333, www.ijtrd.com
popular because it is user-friendly. The Gunning Fog Index maps directly to educational grade-level [15], [19]–[21].
This formula has some limitations due to its function of counting the percentage of words with more than two syllables. Not all words with three or more syllables can be considered as difficult. There are also words with less than three syllables that would be considered difficult, especially if rarely used by most people. For example, the word “January” has four syllables and is not thought to be a difficult word (op. cit.).
3) Spache formula
The Spache formula is another traditional readability measure, developed in 1953 by George Spache. To revise the formula, another version was published in 1978. This measure uses two variables, sentence length and number of unfamiliar words (n = 769) [21]–[24].
The Spache readability index is similar to the Dale–Chall readability index, and utilises a list of familiar words. The Spache metric performs best on text documents that are intended for children up to fourth grade. For older children, it is recommended to use the new Dale–Chall index, as it is more appropriate than the Spache readability index (op. cit.).
Despite its popularity, in terms of common usage for primary school students, the Spache index has been criticised for its poor reliability. Researchers argue that the Spache
formula‟s set of familiar words have some discrepancies [21], [25].
4) Dale–Chall (DC) Readability formula
The original Dale–Chall index is another commonly used readability measure, created in 1948 by Edgar Dale and Jeanne Chall. This formula is similar to the Flesch reading formula in a sense that it uses two variables, average sentence length and a percentage of difficult words. However, it was designed to overcome some flaws of the FRE formula (i.e., affix counts and personal references contained within an earlier version of the FRE metric) by assessing word complexity based on a large list of frequent words (n = 3000), at least 80 percent of which are familiar to fourth-grade students [15], [17]–[19], [26].
The formula has been improved by including an updated list of familiar words in 1995 and called the new Dale-Chall formula. The new Dale-Chall metric has considered many readability research findings in the almost half century since the original development and obviously has greater predictive power than the initial formula (op. cit.).
In spite of its popularity, with regard to common usage, the Dale–Chall Readability formula has various criticisms as the formula‟s output depends heavily on the frequent words list. First, vocabulary can change quite rapidly and different social and ethnic groups of people have different core vocabularies. Second, neither version of the Dale-Chall formula was created for measuring technical materials so it is questionable whether this formula gives an accurate score for technical and legal documents. In addition,, the developers of the Dale-Chall metric did not aim to provide any theoretical insight into readability [17], [26].
5) SMOG formula
The SMOG index is widely used and one of the simplest and fastest metrics to compute. The formula was introduced firstly in 1925, and it was reviewed in 1950 and again in 1969 by G.H. McLaughlin. The idea of this formula is based on that semantic and syntactic difficulty predictors should be multiplied rather than added. The SMOG metric uses only one core measure, rather than two as in FRE, FI, and DC formulae,
which is the number of polysyllabic words (three or more syllables) in 30 sentences. The SMOG index returns grade level scores [15], [17], [19], [20].
Despite its simplicity, the SMOG formula has been criticised. In terms of accuracy, the SMOG metric to some extent is less accurate than other classic readability formulae as the formula publisher stated that his metric would predict grade level within 1.5 grades 68% of the time [17], [20]. Furthermore, the main focus of this formula, which is the sole
reliance on „internal‟ characteristics of the considered texts, is not that different from the other traditional formulae we have mentioned so far.
6) Coleman-Liau formula
The Coleman-Liau index (CLI) is less commonly used than the other mentioned earlier formulae. Devised in 1975 by Meri Coleman and T. L. Liau, this formula is unlike other traditional readability metrics as it based on characters instead of syllables per word. The opinion of the formula‟s developers is that a readability formula lacked accuracy if its techniques relied on the number of syllables per word or sentence length [20], [27].
The Coleman-Liau formula maps directly to the grade-level required to understand the text. It is worth mentioning that some researchers have noted that the Coleman-Liau index generates scores lower than the FRE formula when applied to technical documentation.
Although Meri Coleman and T. L. Liau argued that their formula is more accurate than other traditional readability formulae, there is a clear weakness in all traditional readability formulae as mentioned earlier, since their account relies on
„internal‟ characteristics of the considered texts. 7) Automated Readability Index (ARI)
This formula is another traditional readability formula for testing English language texts, published in 1967 by Smith and Senter, in an attempt to evaluate the readability of written documents used by the US Air Force. This formula is similar to the Coleman-Liau formula, in term of core measurement, they use same variable (characters instead of syllables per word) and return grade level scores [20], [28], [29].
The Automated Readability Index and other traditional readability formulae have been criticised as flawed, principally for their reliance on „internal‟ characteristics of the considered text documents [1], [15], [17], [20], [21].
8) Strathclyde Readability Formula
Of the available formulae for evaluating the readability of text, we adopted the Strathclyde Readability Measure (SRM) as it differs in approach from most other readability measures. Traditional readability metrics often depend for measurement on counting syllables, characters per word, words, and sentences only, but SRM differs in taking into account the frequency of occurrence of words, relative to the British National Corpus [15]. Instead of average sentence length (ASL), the SRM employs a constant based on ASL, in order to obtain scores that are closely associated when texts are similar in difficulty but different in ASL. The SRM provides two versions. SRM1 is designed for texts that have more than 150 words while SRM2 is suitable for texts with less than 150 words. The effects of this formula are measured on a 100 scale, with less than 30 reflecting complicated text and greater than 80 reflecting easy to read text (op. cit.).
E. Comprehension Test
Many test types seek to measure understanding. The Cloze test is a method for gauging reading comprehension. Richards
ISSN: 2394-9333, www.ijtrd.com
and Schmidt [30] explain that reading is the process of perceiving a text for the purpose of understanding its content. There is a possibility of achieving this silently, which is called silent reading. The understanding that results, is described as reading comprehension. The Cloze test is well known, especially for testing language abilities. This test includes a text with a number of deleted or removed words from a reading passage, where the test taker is required to fill in the missing words. The test designer usually chooses one of two techniques to create the blanks. The first is called rational deletion (rational Cloze), where the test creator decides which words are deleted based on some rational principle. The second technique is known as fixed ratio deletion or nth word deletion, where every nth word is removed systematically. Thus, the test taker is required to construct meaning from the passage by identifying the missing words [30], [31]. As will be indicated below, we employed a Cloze test as a means of gauging comprehension within our experimental process.
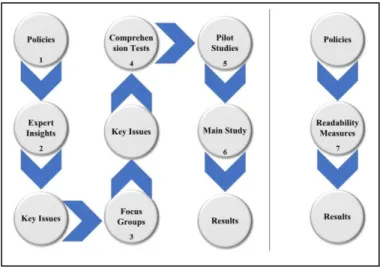
III. RESEARCH DESIGN
This research was conducted in seven phases to achieve the study objectives. These phases are represented in Fig. 1.
Phase1: In the first phase, eight IS policies were selected (from a larger set of thirty-five policies) to examine their readability by programmatic means and human comprehension tests. The chosen policies are a mix of public and private sectors (academia and industry). Five of the ISPs are universities, and the others are telecom organisations, in order to add a further comparative dimension and determine whether these sectors are similar.
Phase2: In the second phase of this work, without the use of pre-determined inquiries, experts were asked for their insights on those policy ingredients that they considered key. There are various well-known techniques for gathering expert insight and our strategy was to adopt an easy but effective method [32]. In this context, the expert is someone who has worked with policies for at least 15 years. Seventeen responses were received from this experts group. The aim was
to benefit from the experts‟ professional experience in
identifying and clarifying salient points relevant to information security policy documents.
Achieving confidence in this step was considered vital, as the perspectives of the experts would later be the basis for determining how well the documents convey these points to less experienced computer literate users.
Fig. 1. Research Methodology Steps
Phase3: In Phase, we conducted focus group interviews to confirm the expert insight. A number of selected participants in an informal meeting were asked to express their opinions on the most salient statements from a number of chosen policies. Focus group discussion has a number of valuable features including 1) it can enable comprehensive discussions and involve a small number of participants, 2) it concentrates on a precise area of interest and enables people to discuss an issue in depth, 3) it sparks interactions between participants that are likely to enhance discussion and insight [33]. In addition, focus groups can be used in combination with another method to clarify and evaluate research findings [34]. For these reasons, focus groups were used to validate the views expressed by the computer experts in the previous stage. Thereby, we have adopted a mixed method approach to determine the validity of the result before proceeding to the following step.
The perfect size of focus group discussion is a contentious subject. The size of the focus group was determined as between five to eight and the discussion time between 60 to 90 minutes. In order to make certain that participants have the opportunity to share their views without getting bored with the process. This decision follows Krueger and Casey [35].
Eleven people (professional computer users, who have used computers for more than six years), who expressed an interest in the case study, were invited to participate in a 90-minute discussion. This approach similar to the focus group meetings described by [36], [37]. Following on from this constructive dialogue, the focus group interviews revealed several key insights associated with the discussed topic. The results include 1) determining the salient points for each policy, 2) insight on the extent of comprehension and ease of reading for a number of the procedures contained in the policies, 3) indication of which policy of the set was most complicated, and which was the easiest policy to understand, 4) highlighting the variation between policies with respect to the aspects they covered.
Phase4: The fourth phase focused on developing comprehension tests (Cloze tests). Following [30], [38]–[42], these Cloze tests are key to determining the comprehensibility of policy components and underpin the pilot study.
As noted, several readability formulae have been explored in the literature as a basis for gauging the readability of written material, but invariably depend upon syntactic variables [15], [16], [18], [21], [43], [44]. Readability metrics have several limitations, including 1- they generally focus on purely internal characteristics of the considered texts and ignore the likely familiarity or unfamiliarity of the terms found therein [45], 2- They are generally insensitive to whether the texts are meaningful or senseless, 3- there is variation in the results of readability metrics for the same content, 4- readability formulae assume that people are similar in characteristics, maturity and skills [15].
For such reasons, adopting a Cloze test - a human based comprehension test - ensures that judgment of readability is not determined solely on a mechanical basis. In addition, Kobayashi [31] emphasises that there is a high correlation between readability metric scores and comprehension test results. Part of our objective is to compare the use of a software readability approach with human comprehension tests as a basis for insight on the readability of ISP documents. This should shed light on whether the readability factor may influence the efficacy of ISPs.
Phase5: In this Phase, as a pilot study, a number of Cloze tests were evaluated prior to the full-scale study. As noted by
ISSN: 2394-9333, www.ijtrd.com
Connelly [46], the main aim of performing a pilot study is to field test logistical characteristics of the upcoming study and to include these aspects of the survey design.
This step is essential and beneficial in establishing the groundwork in a research study and can save considerable effort, time, and money by identifying potential issues and inadequacies in the examination instruments before embarking on the primary study [47].
Phase6: The sixth phase is the main component of the research. Self-administered questionnaires were created by the popular Qualtrics platform and widely distributed. The survey method is an ideal instrument for the main study phase as it can address a large number of samples in a short time, it is also cheaper than other methods such as telephone interviews or focus groups interviews [48].
A review of the literature concerning valid and reliable sample size found that scientists suggest the minimum number of sample is 200 respondents and the most suitable size is 384 survey questionnaires [49], [50]. A total of 600 people participated in the study. Responses from two hundred and four respondents were later withdrawn on validity issues. The remaining data of three hundred and ninety-six subjects were entered into the Statistical Package for Social Sciences (SPSS) program for analysis.
Phase7: The final phase, compared the comprehension outcomes against readability metrics to identify the degree of similarity and difference between the results of human and software metrics.
IV. MAIN STUDY
A. Aims
The aim of performing the main study was to use a quantitative, closed-ended, questionnaire instrument to determine the efficacy of ISPs by applying readability metrics as an indicator of policy comprehensibility. The survey
respondents‟ data were then analysed to be compared with
results of nine automated readability formulae.
The intent of the main study was to find an answer to one of our research questions, which was as follows:
RQ. Does readability, as gauged by software metrics, accurately reflect the comprehensibility of ISPs? If so, how?
B. Participants
The participants for this study were local students and international students in the United Kingdom. According to UKCISA [51], the total population of international students in the UK was 436,585 in 2015. The total number of survey responses was 600. One hundred and ninety-nine respondents only partially completed the questionnaire. Four hundred and one participants answered all survey questions but five
respondents gave a wrong answer to the „red herring‟
question. The red herring question or “trap” question is a simple question with an obvious answer, which is one of the methods to validate survey responses and discover respondents who were not engaged with the questionnaire. For survey validity, the incomplete survey and participants with the wrong answer for the red herring question were withdrawn. The remaining respondents (three hundred and ninety-six) were used for data analysis.
Participants (international students in the UK) were from a wide variety of countries including countries with English as an official language and the language of instruction in higher education. These included Australia, Canada, Kenya, Malta,
Nigeria, South Africa, Tanzania, and the United States of America.
Participation in the study was on a voluntary basis. Each participant enrolled randomly in one of the four blocks to answer two Cloze tests (see procedure section for more details). The completed survey of three hundred and ninety-six subjects were entered into the Statistical Package for Social Sciences (SPSS) program for analysis.
C. Materials
The study utilised eight out of a considered set of thirty-five policies as material for the research. These policies were a mix of public and private sectors (academia and industry). The materials were carefully selected based on a number of factors. Firstly, policies had to be from countries where English is the mother tongue. Next, the policies should be also from a variety of geographical locations, accessible online and of similar word count (no more than 10% difference). Finally, University policies were chosen from top universities of 2015 - according to Quacquarelli Symonds (QS).
Since there were eight policies, it was a challenging task to distribute text materials to potential participants. There were two options to distribute the materials. The first option was to have participants answer questions on the eight documents. On the one hand, this option does not need many respondents and requires the shortest time for questionnaire process. For instance, this would gain 100 data for each policy from 100 participants. On the other hand, due to the length of time required for each participant to answer the whole survey for eight policies, this option would dramatically affect the willingness of participants to read the text documents and subsequently answer the Cloze tests.
We considered a second option in which each participant is required to address only one of the eight text materials. This would require more respondents to participate and complete the entire survey, which in turn means more attention paid to reading and answering the Cloze test questions. This option required less time for participants to answer the whole survey, but, in comparison with the first option, required more participants overall. For example, if 50 participants only contribute for the first text document, while the second text only receives 30 responses, to acquire 100 data per text, 800 participants would be required.
To avoid these extremes, a middle ground between these two options was selected. Two text documents out of the eight were randomly allocated to each participant. The survey was devised and deployed using the Qualtrics survey platform [52], which has a feature of evenly distributing two of the eight ISPs texts to the survey participants so there would be a control on the allocation of text materials (i.e., each would be seen an even number of times). This option needed less time than the first option for respondents to complete the entire survey. In addition, it should positively reflect the number of participants as well as the attention paid to answering the survey. Compared with the first and second options, 400 respondents each addressed two documents to obtain 100 participations for each text.
As noted, a number of passages from the eight (8) policies were suggested by IT experts and the role of the focus group was to choose the 10 most salient statements from the points proposed by the experts. The proposed statements were given to a small number of participants in order to obtain valuable feedback prior to proceeding to the main study. The reading
passages were used for assessing the survey takers‟
ISSN: 2394-9333, www.ijtrd.com
slightly changed from the second pilot study. The survey was finalised with some enhancement and improvement, such as adding two extra questions to distinguish between respondents in term of English language experience and nationality, changing the online survey service provider to Qualtrics to improve usability and to benefit from Qualtrics‟ characteristics, and increase the response rate by asking participants to answer two instead of four Cloze tests.
It is worth mentioning that this research used rational deletion (rational Cloze) rather than fixed ratio deletion since
the main concern was to focus on „key‟ components in the
meaning of the sentences. Choosing a fixed ratio „nth word‟ approach might select function words or other less significant aspects and fail to cover important aspects of content. For this reason, the decision was taken to avoid deleting proper nouns and numbers. An example of rational Cloze from one of the chosen policies is shown below.
Unlawful file sharing using the University‟s information resources is a _____ of copyrights and _____ policy.
In this study, words chosen to be „missing words‟ were
always considered significant in their contribution to the meaning of the phrase in which they appeared. This was the basis for the rational decision approach adopted in creating our Cloze items.
In response to the respondents‟ feedback from the
preliminary pilot study, the number of items for the Cloze test
was set at 10, one item per ISP‟s statement. Therefore, the total score is 10 for each Cloze test. Overall, the reading material contained 80 items (10 blanks for each of 8 ISPs). After completion of the full set of tests, all of the filled gaps were analysed and examined.
D. Procedures
Prior to the main study, two pilot studies were performed and analysed. This allowed for identifying the key elements that should be addressed in the main study. The main survey
design took into consideration a number of scholars‟
suggestions [53]–[55] in order to increase the response rate, reduce measurement errors and obtain more accurate and usable data. The adopted suggestions were (a) utilising suitable language level, (b) avoiding obvious typographical or syntactical errors, (c) creating a simple, short and interesting survey (a well-formatted questionnaire), (d) starting the survey with a cover letter that shows an overview of the questionnaire, (e) carefully designing a survey and (f) sending a reminder notification. In addition, the researcher took into consideration the suggestions from De Leeuw et al [56] for designing effective survey questions, including: (1) asking the right survey questions, (2) asking questions that are consistently comprehended, (3) participants can be able to retrieve information (usually from memory) required to answer survey questions, (4) questions have to be specific in order to obtain an appropriate response and (5) try to avoid as much as possible undesirable questions to get more literally accurate answers. Thereby, the researcher endeavoured to make questions straightforward, clear and easy to answer, questions can be retrieved by participants (consistently understood), and avoiding sensitive personal questions to obtain more accurate answers. In addition to that, the survey designer introduced two prizes to be awarded in order to obtain more responses as currently, many surveys are distributed and people need incentives to participate.
In the Cloze test main study, all eight of the chosen information security policies were used. The policies were anonymised to prevent any biasing influences on the
participant‟s responses. Because it was impractical for each
respondent to take all eight Cloze tests, the eight ISPs were divided into four blocks. Each block was divided into four sections: starting with instruction and general information about the study, then eight demographic questions (multiple-choice questions with single answers), and then, two Cloze tests (multiple-choice questions with single answers). At the end, there was an option for the respondent to provide their email, for those who wanted to be included in a prize draw. Although there was no time limit set for survey completion, according to the online survey software tool (Qualtrics), the questionnaire could be completed in 10 minutes. After receiving a sufficient number of respondents, all of the responses were marked and analysed.
These comprehension tests gauged the participants‟ reading comprehension, which would be compared later with readability formula results in order to address whether the readability has an impact on understanding information security policies. The mean scores of human comprehension test results are indicative of reading comprehension. The significance level was chosen at P < .05.
E. Data Collection
The main study survey was devised and deployed using the Qualtrics survey platform [52]. Despite the fact that the Qualtrics software tool was not designed specifically for creating online Cloze tests, Qualtrics was adopted because it could meet our requirements for creating the Cloze test question structure and had many features, such as sample management, user-friendly interface, storage of data, and options for survey layout and question forms. In addition, the Qualtrics platform had other useful and unique features (e.g. Survey Flow and Block Randomisation features). The survey designer was able to create four blocks for the eight selected ISPs (two policies per block) and ensure that the four blocks would be evenly distributed to the survey participants so there would be a control to ensure that the blocks would be seen an equal number of times. Qualtrics exports participants‟ answers into most commonly used statistical formats such as the Statistical Package for Social Sciences (SPSS).
Various methods have been adopted for distributing the online survey, including email correspondence (including mass mailing to all Strathclyde international students), posting on social media (e.g., Facebook, Twitter), messaging on cross-platform messaging apps (e.g., WhatsApp, Line) and distributing flyers (contains survey URL and QR Code). The purpose and details of the study were highlighted in the invitation letter. The invitation detailed methods of communication with the questionnaire designer. In addition, it stated clearly that participation was voluntary, with no obligation to take part. A participant could withdraw from part or all of the study at any time without consequence.
F. Data Analysis
When all the responses were received, they were first sorted into four categories according to the task answered, i.e., group1 for the task containing policies one and two, group2 for the task containing policies three and four, and so on. Each group received an almost equal number of responses (between 94-104 responses). The respondents‟ academic qualification, gender, age, nationality, study subject, computer experience and English proficiency were captured. All answers were reviewed and verified at least twice before being imported into the results database for subsequent statistical analysis, using the SPSS/PC statistical package. A t-test and one-way ANOVA test was performed to determine which factors had significant effects on reading comprehension.
ISSN: 2394-9333, www.ijtrd.com
The result of the main study survey and the software readability formulae results are addressed below in section V.
V. RESULTS
At the time of the questionnaire, there was a total of 600 people enrolled and as a result, a sample of 396 usable responses was collected. For survey validity, incomplete participations or complete participations but not giving the correct answer to the red herring question were discarded and not considered.
A. Demographics
Respondents for the main study were secondary education, post-secondary education and postgraduate education students, local students and international students, in the United Kingdom. A summary of the results of the survey is now presented, utilising tables and a commentary on the various findings.
B. Overview of the Examined Policies Results
The survey‟s policies were compiled with details that
include mean, standard deviation and the number of respondents, as shown in Table I. To clarify policy scores, the minimum possible score was zero and the maximum possible score was 10. The total average value was out of 10.
As per the table presentation, there were variations in the total numbers of responses in the four groups (despite the Qualtrics survey platform having evenly assigned potential participants to one of the four groups). This could happen if a participant did not complete the survey or they failed in answering the red herring question so their participations were withdrawn. A block contained two policies and for each policy included ten statements. In general, the reading material contained 80 items, 10 blanks for each of the eight ISPs. Because of this division, it can be noticed that policy A and B, policy C and D, policy E and F, policy G and H had the same number of responders (Table I).
All in all, the insight drawn from Table I was that the responder numbers ranged from 94 to 104. The table shows a wide range of mean value in the examined ISPs, beginning with 5.0581 and ending with 7.9208. The standard deviation range between policies was convergent, starting from 2.20493 up to 2.65017. All policies had responders with minimum and maximum possible score, but policy B had the largest number of responders with a minimum score (by five in number), whereas policy G had the largest number of responders with a maximum possible score by 47 participations.
Notably, the results showed that participants‟ performance
in policy D and policy C were somewhat low (an average of slightly less than six correct answers out of ten). This showed that policy D, as represented by the considered extracts, was the hardest policy to understand for the human reader (which matched the pilot study outcomes). In contrast, policy E was the easiest to comprehend for respondents. Aside from this, all policies gained more than 5 out of 10 in mean score, which means that the respondents (N=396) on average correctly
answered more than half of the Cloze tests‟ items.
TABLE I. OVERVIEW OF THE EXAMINED POLICIES RESULTS BY
HUMAN PERSPECTIVE Policy A Policy B Policy C Policy D Participants’ count 97 97 94 94 Meana 6.5052 6.2165 5.9043 5.0851 Std. Deviation 2.65017 2.44620 2.20493 2.60545 Policy E Policy F Policy G Policy H Participants’ count 104 104 101 101 Meana 7.0962 6.0577 7.9208 7.1584 Std. Deviation 2.49473 2.84836 2.57559 2.44431 a.
The mean is out of 10.
C. Participants’ Results VS Traditional Readability Index’s Outcomes
This study selected eight of the most common readability formulae to be compared with human results of Cloze tests. Taking into consideration DuBay‟s [16] suggestions of using other methods in conjunction with readability formulae, the eight selected policies were ranked twice, based on
participants‟ performance of Cloze tests, and based on a software readability formula perspective (as shown in Table II).
The eight chosen readability metrics are as follows, Flesch Reading Ease, Flesch-Kincaid Grade level, Gunning Fog Index, Spache, new Dale-Chall, SMOG, Coleman-Liau and Automated Readability Index. The scores of the eight formulae were obtained from a website called readable.io. Among the websites that offered readability scores, this was the only one that supported all eight formulae. It is worth mentioning that the Spache readability formula was discarded as it performs best on text documents that are for children up to fourth grade, while our selected ISPs documents were written for people who are older than the elementary level of education. Notably, the analysis of ISPs was not based on some samples of text, but on the entire text document that was accessible to be analysed.
The ordinal structure of the rank is simple and clear, as one (1) indicates the hardest text in the set and eight (8) indicates the easiest text in that set of texts. To clarify Table II, there are three types of cell. If the cells of „Rank‟ columns are shaded, this indicates that the measure was close to the human rating. Unshaded cells mean that the measure rated the text difficulty as the same as the participants‟ rating and triple lined borders on a cell indicate a significant distance from the human rating of the text.
TABLE II. COMPARISON OF HUMAN RESULTS &TRADITIONAL
FORMULAE RESULTS
In terms of the Flesch Reading Ease (FRE) measurement
category, all examined policies‟ texts were considered as very difficult to read (college graduate level) except for two texts considered as difficult to read (college level). In terms of the comparison with the human ranking, the majority of text
ISSN: 2394-9333, www.ijtrd.com
documents‟ results (six out of eight policies) were close to the
human ranking with two texts indicated as the significant distance from the human rating of the text.
For the new Dale-Chall index (New DC) tool, the surveyed documents were categorised variously between seventh or eighth grade, ninth or tenth grade, and eleventh or twelfth grade (based on the USA education system). In comparison with the human ranking, all policy document results were close to the participants‟ rating except for one document, which indicated a significant distance from the human rating of the text.
In terms of the Gunning Fog formula (Fog), all of the text documents were measured as too complex for most humans to read. The reading levels ranged from college junior to postgraduate level. In terms of comparison with human ranking, four ISP texts registered as close to the respondents‟ ranking, two documents were identical to the human ranking and two policies emerged with a significant distance from their human ratings.
For the SMOG index tool, all of the examined ISPs texts were considered as very difficult to read. The reading levels of the documents were categorised as college junior up to postgraduate level. In comparison with the human ranking, the majority of document results (five out of eight policies) were close to the human ranking, two texts indicated a significant distance from the human rating of the text, and for one document the participants and SMOG tool gave the same rating.
For the Coleman-Liau formula, the reading level measurement varied between high school senior up to college graduate. It is suggested that the reading level of any text should be eighth grade or lower in order to be „generally readable‟. In terms of the comparison with human ranking, half of the chosen policies were close to the human rating. In addition, two of the text documents received the same rating
as the respondents‟ rating while two policies showed a significant distance from their human rating.
For the Automated Readability Index, the surveyed documents were rated between twelfth grade up to postgraduate level. In comparison with the human ranking,
half of the examined policies‟ texts had the same rate as the participants‟ rating. Moreover, three of the text documents were close to the participants‟ rating, whereas, only one
document indicated a significant distance from the human rating for the text.
All in all, the results across the different measures revealed that none of the selected traditional formulae give identical scores nor do they match the human rating. The differences in rating the same piece of text are not surprising given previous studies [20], [57]. Furthermore, the analysis showed that most of the surveyed policies considered as fairly difficult to read by traditional readability formulae, were also found difficult by native English readers. It is worth keeping in mind that these ISPs documents are intended for both native and non-native English speakers. Therefore, we speculate that these results were due to the many policy designers do not take into account ease of comprehension when they write ISP documents.
D. Participants’ Results VS SRM1 Outcomes
As discussed earlier, survey contributors were assigned two Cloze tests and the content of the tests was taken from two policies. This study examines and compares eight ISP text
documents on nine mechanical readability formulae‟s results
with a human based comprehension test outcomes. The last
formula to be examined and compared with our selections of text documents is the new measure of readability formula (Strathclyde Readability Measure). For our experiment, we used the Strathclyde Readability Measure (SRM1), as it is intended for text samples of more than 150 words. The following equation [43] gives the SRM1 score:
SRM1= { log (AWF x 2) x k } – 80 Where:
AWF = the average word frequency, only calculating words with a frequency not more than 100,000.
K = a constant depends on the average sentence length (ASL)
15: if the ASL is larger than or equal to 17 and less than 25, or the ASL is under 17 and the AWF is larger than 95000.
13: if the ASL < 17 or > = 25.
The effects of this formula are measured on a 100 scale, with less than 30 reflecting complicated text and greater than 80 reflecting easy to read a text. Generally, the range of Strathclyde Readability Measure differs from the Flesch Reading Ease formula in estimating readability (refer to Table III).
Here, the rank indicates the relative text difficulty, with a rank of one (1) indicating the hardest text and a rank of eight (8) indicating the easiest text (Table IV). The cells of „Rank‟ columns are shaded or unshaded. Unshaded cells mean that the readability measure ranked the text the same as the
participants‟ rate, whereas, shaded cells indicate that the measure was close to the human rating. Notably, the policies‟ mean value was presented out of 10; while, the maximum scale of policies was 100. In addition, the analysis of ISPs was not based on ISP text extracts, but on the entire text documents.
TABLE III. ESTIMATE OF READABILITY ON THE FRE AND SRM SCALE
(SEE [5], [16])
FRE Scale SRM Scale
Mark Readability Category Mark Readability Category
0-20 Very Confusing < 30 Very Confusing 30-49 Difficult 30-40 Difficult 50-59 Fairly difficult 40-50 Fairly difficult 60-69 Standard 50-65 Standard 70-79 Fairly easy 65-80 Easy 80-89 Easy > 80 Very easy 90-100 Very easy
TABLE IV. COMPARISON OF HUMAN RESULTS &SRM 1RESULTS
Text Human Mean Rank SRM1 Scale Human SRM1 Policy D 5.0851 1 1 40.44 Policy C 5.9043 2 2 42.65 Policy F 6.0577 3 3 43.39 Policy B 6.2165 4 4 43.77 Policy A 6.5052 5 5 46.15 Policy E 7.0962 6 7 62.46 Policy H 7.1584 7 6 61.63 Policy G 7.9208 8 8 63.77
Considering the Strathclyde Readability Measure (SRM) results, two-thirds of the surveyed policies were considered
ISSN: 2394-9333, www.ijtrd.com
fairly difficult. We speculate that these results suggest that many policy designers do not consider ease of comprehension when writing ISP documents.
The results, shown in Table IV, reveal remarkable findings. The majority of texts‟ results were identical in human ranking and the SRM. In other words, six out of eight policies gained the same rating in both measurements. In addition, the findings indicated some similarity in ranking,
which the SRM application considers as „close rating‟, as can
be seen for Policy E and Policy H.
The SRM tool did not show any significant distance from the humans rating of the documents. Thereby, we confirm that there were correlations between this software readability
formulas‟ results and human comprehension test results, and this strongly supports our view that the readability factor influences the understanding of ISPs. In addition, difficulty in reading such documents may contribute to user non-compliance with ISPs.
Furthermore, these results suggest that an application such as SRM, may be used in evaluating the readability of a text as it differs in approach from most other readability measures and is the closest approach to estimate human reader comprehension and affords a practical alternative to Cloze-based comprehension tests.
E. Effects of Demographic Elements on Reading Comprehension
An Independent Samples t-test was applied to consider whether there was an effect of gender and language competence on reading comprehension. This indicated that both of them had a significant positive association with reading comprehension. Moreover, a oneway ANOVA test
-„f‟ test - has been performed to consider whether there was an effect of years for studying English language, age, academic qualification, computer experience level, study subject, and nationality on reading comprehension. This indicated that studying English language, age, academic qualification and computer experience level all had a significant positive association with reading comprehension, whereas, study subject, and nationality had no significant positive association with reading comprehension.
VI. DISCUSSION
The ambition of setting up an effective ISP will not be achieved unless users are able to easily become familiar with its content and comply with its requirements. M. Alotaibi and others [58] echo the view that non-compliance with ISPs is one of the significant difficulties confronting institutions. Several factors enable compliance with regulations and rules of security and one of these is the comprehensibility of the ISP itself. Therefore, institutions should strive to achieve information security policy compliance via comprehensibility. In part, this can be estimated by applying a readability formula to the text of information security policies.
This study set out to assess the impact of the readability factor on the success or effective operation of information security policies. Currently, there is no ready mechanism for estimating the likely efficacy of such policies across an organisation. One factor that has a plausible impact upon the comprehensibility of policies is their readability. The aim of this study was to investigate the effectiveness of applying readability metrics as an indicator of likely policy comprehensibility.
This study has shown that participants‟ performance in
policy D and policy C was somewhat low (an average of
slightly less than six correct answers out of ten). This showed that policy D, as represented by the considered extracts, was the hardest policy to understand for the human reader. In contrast, policy E was the easiest to comprehend for respondents. Despite this, all of the policies gained more than 5 out of 10 in mean score, which indicates that respondents (N=396) on average answered correctly more than half of the Cloze test items.
Our results across the traditional readability measures revealed that none of the selected traditional formulae give identical scores nor match human rating. The differences in rating the same piece of text are not surprising given previous studies [20], [26]. The aforementioned comparison between the Strathclyde readability results and human comprehension
test results revealed that the majority of texts‟ results were
matched in human ranking and SRM. In other words, six out of eight policies gained the same rating in both measurements. The SRM tool did not show any significant distance from the human rating of the documents (the SRM application
considers as „significant distance‟ if there were three levels difference between user rating and SRM rating). Thereby, we confirm correlations between the SRM formula results and human comprehension test results, and this supports our view that the readability factor has an influence on understanding ISPs.
All in all, the insight drawn from the analysis shows that the results of the selected automated readability formulae (traditional and modern index) for the examined ISP texts, were considered as fairly difficult to read by general native English readers. It is worth keeping in mind that these ISP documents are intended for both native and non-native English speakers. This result suggests that there is insufficient attention to ease of comprehension in the process of policy design. We recommend immediate corrective actions to enhance the ease of comprehension for ISPs. This may reduce instances where users avoid fully reading the ISPs, and may also increase the likelihood of user compliance.
This is the first study, to our knowledge, to examine the effectiveness of applying readability metrics as an indicator of policy comprehensibility through a number of sequential methods with nearly 450 participants involved in the entire study. The key findings of the study are the agreements in the comprehension test results attributable to the difficulty of the examined texts. The main study showed a strong correlation between the SRM index and human comprehension results and supports our view that readability has an impact upon understanding ISPs.
VII.CONCLUSION
A. Contribution and Implications
There are a number of studies in the literature investigating the factors that enable compliance with regulations and rules of security in order to mitigate security incidents. This research work has four theoretical contributions and practical implications. Firstly, this study contributed to examine the effectiveness of applying readability metrics as an indicator of policy comprehensibility. This was the first research, to our knowledge, to do that as an experimental study via a number of exploratory sequential mixed methods. The methodological approach of this study is one of the distinguishing characteristics reported in this article. Our study depended on quantitative and qualitative data that have been gathered from many respondents. The research method features qualitative
data gathered from experts‟ opinions and focus group
ISSN: 2394-9333, www.ijtrd.com
comprehension tests to evaluate human ease of reading on selected texts. Later on, the results from this quantitative approach were analysed, to be compared with software readability formulae results. The strength of this work is that the experimental study showed correlations between the Strathclyde readability formula‟s results and human comprehension test results, and this supports our view that readability has an influence on understanding ISPs.
Secondly, although many readability researchers utilise text measurement, our work complements these techniques with comprehension tests as a confirmation of text measurement. This may afford superior understanding for the use of a readability standard as a basis for predicting likely comprehension, particularly for written text. Thirdly, the original data in this work were collected from 450 participants by a variety of methods. To our knowledge, there are no existing studies that utilise comprehension test data, since comprehension tests require relatively high engagement from participants. Fourthly, the study results give a warning sign to all sectors not only to higher education institutions and telecom organisations. Institutions should address policy comprehensibility as they strive to achieve information security policy compliance. The readability score of policy documents should be improved by taking an immediate corrective action. In part, this can be estimated by applying a bespoke readability formula to the text of information security policies.
B. Limitations and Suggestions
As with any research, this study has a number of limitations that should be noted. First of all, we only analysed the readability of eight information security policies. This was due to time constraints, as extracting a large amount of data takes substantially more time to be addressed by our sequential methods. Future research could overcome this
obstacle by using crowdsourcing platforms such as Amazon‟s
Mechanical Turk (MTurk) to recruit participants, as MTurk is quicker to obtain a larger number of respondents than traditional sampling methods. Yet, future researchers should be wary of the limitations of adopting online platforms to recruit individuals, as mentioned by several researchers [59]– [62]. Secondly, the study addresses two different sectors, public and private (academic and telecom organisations). Future research could extend to other sectors (e.g. banking and financial, insurance, health, etc.).
Other limitations relate to the software readability formula of the Strathclyde readability measure. We only addressed the readability of online ISPs that were written in English because the SRM formula only accepts English. Future research could extend the SRM tool to include other languages. Another limitation is that the policies were collected in April 2015. Updates by institutions after April 2015 will not be reflected in our data. However, organisations rarely make substantial changes once their ISPs are rolled out.
Another limitation of our study, which found that two-thirds of the surveyed policies are considered fairly difficult, based on the Strathclyde Readability Measure, is that no advice is afforded on how to improve such documents. Future research could offer insights on how to achieve better readability. For example, sitting down with policy designers, exploring their opinions, and presenting study results to them may promote evaluation of draft policies for ease of reading prior to policy release.
C. Recommendations
Many studies indicate that employee attitudes and lack of security awareness are the most notable contributors to security incidents [63]. Institutions frequently look at
increasing users‟ compliance toward information security policies or „conditions of use‟. This research investigated the
effectiveness of applying readability metrics as an indicator of policy comprehensibility. Based on the results of this work, the following recommendations can be applied to future research. First, our study results can be an opportunity for additional research toward a framework to improve users‟ compliance by taking into account the readability factor alongside other aspects that influence an individuals‟ compliance. Second, further research on the readability factor could address policies that were produced in multiple language versions, with a view to enabling establishing their equivalence in terms of readability.
References
[1] Y. Alkhurayyif and G. R. S. Weir, „Readability as a basis for
information security policy assessment‟, in 2017 Seventh International Conference on Emerging Security Technologies (EST), 2017, pp. 114– 121.
[2] E. C. Johnson, „Security awareness: Switch to a better programme‟, Network Security, vol. 2006, no. 2. pp. 15–18, 2006.
[3] N. H. Higgins, „Corporate system security: towards an integrated
management approach‟, Inf. Manag. Comput. Secur., vol. 7, no. 5, pp. 217–222, 1999.
[4] G. H. Mc Laughlin, „SMOG Grading –A New Readability Formula‟, J. Read., vol. 12, no. 8, pp. 639–646, 1969.
[5] F. Ammann and A. Sowa, „Readability as Lever for Employees ‟ Compliance With Information Security Policies‟, ISACA, vol. 4, pp. 1–4, 2013.
[6] K. Höne and J. H. . Eloff, „What Makes an Effective Information
Security Policy?‟, Netw. Secur., vol. 2002, no. 6, pp. 14–16, 2002. [7] M. a. Alnatheer, „Information Security Culture Critical Success Factors‟,
in 2015 12th International Conference on Information Technology - New Generations, 2015, pp. 731–735.
[8] M. Chapple, „Four ways to measure security success‟, TechTarget, 2005. .
[9] ENISA, „Current practice and the measurement of success‟, Eur. Netw. Inf. Secur. Agency, no. July, p. 20, 2007.
[10] S. O‟Bryan, R. Caraway, and C. CISA, „Critical Elements of
Information Security Program Success‟, vol. 4, no. 26, p. 22, 2006.
[11] D. a. Chapin and S. Akridge, „How Can Security Be Measured?‟, Inf. Syst. Control J., vol. 2, pp. 43–47, 2005.
[12] Y. S. N. Jayaratne, N. K. Anderson, and R. A. Zwahlen, „Readability of
websites containing information on dental implants‟, Clin. Oral Implants Res., vol. 25, no. 12, pp. 1319–1324, 2014.
[13] G. Weir and N. Anagnostou, „Collocation frequency as a readability
factor‟, Proc. 13th Conf. Pan Pacific Assoc. Appl. Linguist., 2008. [14] W. S. Gray and B. Leary, What makes a book readable. Chicago:
University of Chicago Press, 1935.
[15] N. Anagnostou and G. Weir, „From corpus-based collocation
frequencies to readability measure‟, pp. 1–14, 2006. [16] W. DuBay, The principles of readability. 2004.
[17] A. Bailin and A. Grafstein, Readability: Text and context. Springer, 2016.
[18] S. A. Crossley, S. Skalicky, M. Dascalu, D. S. McNamara, and K. Kyle,
„Predicting Text Comprehension , Processing , and Familiarity in Adult Readers : New Approaches to Readability Formulas‟, Discourse Process., vol. 0, no. 0, pp. 1–20, 2017.
[19] M. Sumeeth, R. I. Singh, and J. Miller, „Are Online Privacy Policies
Readable?‟, Int. J. Inf. Secur. Priv., vol. 4, no. 1, pp. 93–116, Jan. 2010. [20] S. Zhou, H. Jeong, and P. A. Green, „How consistent are the best-known
readability equations in estimating the readability of design standards?‟,
IEEE Trans. Prof. Commun., vol. 60, no. 1, pp. 97–111, 2017.
[21] D. Janan and W. David, „Readability : The limitations of an approach
through formulae‟, Br. Educ. Res. Assoc. Annu. Conf. Univ. Manchester, pp. 1–16, 2012.
[22] B. Bruce, A. Rubin, and K. Starr, „Why readability formulas fail‟, IEEE Trans. Prof. Commun., vol. PC-24, no. 1, pp. 50–52, 1981.