1
Agile, Stage-Gate, And Their Combination:
Exploring How They Relate to Performance in Software Development
Published on Journal of Business Research
Link to Full Text (DOI):
https://doi.org/10.1016/j.jbusres.2018.05.003
Mattia Bianchia*
aStockholm School of Economics, Department of Management and Organization
Saltmätargatan 13-17, Box 6501, 113-83 Stockholm, Sweden E-mail: [email protected]
Tel.: +46 8 736 95 08
Giacomo Marzib
bUniversity of Lincoln, Lincoln International Business School
Brayford Wharf E, Lincoln, UK Email: [email protected]
Massimiliano Guerinic
cPolitecnico di Milano, Department of Management, Economics and Industrial Engineering,
Via Lambruschini 4b, 20156 Milano, Italy E-mail: [email protected]
Abstract
This exploratory study investigates the relationship of plan-driven Stage-Gate and flexible Agile models with new product development performance through an original conceptualization that focuses on their underlying principles for managing uncertainty and the resulting changes. While Stage-Gate attempts to control uncertainty up-front to avoid later changes, Agile seeks to adapt to uncertainty and accommodate changes for a longer proportion of the development process. In addition, we examine the interaction effects of combining the two models. The analysis of survey data on 181 software developers shows that the adoption of Stage-Gate principles is negatively associated with speed and cost performance. For Agile, the use of sprints is positively related to new product quality, on-time and on-budget completion, while early and frequent user feedback would seem to prolong time-to-market. Finally, the results highlight a nuanced interaction between Stage-Gate and Agile, both positive and negative depending on the principles considered.
Keywords: Agile; Stage-Gate; Software development; Innovation management; New product
2 1. Introduction
While innovation ranks higher than ever on the strategic agenda of top managers, and R&D spend continues to grow, the failure to meet time, cost, and quality targets remains high (Markham & Lee, 2013; Kahn et al., 2012). In software development, over a quarter of projects are never completed (Faraj & Sambamurthy, 2006), and nearly two-thirds experience budget and schedule overruns (Shenhar, 2008). Identifying the factors that improve innovation performance is therefore essential (Evanschitzky, Eisend, Calantone, & Jiang, 2012).
New product development (NPD) literature has investigated several success factors, including strategic aspects, process and organizational design, and product and marketplace characteristics1. Innovation studies indicate inappropriate approaches to the management of the NPD process as a key reason for failure (MacCormack & Verganti, 2003). A new class of process models has emerged that operates differently from the traditional and linear methods (Chow & Cao, 2008; Boehm & Turner, 2003). The latter, including Stage-Gate and Waterfall, prescribe detailed product specifications and front-end plans, sequential phases, development activities adhering to agreed specifications, and strictly defined criteria (Cooper, Edgett, & Kleinschmidt, 2002; Ettlie & Elsenbach, 2007). In contrast, flexible models, such as Agile and lean start-up, advocate minimal up-front planning, adapting product design to changing requirements until late in the NPD process, involving users early through prototyping and frequent testing, organizing development work in iterations of time-boxed design-build-test cycles (Lee & Xia, 2010; Chan & Thong, 2009).
The potential for a paradigm shift is significant. Recent studies report a growing trend of migrating from linear plan-driven models to Agile (Petersen & Wohlin, 2010; Cram & Newell, 2016). A key driver of the adoption of Agile is the uncertainty and volatility of business environments (Lee & Xia, 2010; Recker, Holten, Hummel, & Rosenkranz, 2017). For NPD, this means that most innovation projects start with incomplete knowledge of customer needs and the technologies used to fulfill needs that may change over the course of projects (Tatikonda & Rosenthal, 2000). With today’s intensified competition, rapid technological advances, and fluid market demands, agility, defined as the ability to quickly change plans and scope in response to unanticipated and evolving requirements (Conforto et al., 2016), is imperative (Lee & Xia, 2010).
The present study investigates the influence of plan-driven Stage-Gate models, flexible Agile models, and their combination, on NPD speed, cost, and quality performance. To this end, we develop an original conceptualization of the two models based on their underlying principles for managing the uncertainty inherent in innovation processes and the changes that result from deviations from the plans (Steffens, Martinsuo, & Artto 2007; Munthe, Uppvall, Engwall, & Dahlén, 2014). We argue that although narrow and only one of the potential perspectives, this underlies the two fundamentally different approaches that Stage-Gate and Agile prescribe: Stage-Gate attempts to control uncertainty up-front to avoid later changes; Agile seeks to adapt to uncertainty and accommodate changes even in later NPD phases. Based on this perspective, which coincides with one of the four core values in the original Agile Manifesto, i.e., emphasis on responding to change over following a plan (Beck et al., 2001)2, we investigate the two process models along a number of related key dimensions: extent of planning vs. learning (DeMeyer, Loch, & Pich, 2002), arrangement of NPD phases (Iansiti, 1995), timing and mode of specification (Bjarnason, Wnuk, & Regnell, 2012), and timing and frequency of user feedback (MacCormack, Verganti, & Iansiti, 2001).
Focusing on these principles is a significant departure from most existing studies that
1 See Henard and Szymanski (2011) for a comprehensive review.
2 The other three are emphasis on individuals over processes, on working software over complete documentation,
3
conceptualize Agile adoption in terms of the use of specific practices and tools, and exploring their effectiveness (Vijayasarathy & Turk, 2012). Such approach entails a number of issues: different methods fall under the Agile umbrella3, which while sharing a common philosophy, have their own practices and terminology (Dybå & Dingsøyr, 2008). These artifacts continuously evolve and new ones are created (Mangalaraj, Mahapatra, & Nerur, 2009). In addition, most organizations tailor Agile practices to suit their NPD environments, often combining tools from different methods (Tripp & Armstrong, 2016). This “a-la-carte” implementation of the Agile toolkit implies the inability to distinguish a deep and mindful adoption from a superficial and fashion-driven one (Cram & Newell, 2016). Dikert, Paasivaara, and Lassenius, (2016) argue that “[a]gile development is not founded on the use of individual tools or practices, but rather on a holistic way of thinking”. We respond to the call of Dingsøyr, Nerur, Balijepally, & Moe, (2012) inviting researchers to focus on the quintessential principles of NPD process models that are both unequivocal and useful for practice. This approach is appropriate for comparative studies on Stage-Gate and Agile models due to the higher level of abstraction that accentuates the fundamental differences, while offering more common ground to compare organizations, even across various NPD environments and industries.
Empirically, we adopt an exploratory research design using new survey data on 181 Italian software developers who are members of four virtual communities. Exploratory large-N studies (see, e.g., Birhanu, Gambardella, & Valentini, 2016; Lyngsie & Foss, 2017) constitute an appropriate research strategy “when existing theory provides a useful frame for a baseline argument but is not robust enough for precise hypotheses” (Bettis, Gambardella, Helfat, & Mitchell, 2014, p. 950). Indeed, research on the performance of Stage-Gate vs. Agile models is scant, largely based on opinions, small samples, and often lacking theoretical underpinnings (Dybå & Dingsøyr, 2008). Most studies point to the utility of Agile and see it as universally desirable, yet with little empirical validation of the claimed benefits. The studies of Lee and Xia (2010), Serrador and Pinto (2015), and Recker et al. (2017) are notable exceptions, but do not compare the merits and limitations of plan-driven and flexible process models. To our knowledge, this is the first quantitative study that tests the effectiveness of combining Stage-Gate and Agile. Scholars increasingly pay attention to hybrid NPD process models (Cooper & Sommer, 2016), yet the scarce empirical evidence on their suitability and performance, drawing on case studies (Karlström & Runeson, 2006) or simulations (Port & Bui, 2009), is ambiguous. Extant studies find both synergies (Sommer, Hedegaard, Dukovska-Popovska, & Steger-Jensen, 2015) and tensions (Dikert et al., 2016) in the combined use of the two approaches. Serrador and Pinto (2015) thus call for further research on the interaction between Stage-Gate and Agile, particularly using larger samples, and hence the use of software development as our empirical setting. In fact, Waterfall (a forerunner of Stage-Gate) and Agile both originated in the software industry (Royce, 1970; Beck et al., 2001), explaining their widespread yet heterogeneous adoption among software developers (Cram & Newell, 2016). We analyze the overall software development process and resulting performance at the aggregate level without collecting data at the project level. While potentially a limitation, this is a common approach in extant studies (Tripp & Armstrong, 2016; Bygstad, Ghinea, & Brevik, 2008).
The paper is structured as follows. Section 2 reviews the relevant literature on the performance effects of Stage-Gate and Agile approaches, and their integration into hybrids. Section 3 develops the conceptual framework of this study. Section 4 describes the methodology and Section 5 presents our findings. Finally, Section 6 discusses our contribution to research and practice, outlining the limitations and future research avenues.
3 The main ones are Scrum and eXtreme Programming (XP). Crystal and Feature-Driven Development methods
4 2. Literature review
2.1. Stage-Gate and its performance effects
Since the 70’s, Stage-Gate and its IT equivalents4 have been the conventional NPD
management models (Royce, 1970), prescribing the division of development work into sequential stages separated by review gates (Cooper et al., 2002). Stage-Gate derived from the need to control unstructured development projects (MacCormack & Verganti, 2003), enabling meticulous front-end planning and monitoring work progress, even if often deemed heavyweight due to extensive documentation and codification (Dybå & Dingsøyr, 2008).
Early anecdotal evidence documents the performance benefits that leading companies achieved with Stage-Gate models (Cooper, 1993). More rigorous empirical research highlights that the use of a formal development process with clearly defined stages and gates increases NPD effectiveness (Mabert, Muth, & Schmenner, 1992), project execution success (Tatikonda & Rosenthal, 2000), and speed-to-market (Griffin, 1997). Other studies find a positive relation between Stage-Gate and creativity (Stevens, Burley, & Divine, 1999), and new product commercialization (Ettlie & Elsenbach, 2007). Overall, conventional plan-driven approaches have proven effective in relatively predictable and stable environments (MacCormack & Verganti, 2003; Port & Bui, 2009). However, a number of studies question the value of Stage-Gate in today’s increasingly uncertain and fast-paced environments (Lenfle & Loch, 2010), citing problems of excessive rigidity and bureaucracy, budget overruns and delays (Cooper, 2014). To correct some of the deficiencies, organizations began modifying the original Stage-Gate models. According to Ettlie and Elsenbach (2007), these modifications have positively but indirectly contributed to NPD effectiveness, while Sommer et al. (2015) claim they have yielded little or no performance improvement.
Traditional plan-driven models are still pervasive today. In their global survey, Markham and Lee (2013) find that 61.5% of organizations use a formal Stage-Gate model for NPD, but point to an overall decline in NPD process formalization, arguing that companies increasingly experiment with less formal approaches.
2.2. Agile and its performance effects
Agile originated in 2001 when 17 leading practitioners formulated a manifesto of values and guidelines to improve the creation of new software code (Beck et al., 2001). Although some Agile practices existed in previous models, such as Spiral and Lean, the way in which they were formalized into a cogent model was a major departure from the dominant plan-driven approach (Port & Bui, 2009). Agile refers to a family of iterative software development methods, and while including different tools and techniques pertaining to the technical, management, customer collaboration, organization, and team spheres5 (Wood, Michaelides, & Thomson, 2013), they share common principles. Feedback and change are at the core of Agile for a dynamic, evolving, and organic, rather than static, predefined, and mechanistic NPD process (Lee & Xia, 2010). To deliver timely, high-quality, and cost efficient innovations, Agile developers organized in small, co-located, autonomous teams, build and test software in short iterative cycles, actively involving users to collect feedback, updating the project scope and plans “on-the-fly”, using face-to-face communication as opposed to documentation (Chan & Thong, 2009). Hence, Agile methods are deemed lightweight (Boehm & Turner, 2003).
While early research focused on the adoption of Agile methods (Nerur, Mahapatra, &
4 The main ones are Waterfall, Rational Unified Process, and V-model.
5 The technical sphere includes, e.g., refactoring, test-first programming, coding standards, and continuous code
integration. The management sphere includes, e.g., stand-up meetings, retrospectives, burndown charts, and product backlogs. The customer collaboration sphere includes, e.g., planning game, requirements as user stories, and on-site or proxy customers. The organization and team sphere includes, e.g., pair programming and collective ownership. See Mangalaraj et al. (2009) and Tripp and Armstrong (2016) for detailed descriptions.
5
Mangalaraj, 2005), fewer empirical studies assess their relation to performance. Layman, Williams, and Cunningham (2004), Ilieva, Ivanov, and Stefanova, (2004), and Benediktsson, Dalcher, and Thorbergsson (2006) report significant productivity gains from using Agile methods, ranging from 42% to over 337%. However, Layman et al. (2004) argue that such gains may be due to the higher experience of the team using Agile, Ilieva et al. (2004) find that the gains diminish in later project iterations, and Benediktsson et al. (2006) explain that these are simply due to delivering more lines of code without offering additional functionality. Conversely, Macias, Holcombe, and Gheorghe (2003) find no difference in productivity between Agile and traditional methods, while Wellington, Briggs, and Girard (2005) report a productivity loss. As regards speed of completion, Budzier and Flyvbjerg (2013) find that Agile methods decrease project delivery times, whereas Benediktsson et al. (2006) find no effect. As regards quality, Ilieva et al. (2004) and Layman et al. (2004) find a reduction in the number of defects when Agile is used. Wellington et al. (2005) report a similar result, measuring quality with standard code metrics. However, Macias et al. (2003) find no significant difference in either internal or external quality between Agile and Waterfall models. Focusing on the impact of specific Agile practices, Maruping, Venkatesh, and Agarwal (2009) find that collective code ownership and coding standards improve the quality of new software. Wood et al. (2013) demonstrate that the positive association of these two practices and continuous integration with performance is mediated by the level of cooperation in the development team. However, they also find a negative relationship between other Agile practices, such as test-first programming and refactoring, and software quality. Results for pair programming are more mixed and depend on the performance dimension considered and other contingent factors (Hannay, Dybå, Arisholm, & Sjøberg, 2009).
The seminal study of Lee and Xia (2010) conceptualizes Agile in terms of the extensiveness and efficiency of a team’s response to changes in customer needs. Using survey data on 399 software developers, they find that response efficiency positively affects time and on-budget completion, as well as software functionality, whereas extensiveness only affects the latter. Using the same conceptualization, Recker et al. (2017) show that both dimensions of Agile affect NPD success measured as process performance, customer satisfaction, and software functionality. In a large-scale quantitative study, Serrador and Pinto (2015) investigate the performance effects of Agile across multiple industries, finding improved NPD efficiency and stakeholder satisfaction. A particularly interesting aspect is that they measure Agile using the distribution of planning effort across different NPD process phases.
Overall, no conclusive evidence supports the superiority of Agile over Stage-Gate. Most comparative studies are based on small samples or controlled experiments, while quantitative studies mainly focus on Agile practices, with some exceptions, but without offering a comparison with Stage-Gate methods.
2.3. Hybrid models and their performance effects
The home ground model of Boehm and Turner (2003) posits that a number of factors in the NPD environment determine which process model is most appropriate: large projects with stable and predictable requirements for Stage-Gate, and small-to-medium projects with highly dynamic and unpredictable requirements for Agile. However, most real-life projects do not have values for these factors within the model’s home ground (Port and Bui, 2009). As such, adopting a single model in its pure form may be risky. Instead, Boehm and Turner (2003) suggest a balanced approach that includes both plan-driven and Agile practices.
The debate is ongoing on whether Stage-Gate and Agile are compatible and complementary, and on how to best mix the two approaches to leverage their respective strengths and mitigate their weaknesses (Dingsøyr et al., 2012). To date, most evidence is anecdotal. Cooper and Sommer (2016) describe the cases of established firms benefiting from the use of Agile
6
practices within their existing Stage-Gate systems. Hybrid models are spreading across organizations (Serrador & Pinto, 2015), and while some authors speculate on their potential to deliver exceptional innovation outcomes, few studies rigorously examine how the integration of Stage-Gate and Agile affects NPD performance. Based on two large-scale software projects, Karlström and Runeson (2006) find synergies between the use of XP methods and Stage-Gate project management models. Port and Bui (2009) find that a mixed strategy incorporating both Agile and plan-driven principles outperforms both pure approaches at almost any level of dynamism. The case-based evidence of Sommer et al. (2015) suggests that using a Stage-Gate model at the strategic level together with Scrum tools at the execution level increases NPD productivity, flexibility, and coordination.
Dikert et al. (2016) instead indicate that the coexistence of the two approaches causes tensions at all organizational levels, bureaucracy duplication, and reward system mismatch.
3. Conceptual framework
3.1. Innovation as managing uncertainty and the resulting changes
Uncertainty, defined as the absence of complete information on the phenomenon under study (Argote, 1982), is inherent in innovation initiatives with the goal of developing something new (Sull, 2004). The final “recipe” for a new product is unknown at the outset and emerges progressively as resources are invested and development activities are completed (De Meyer et al., 2002). Uncertainty in NPD concerns, for example, customer needs and preferences, technological possibilities, and competitors’ moves. These aspects can be difficult to predict accurately and can radically evolve over the course of typically long projects as new information becomes available (Chen, Reilly, & Lynn, 2005). This phenomenon creates deviations, defined as situations when something has not gone as planned (Hällgren & Maaninen-Olsson, 2005), which in turn calls for managerial actions to preserve or even improve the chance of NPD success (Munthe et al., 2014). Effectively managing uncertainty and the resulting changes is a core capability in NPD (MacCormack et al., 2001): innovation managers perform critical tasks that influence the likelihood and extent of deviations, and the related responses (Steffens et al., 2007). In this perspective, Stage-Gate and Agile constitute fundamentally different management approaches: the former attempts to control uncertainty up-front to avoid later changes, whereas the latter aims to adapt to uncertainty and accommodate changes for as long as possible. Consequently, the two models advocate a different balance between planning and learning (De Meyer et al., 2002). Stage-Gate prescribes extensive planning at the outset of the NPD process to reduce learning in later phases, while Agile invests in ongoing learning as opposed to up-front planning, which is kept minimal. Opposite balances correspond to contrasting choices regarding process design, product specification mode and timing, user feedback frequency and timing (see Table 1 for a list of these principles). In the following, we discuss these principles to investigate how Stage-Gate and Agile might relate to NPD performance.
(Insert Table 1 about here)
3.2. Managing uncertainty and the resulting changes according to Stage-Gate
The linear and sequential process in Stage-Gate models implies that work in a downstream stage can only begin when the preceding stage has been completed and successfully passes the formal review of a gate (Iansiti, 1995). To avoid delays in subsequent design and implementation phases, product specifications and plans are set early in the process. This anticipated convergence decision is critical in Stage-Gate as it is scarcely reversible (MacCormack et al., 2001). Concept freeze occurs when senior management approves the selected product concept and casts it in stone, since later modifications are deemed troublesome
7
and costly (Steffens et al., 2007). To improve selection accuracy and thus minimize the risk of revisions in downstream phases, developers invest significant resources in extensive information collection through desk research practices, e.g., market intelligence and technology foresight, which allow evaluating the different alternatives (Munthe et al., 2014). Proponents of Stage-Gate models posit that meticulous planning and “freezing” at the front-end can foster stability, discipline, and compliance (Cooper, 1993), leading to lower development costs, timely completion, and better product quality (Meso & Jain, 2006). This is likely when requirements are well-known, stable, and foreseeable (MacCormack & Verganti, 2003), validating the inherent assumptions of Stage-Gate, i.e., that problems and solutions can be fully anticipated and risks can be managed proactively through buffers and contingency plans. Conversely, uncertain and dynamic environments pose particular challenges to the Stage-Gate planning orientation (Serrador & Pinto, 2015). In these conditions, it is difficult to identify upfront the entire range of user needs, their relative value for customers, and every possible design alternative to address these (DeMeyer et al., 2002). Choosing the optimal product concept is similarly complex: due to sequentiality, selection decisions are made before design creates relevant information on the performance of the different alternatives (Iansiti, 1995), leading to evaluation errors in the form of false positives and false negatives. Proactive risk management, to avoid reactive changes downstream, leads developers to add safety margins and over-specify products, often with more functionalities than customers need, a phenomenon called gold-plating (Shmueli, Pliskin, & Fink, 2016), which results in resource wastage. Petersen and Wohlin (2010) show that the scarce reversibility of early selection causes developers to take too long to make decisions, delaying later phases.
In Stage-Gate models, most of the NPD process involves minimal direct user participation. The collection of customer feedback through testing occurs only at the very end (Wood et al., 2013). This allows saving on traditionally long and expensive prototyping tasks, and focusing on the design likely to be launched. However, in uncertain NPD environments, deferring feedback from the end-use application context is a significant risk (MacCormack et al., 2001). Market research and analytic tools offer little to the emergence of performance issues. Late verification of the overall system is very complex due to testing too much at once (Petersen & Wohlin, 2010). This approach tends to delay the likely moment when developers discover that the selected concept no longer offers an optimal product-market fit (Iansiti, 1995). In conditions of uncertainty and volatility, this might occur due to inaccurate early predictions, newly emerging information, or later environmental shifts. This deviation from the plan presents developers with a dilemma: ignore it and avoid changes to the original product specifications, as advocated by the original Stage-Gate model, or break the “freezing rule” and revise the concept according to the new insights. The first course of action may preserve the time and cost objectives, but is likely to result in launching an obsolete product where user requirements have long since evolved (Serrador & Pinto, 2015; Lee & Xia, 2010). MacCormack et al. (2001) find that releasing a design that closely mirrors the initial specification is not a predictor of success in unstable NPD environments. The second course of action, based on the logic that developing a high-quality product that fits market demand is better than adhering to the original targets (Meso & Jain, 2006), is however associated with downstream pitfalls. One of these relates to design loopbacks, as developers must iterate back to earlier phases and correct or redo activities (Karlström & Runeson, 2006), which is wasteful and time-consuming, negatively influencing the work on other features (Petersen & Wohlin, 2010). Literature describes this situation as firefighting, i.e., the unplanned allocation of resources to fix problems discovered late in the development process (Repenning, 2001). Firefighting can have severe negative consequences, such as launch date slippage, employee burnout, budget overruns, and design instability, since any ad-hoc change to a component may trigger unexpected changes to other components. According to Reagan (2012), “too much up-front
8
planning means too much change management downstream”.
3.3. Managing uncertainty and the resulting changes according to Agile
The Agile management approach invests in learning as opposed to planning (DeMeyer et al., 2002). Given that technical and market conditions can radically and unpredictably change over a project’s timeline, significant investments in up-front prediction and concept definition provide little return. Thus, Agile organizations strive to opportunely and continuously identify changes in requirements and deviations from expectations, actively responding by incorporating the new information into an evolving product concept, regardless of when they occur in a project’s lifetime (Lee & Xia, 2010). Instead of undesirable contingencies or signs of dysfunctional management, the deviations and resulting changes are deemed valuable opportunities to develop solutions that offer a better product-market fit. Agile is consistent with the concept of an emergent order as opposed to the imposed order inherent in plan-driven Stage-Gate (Meso & Jain, 2006).
To promptly create and quickly react to new information, Agile models break innovation work into short fixed-length development cycles, called sprints, repeated multiple times throughout the process. As an iterative model, all development activities are executed in each sprint in a compressed and reduced form. Compared to the extensive Stage-Gate phases, the reduced scope and high frequency of sprints decrease the time and resource investments, while increasing flexibility to adjust the evolving design to the emerging context, and simply planning and executing the next iteration without requiring loopbacks (Bjarnason et al., 2012). Reduced scope also means more accurate estimations of the resources needed to meet a requirement (Petersen & Wohlin, 2010). The limited planning effort in Agile does not imply poor planning, as it is granular and oriented to the short term. A key characteristic of sprints is time-boxing, which fixes the time of the development cycle but not the scope of work, and thus unmet requirements can be carried to the next iteration (Port & Bui, 2009). Time-boxing creates a regular and predictable work cadence, facilitates monitoring the development progress (Yu & Petter, 2014), reduces procrastination, puts healthy pressure on developers to make realistic commitments (Recker et al., 2017), mitigates scope creep by promoting a satisficing approach focused on the highest priority functionalities (Shmueli et al., 2016). On the negative side, the granularity and overlapping of sprints can lead to significant management overheads due to multiple teams requiring significant coordination and communication (Port & Bui, 2009). A further potential problem is that the product architecture may lack focus (Petersen & Wohlin, 2010).
The goal of each sprint is to produce a working prototype that can be demonstrated to users. Agile advocates early user involvement through rapidly and frequently testing product concepts to obtain valuable feedback that informs their evolution in subsequent cycles (Cooper, 2014). In conditions of high uncertainty, trial-and-error experimentation is superior to analytics and desk research as a knowledge generation and error elimination mechanism (Thomke & Fujimoto, 2000). Karlström and Runeson (2006) show that this helps hidden user needs emerge, and hence the choice of key product functionalities. Petersen and Wohlin (2010) demonstrate that Ericsson, by adopting an Agile testing approach, halved the number of defects identified that should have been found earlier in the process. Using data on 29 software development projects, MacCormack et al. (2001) find that projects that anticipated the first beta release, even if with limited functionality, outperformed projects that delayed testing. This factor explained a third of the variance in product quality. Agile’s continuous delivery of functionality allows earlier returns on investment than plan-driven development where large investments start paying off only at the end (Petersen & Wohlin, 2010). By more quickly and more often demonstrating business value to customers, developers foster greater confidence in their ability to meet user needs (Grenning, 2001). However, close user interaction and
co-9
creation may create stress for the stakeholders involved, as well as bottlenecks (Dybå & Dingsøyr, 2008).
Taking advantage of learning in Agile requires keeping the product concept open to change for a longer period, with final design decisions taken as close to market introduction as possible (Iansiti, 1995). Agile suggests that the concept specification at the beginning of the NPD process should be seen as tentative, including both fixed and variable elements. The former can be fully specified and locked-in, and are not expected to change (Cooper & Sommer, 2016), while the latter are unknown and fluid, defined at a high level and progressively refined through multiple sprints (MacCormack, Crandall, Henderson, & Toft, 2012). While potentially increasing project duration and costs, dynamic scoping and short frozen zones allow developers to incorporate the latest user requirements, which is particularly beneficial for product quality in volatile environments (Lee & Xia, 2010). Paradoxically, even if Agile advocates embracing change, Petersen and Wohlin (2010) find that this approach reduces the number of change requests compared to Stage-Gate, since the limited timeframe of sprints implies a small lag between requirement specification and implementation, and hence greater stability and less waste. In Agile, if a requirement is specified and planned in a sprint, then it must be implemented exactly as specified, a form of efficient freezing at the micro-level, whereas flexibility is retained across sprints at the macro-level.
3.4. Combining Stage-Gate and Agile principles for managing uncertainty and the resulting changes
The conceptualization of Stage-Gate and Agile in this study highlights that the two process models build on opposing principles in terms of how they advocate managing uncertainty in NPD and the resulting changes. Hence, their simultaneous use may create tensions with negative effects on performance (Dikert et al., 2016). Moreover, Stage-Gate (Agile) constitutes an internally consistent system of principles that jointly support the plan-driven (flexible) development of new products. Mixing and matching principles from the two approaches can generate fundamental inconsistencies. However, early research on hybrid models argues that complementarities may exist given that the two approaches support development work at different levels: Stage-Gate acts as a macro-level framework facilitating the coordination of NPD teams, whereas Agile offers effective planning of day-to-day activities and monitoring the progress at the micro-level (Karlström & Runeson, 2006).
4. Method
4.1. Sample and data collection
This exploratory study focuses on software development, an ideal context for research on linear vs. flexible NPD process models that originated and are widespread in this industry (MacCormack et al., 2001). This empirical setting is also consistent with our focus on managing uncertainty and the resulting changes, an intrinsic part of software development and a key source of innovation failure (Dingsøyr et al., 2012). The choice of delimiting the study to a single type of product helps isolate the role of process variables on NPD performance, and achieve a higher degree of contextual homogeneity. The unit of analysis is the overall NPD process, as in Ettlie and Elsenbach (2007), Tripp and Armstrong (2016), and Bygstad et al. (2008). Due to the lack of project-level dimensions, this aggregate analysis does not capture heterogeneity between different projects, and therefore does not assess its effect on the relationships investigated. While this is a limitation, there are studies that find no moderating role of project characteristics, such as variability and criticality, on either the Stage-Gate (Tatikonda & Rosenthal, 2000) or Agile success relation (Chow & Cao, 2008).
The unit of enquiry is software developers who are members of four Italian virtual communities (Italia JavaScript, Google Development Group Slack Milan, Google
10
Development Group Florence, ASP.NET Italia) focusing on the development of internet software products. Data collection took place in spring 2017 through a computer-assisted web-based questionnaire. Community administrators actively informed their members about the survey, posting the link to the questionnaire on different internet venues (the community’s chat, Google and Facebook groups), and encouraging members to participate (Dholakia, Bagozzi, & Pearo, 2004; Steenkamp & Geyskens, 2006). The first page of the survey, in addition to ensuring anonymity and confidentiality, informed participants that the questions related to their actual overall software development work and therefore not to confine their responses to a specific project (Misra, Kumar, & Kumar, 2010; Vijayasarathy & Turk, 2012) but consider the process of NPD projects executed in the last three years (or in the last year, if their work experience was less).
A sample of 276 software developers yielded a raw response rate of 16%6. This is in line with previous studies highlighting the possibility of fairly low response rates when using online virtual communities (Franke & von Hippel, 2003; Chow & Cao, 2008), which have many inactive members (Petrovčič, Petrič, & Manfreda, 2016). Tests of non-response bias revealed no statistically significant differences between early and late respondents. After excluding responses with missing values, the final sample consisted of 181 software developers7.
4.2. Measurement
The study uses multiple-item 7-point Likert-scale measures (Jarvis et al., 2003). The dependent variable NPD performance is a multidimensional construct based on the achievement of key goals (Tatikonda & Rosenthal, 2000). According to much innovation and software development literature, these goals relate to on-time completion, on-budget completion, and new product quality (Lee & Xia, 2010). To assess these performance dimensions, we employ perceptive measures. Recent Agile studies using perceived performance as reported by participants include those of Serrador and Pinto (2015) and Recker et al. (2017). Our aggregate level of analysis and survey design did not allow using objective performance measures, such as the project’s actual budget and schedule overruns (Nidumolu, 1995), or defect rate in software code (MacCormack et al., 2012). The performance assessment of multiple respondents or external experts was also not possible (MacCormack & Verganti, 2003) (Section 5.2 addresses the limitation of potential single-respondent bias). Each NPD performance construct was measured with multiple-item scales adapted from prior research (Lee & Xia, 2010; Chen et al., 2005) at the NPD process level (Ettlie & Elsenbach, 2007) in software development (Chow & Cao, 2008). The items primarily tapped into internal execution-oriented outcomes (Tatikonda & Rosenthal, 2000). A market-oriented item related to customer satisfaction was included in the quality construct to account for an external aspect of quality and due to its centrality in the Agile manifesto (Serrador & Pinto, 2015).
Scales for the Stage-Gate and Agile constructs at the level and focus of this study (the principles for managing uncertainty and the resulting changes) are lacking in extant literature.
6 Of the 870 members of Italia JavaScript, 152 responded to the questionnaire, a raw response rate of 17.4% (the
invitation to compile the questionnaire was posted on the community’s chat, and thus the number of members who visualized the post is unknown). Of the 83 members of Google Development Group Slack Milan, 27 responded to the questionnaire, a raw response rate of 32.5% (the invitation to compile the questionnaire was posted on the community’s chat, thus the number of members who visualized the post is unknown). Of the 219 members of Google Development Group Florence, 40 responded to the questionnaire, a raw response rate of 18.3% (the invitation to compile the questionnaire was posted on the community’s Google Group and was visualized by 53 members, 75% of whom responded to the survey). Of the 552 members of ASP.NET Italia, 30 responded to the questionnaire, a raw response rate of 5.4% (the invitation to compile the questionnaire was posted on the community’s Facebook Group and was visualized by 64 members, 47% of whom responded to the survey).
7 The distribution is as follows: 117 members of Italia JavaScript; 21 members of Google Development Group
11
The few available Stage-Gate measures in quantitative studies focus on process formality, the existence of review gates, or the use of original or modified Stage-Gate versions (Griffin, 1997; Tatikonda & Rosenthal, 2000; Ettlie & Elsenbach, 2007). As for Agile, abundant studies measure the extent to which specific tools or practices are employed (Vijayasarathy & Turk, 2012), with some exceptions (Lee & Xia, 2010; Serrador & Pinto, 2015), which however do not adopt this study’s conceptual lens.
We followed Kohli, Jaworski, and Kumar’s (1993) iterative procedure to develop the scales. The initial pool of items was generated based on repeated discussions with expert software developers and an extensive literature review. The research streams considered to achieve theoretically sound conceptualizations include the management of linear vs. flexible NPD (Thomke & Fujimoto, 2000), software development (Iansiti, 1995), innovation uncertainty (DeMeyer et al., 2002), changes in projects (Steffens et al., 2007), definition and conceptualization of agility (Conforto et al., 2016). We intentionally kept the formulation of items broad for applicability to different NPD contexts, in line with our aggregate level of analysis and focus on principles. For this reason and those mentioned for the NPD performance dimensions, the items were designed to capture the developers’ perceptions of NPD management principles, and not actual project-level hard data (MacCormack & Verganti, 2003). As a result, we generated a large pool of items for each process model (10 items for Stage-Gate and 15 items for Agile).
We then selected a subset of these items using the criteria of uniqueness and the ability to convey different meanings (Churchill, 1979). We tested the items for clarity and appropriateness with seven senior developers and project managers. On average, each interview lasted 30 minutes. Based on their feedback, we eliminated, modified, and added new items. Some items were reverse-scored to minimize response set bias. The survey length was deemed to achieve an acceptable response rate (Rogelberg & Stanton, 2007). A further wave of pre-tests consisted of presenting the scales to three academic experts who critically evaluated the items in terms of domain representativeness, item specificity, and clarity of construction, providing detailed suggestions for item revision. As the last step before the full-scale survey administration, we conducted a pilot test with 15 Master students enrolled in computer science, software engineering, and information system management, who completed the questionnaire and raised minor concerns that we addressed to finalize the instrument. This provided sufficient confidence of the instrument’s reliability and validity.
(Insert Table 2 about here)
Table 2 reports the measures and constructs used in this study and the results for the dimensionality, composite reliability, and convergent validity of the scales. For the factor analysis, we used principal component extraction with varimax rotation (Hair et al., 2006). We obtained the factors by weighted sums of the standardized items, based on corresponding scoring coefficients. The predicted factor variables for speed, cost, and quality performance emerged from the scale items. The factor analysis supports the unidimensionality of the four-item Stage-Gate factor, which captures its underlying principles, such as early and “frozen” specification, linear and sequential arrangement of development stages, avoidance of late design changes.
In line with Lee and Xia (2010) and Sarker et al. (2009), the factor analysis of the items in the Agile construct does not support its unidimensionality, instead resulting in a three-factor solution. The three-item scale Sprints captures the developers’ use of iterative, time-boxed,
well-defined work cycles for the development of appropriately sized items; the three-item scale
Feedback addresses the early and frequent deployment of beta tests and flexible adaptation to it; the three-item scale Specification assesses the gradual, delayed requirements detailing, and
12
dynamic scoping. The identified factor structure is consistent with the conceptual development of the Agile principles for managing uncertainty and the resulting changes, with the first factor focused on the process design, the second on feedback, and the third on specification. Following the criteria of Bagozzi and Yi (1988) and Steenkamp and Van Trijp (1991), all factor loadings exceed the threshold of 0.50, the composite reliability measure is above 0.60, and the average variance extracted value is higher than 0.50, indicating that the internal consistency of all research constructs is acceptable.
4.3. Estimation procedure
This study uses seemingly unrelated regression (SUR) models (Zellner, 1962) to take into account the potential correlation of the error terms of the three equations with the dependent variables speed, cost, and quality performance. The main independent variables are the Stage-Gate and three Agile factor variables. To investigate the complementarity between Stage-Stage-Gate and Agile, we introduce the Stage-Gate and three Agile factor variables together with their interaction terms. To avoid multicollinearity concerns, we test interaction effects both separately for each Agile factor and by including all interactions between Stage-Gate and the three Agile factors in a full model.8
The study uses the following controls: developer’s age measured in four categories (18-30; 31-45; 46-60; over 60); typical size of the developer’s project team measured in six categories (1, independent work; 2-4 members; 5-10; 11-20; 21-40; over 40); a set of dummy variables that equal 1 if the developer is male, the organization is small (i.e., under 40 employees), the developer has a leadership role (functional manager, project manager, team leader), s/he is a freelancer and located in Italy. The models also include three dummy variables for the main markets of the software developed (computer related, business services, and public services). We include dummies to control for fixed effects associated with the virtual community to which the developer belongs.
Table 3 provides the summary statistics of all variables in our analysis. Most developers are male (95%) and are located in Italy (93%). The median developer’s age is 2, meaning that at least 50% of developers are less than 45 years old. They mainly develop software for computer related (35%) and business services (36%) markets. As for job positions, 40% work for small organizations, 25% are freelancers, and 31% have a leadership role in the team. The median team size is 2, meaning that the majority of developers work in small teams (less than 5 members). Table 4 provides the correlation matrix (with the exception of community dummies). The correlations among Stage-Gate and Agile factors are generally low. The correlation between the Stage-Gate factor and the two Agile factors Sprints and Feedback is close to 0 (-0.02 in both cases) and not significant. The correlation between Stage-Gate and Agile-Specification is negative (-0.17) and statistically significant. The only significant correlation among Agile factors is between Agile-Sprints and Agile-Feedback (0.26).
(Insert Tables 3 & 4 about here)
5. Findings
5.1. Main results
Tables 5, 6, and 7 report the results of the SUR models for speed, cost, and quality performance. To ease the interpretation of coefficients, all continuous variables were standardized. In each
8 We also performed a variance inflation factor (VIF) analysis, which suggests that multicollinearity is not a
problem in our estimates. Indeed, in all estimates, the mean VIF is below the threshold of 5, while the maximum VIF is below the threshold of 10 (Belsley, Kuh, & Welsch, 1980).
13
table, column I refers to the model without interaction terms between the Stage-Gate and Agile factor variables, columns II-IV refer to models that separately consider the effect of a single Agile factor and its interaction with Stage-Gate, and column V refers to the full model with all factors and their interaction terms. In the full model, the correlation of the residuals among the three performance equations is always above 0.35. The Breusch-Pagan test rejects the null hypothesis that these correlations are zero, confirming the appropriateness of the SUR model (χ2(3)=92.8; p-value<0.001).
The empirical analysis finds a negative association of Stage-Gate management principles with speed and cost performance, as shown by the consistently negative and significant Stage-Gate coefficients across the different models in Tables 5 and 6. The results in Table 7 indicate that Stage-Gate is negatively related to quality performance, but the statistical significance is weak.
The results for the relationship between Agile management and performance are nuanced: the use of sprints is positively associated with higher speed, cost, and quality performance, as demonstrated by the corresponding positive and strongly significant coefficients across all models; in columns I and V of Table 5, the Agile-Feedback coefficient is negative and significant at the 10% level, suggesting that early and frequent user feedback is (weakly) associated with lower speed performance (Agile-Feedback instead has no statistically significant association with cost and quality performance). The Agile-Specification coefficients are not significant at conventional levels.
This study examines how the joint adoption of Stage-Gate and Agile principles relates to NPD performance. As regards speed, in columns II and V of Table 5, the coefficients of the interaction terms between Stage-Gate and Agile-Sprints are positive and significant. In columns IV and V of Table 5, the coefficients of the interaction terms between Stage-Gate and Agile-Specification are instead negative and significant at the 10% level. With regard to cost performance, the results in Table 6 show that the interaction terms are not significant. As to quality performance, in columns II and V of Table 7, the coefficients of the interaction terms between Stage-Gate and Agile-Sprints are positive and significant at the 1% and 5% level respectively.
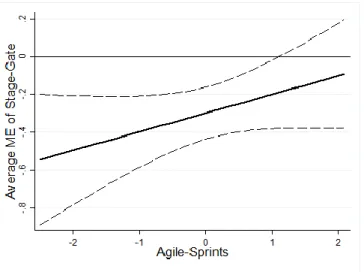
To properly assess the significance and magnitude of these interaction effects, we report the average marginal effect (ME) of Stage-Gate, as Agile-Sprints and Agile-Specification vary in the speed performance equation (Figures 1 and 2 respectively), and as Agile-Sprints varies in the quality performance equation (Figure 3). The MEs for different values of Agile-Sprints and
Agile-Specification are calculated based on the coefficients of the models with interaction terms added separately. We considered increasing values of Agile-Sprints and Agile-Specification
starting from the minimum to the maximum value in our sample. The 95% confidence intervals (the dashed lines in the figures) are estimated with the delta method.
As to speed performance, Figure 1 shows that the ME of Stage-Gate is negative and significant (at least at 5%) for values of Agile-Sprints below 1 (i.e., one standard deviation above its mean value). For values of Agile-Sprints above 1, the association between Stage-Gate and speed performance is not significant. This evidence suggests that the organization of NPD in time-boxed work cycles attenuates the negative association between Stage-Gate and speed performance. Conversely, Figure 2 shows that the ME of Stage-Gate is negative and significant (at least at 5%) for values of Agile-Specification above -1 (i.e., one standard deviation below its mean value). For lower values of Agile-Specification, the association between Stage-Gate and speed performance is not significant. This suggests that the simultaneous pursuit of Stage-Gate and the Agile principle of dynamic and delayed specification amplifies the negative association between Stage-Gate and speed performance.
Figure 3, illustrating the association between the joint adoption of Stage-Gate and Agile-Sprints principles and quality performance, shows that the ME of Stage-Gate is negative and
14
significant (at least at 5%) for values of Agile-Sprints below its mean. For values of Agile-Sprints above the mean, the ME of Stage-Gate is not significant. This indicates that, as for speed performance, the use of sprints weakens the negative association between Stage-Gate and quality performance.
(Insert Tables 5, 6, & 7 about here) (Insert Figures 1, 2, & 3 about here)
5.2. Common method bias
As information on both dependent and independent variables was collected from the same respondents, we acknowledge the potential for common method bias in our analyses. We assessed this as follows. As to procedural remedies, first we assured respondents complete anonymity, thus decreasing their tendency to provide socially desirable responses and/or be acquiescent or lenient when crafting their responses (Podsakoff, MacKenzie, Lee, & Podsakoff, 2003). A possible approach to overcoming self-reporting problems, matching data from two respondents, was not possible in our study, since collecting data from different respondents on dependent and independent variables separately would have made anonymity difficult to uphold. Second, we paid careful attention in designing the questionnaire to reduce item ambiguity (Tourangeau, Rips, & Rasinski, 2000). The questionnaire was presented in the respondent’s native language, avoiding double-barreled questions, and pre-tested with Italian developers, which helped us identify and replace a few ambiguous words. Finally, in our questionnaire, the Stage-Gate, Agile, and performance items were placed far apart, while we used a cover story to reduce the salience of the linkage between the variables. Questions were not labeled based on the reported constructs. This approach should increase “psychological separation” (Podsakoff, MacKenzie, & Podsakoff, 2012), reducing the likelihood of respondents guessing the relationship between the dependent and independent variables.
Common method bias was further assessed using statistical remedies. First, we conducted a Harman one-factor test (Podsakoff & Organ, 1986) loading all the items into an exploratory factor analysis. Factor 1 accounted for only 18.24% of variance, indicating that common method bias is unlikely to be a major concern. Second, we used a regression-based marker variable technique to correct for common method bias (Siemsen, Roth, & Oliveira, 2010; Podsakoff et al., 2012). Specifically, we used the respondents’ experience as the marker variable, which is not significantly correlated to the variables of interest in this study. Adding the marker variable did not change our results.
Despite their popularity, the aforementioned statistical remedies are subject to some criticism (Podsakoff et al., 2012). We therefore used an instrumental variable (IV) approach as a further robustness check. Specifically, we used two-stage least squares (2SLS) to assess whether our independent variables Stage-Gate and Agile-Sprints were significantly related to the three performance variables. In the first stage, Stage-Gate and Agile-Sprints were regressed on the IVs (and other variables included in the model). In the second stage, the performance variables were regressed on the predicted values of Stage-Gate and Agile-Sprints obtained in the first stage. To be effective, IVs must be correlated with the independent variable they intend to predict without being correlated with unobserved factors (such as those that may cause common method bias) that could affect the dependent variables. We considered as IVs a set of variables associated with the popularity of agile-related topics in the geographic area of the respondents (obtained from the frequency of search terms such as “agile” or “extreme programming” on Google trends), the level of digital literacy of firms in the respondents’ region (measured by the number of firms with high-speed Internet and number of employees that use computer devices), and the size of the community to which they belong. Our rationale is that these IVs are likely to relate to the respondents’ adoption of Stage-Gate or Agile
15
principles. However, it is unlikely that they are directly linked to NPD performance.9 The
results from the 2SLS estimation confirm the main finding on the negative (positive) association between Stage-Gate (Agile-Sprints) and performance.
Finally, our results show the presence of significant interaction effects for two survey-based variables. Support for interaction is unlikely to be an artifact of single-respondent bias, as it is implausible that respondents will consciously theorize interaction effects when responding to a survey (Makarius, Stevens, & Tenhiälä, 2017). Based on the study design and these observational and statistical tests, we conclude that the probability of common method bias is minimal.
5.3. Additional evidence
As additional evidence, we investigated the complementarity between the three Agile factors identified by the factor analysis. Table 8 shows the results from the SUR models on speed (column I), cost (column II), and quality (column III) performance. In column III, the coefficient of the interaction term between Agile-Sprints and Agile-Specification is positive and significant at the 5% level, showing their complementary effect on quality performance.
(Insert Table 8 about here)
6. Discussion and conclusion
6.1. Research implications
This study has implications for innovation management, NPD, and software development research.
The conceptualization of Stage-Gate and Agile as principles is an original contribution to literature, which has primarily assessed the adoption of these process models through tools and practices (Wood et al., 2013). Focusing on the inherent uncertainty and the resulting changes in innovation management, this study adds to research investigating what constitutes agility (Lee & Xia, 2010; Conforto et al., 2016), articulating the key principles behind linear and flexible NPD management, useful for both theory development and practice (Dingsøyr et al., 2012). We also develop novel measures to be further validated by future research. We complement the work of Serrador and Pinto (2015) by adding other relevant dimensions, such as process design, timing, mode of specification, and frequency of user feedback. Empirically, this is one of the few comparative Stage-Gate and Agile studies to provide quantitative as opposed to mainly qualitative (Petersen & Wohlin, 2010) or experimental evidence (Port & Bui, 2009). Our empirical design allows quantitatively testing the performance effects of the interaction of Stage-Gate and Agile thus far lacking in literature.
The results suggest that managing software development according to the Stage-Gate principles is associated with time and cost overruns. One plausible explanation is the inadequacy of linear models in highly uncertain and dynamic environments, such as software development (Dingsøyr et al., 2012). With the advent of the Internet, the software industry experienced dramatic growth and turbulence (MacCormack et al., 2001), entailing hundreds of technical standards, programming languages, applications, and myriads of new firms. Compustat data reported in Furr and Dyer (2014) rank software among the top three industries for technical and market uncertainty. When requirements are little known and unstable, instead of being sensible management choices, the extensive analysis and early commitment to product specification advocated by a linear approach become detrimental to performance, as Lenfle and Loch (2010) and Sommer et al. (2015) indicate. In fast-changing NPD contexts, preventing
9 F-tests on the joint significance of IVs in the first stage regressions reject the null hypothesis that the coefficients
associated with IVs are jointly 0. Furthermore, Sargan tests on the validity of overidentifying restrictions never rejected the null hypothesis of IVs being uncorrelated with the error term.
16
deviations through up-front planning is an elusive goal and, due to Stage-Gate’s scant flexibility in dealing with inevitable changes, is likely to result in delays and extra-costs (DeMeyer et al., 2002). However, this interpretation of our results warrants some caution as we do not directly measure the level of uncertainty, assuming it high based on existing research on the nature of software development and the industry as a whole (MacCormack et al., 2001; Furr & Dyer, 2014). Interestingly, Wysocki (2009) finds that no more than 20% of software development projects have the characteristics of stable NPD environments, and Petersen and Wohlin (2009) report weak performance of Waterfall methods even in their traditional home ground.
Our factor analysis suggests three distinct dimensions of Agile related to how uncertainty and the resulting changes are dealt with. In line with Lee and Xia (2010), we investigate the different effects of Agile principles on multiple aspects of NPD performance. Of the three dimensions, only sprints are positively associated with all three performance measures. Early and frequent user feedback is associated with on-time completion, but in a negative (albeit weakly significant) way. Gradual, dynamic product specification positively affects quality performance only in interaction with sprints, as our additional evidence shows. These nuanced results contribute to research assessing the relative importance of various Agile elements for different success measures (Sarker et al., 2009). While at an aggregate level, a flexible NPD management approach seems superior to conventional plan-driven development, as Boehm and Turner (2005) find, we concur with Wood et al. (2013) that Agile as a whole cannot be termed “the high performance software development method”.
More specifically, the finding that sprints result in better speed, cost, and quality performance offers preliminary indirect support to the claim of Lee and Xia (2010) that splitting development work in iterative time-boxed cycles allows overcoming the trade-off between inherently conflicting goals and achieving an appropriate balance between efficiency and extensiveness in response to uncertainty and changes. This result is not only relevant for the Agile research field, but also for lean start-up and design thinking advocating the use of rapid learning loops (Ries, 2011).
As to the (weak) evidence that early and frequent user feedback is associated with delays, a plausible, yet speculative, interpretation is that extensive beta testing may result in information overload without discerning high-priority from low-priority information (Lee & Xia, 2010), potentially causing bottlenecks, lack of focus, and slowing down the NPD process (Petersen & Wohlin, 2010). In the context of lean start-up implementation, Ladd (2016) argues that too much feedback may cause entrepreneurs to change ideas so frequently that they become disheartened. Of interest is comparing our results with those of MacCormack et al. (2001) and MacCormack and Verganti (2003) who measure NPD performance only with product quality. The former study finds a positive relationship between early beta tests and quality of the final software product, but no relationship between this performance measure and the number of beta releases in a project. This may partly explain the non-significant effect of Agile-Feedback
on quality in our study, which includes both items related to test timing and frequency. The latter study shows the positive effect of early feedback for high-uncertainty but not low-uncertainty NPD projects. As we do not measure project-level low-uncertainty, this factor may also partly explain the non-significant effect found.
Gradual and dynamic product specification has no direct association with any performance measure. While contrary to Bjarnason et al. (2012), this result is consistent with MacCormack and Verganti (2003) who find no significant gains from introducing late changes to new product design. They argue that late changes are not an indicator of flexibility per se, but may stem from poor planning or emergent information, and are as likely to improve as worsen performance. A positive relationship with performance is instead enabled by the right management mechanisms to deal with and benefit from late design changes. Our evidence of a
17
positive effect on quality of the interaction between Agile specification and sprints suggests that time-boxed iterations might constitute such a mechanism, rendering the change accommodation process prompt and systematic (Lee & Xia, 2010). However, this interpretation should be made with caution given that the measure of late changes that MacCormack and Verganti (2003) adopt differs from the Agile-Specification factor in this study. With the exception of such interaction, all other interaction effects between Agile principles do not reach acceptable levels of significance, thus failing to find other synergies among the Agile dimensions. This result is relevant for the debate on the merits of a holistic adoption of Agile (Cram & Newell, 2016).
This study informs the nascent and growing research on Agile-Stage-Gate hybrid models investigating the performance effects of integrating the two process models (Cooper & Sommer, 2016). The combination of Stage-Gate and Agile sprints is positively associated with both speed and quality performance, whereas the combination of Stage-Gate and Agile specification is negatively associated with speed performance. These results may help explain the mixed evidence in current literature, with some studies reporting synergies between the two approaches (Sommer et al., 2015) and others highlighting conflicts (Dikert et al., 2016).
On the one hand, the positive interaction between Stage-Gate and sprints can be explained by the insights of Karlström and Runeson (2006) showing that companies adopting a hybrid model use Stage-Gate as a macro-level NPD management framework for the longer-term planning of the main idea-to-launch stages, key milestones, roles and resources, and use sprints at a more micro-level to support shorter-term task execution. These authors report that sprints benefit Stage-Gate with microplanning, day-to-day work control, and progress reporting, whereas Stage-Gate provides a means of coordinating multiple development teams across functions and with senior management. As Stage-Gate and Agile act at different levels, sprints may be symbiotic rather than contradictory paradigms. Indeed, Cooper and Sommer (2016) include sprints as one of the three artifacts in their Agile-Stage-Gate hybrid model.
On the other hand, the explanation of the negative interaction effect between Stage-Gate and Agile specification seems rather intuitive. The two factors advocate conflicting principles (early, fixed vs. late, dynamic specification) that can hardly co-exist.10 The few existing studies on hybrid models indicate that when organizations build Agile into their existing Stage-Gate systems, they soften the typical rule of “freezing” the entire product specification at the outset in favor of a more dynamic approach that allows design changes for as long as feasible (Sommer et al., 2015).
Overall, our study in the software industry would not seem to support the enthusiastic claims on the immense performance potential of the hybrid Agile-Stage-Gate approach (Cooper & Sommer, 2016). According to our study, while Stage-Gate and sprints can be combined, the main effects of Stage-Gate on NPD performance (speed and cost) are consistently negative. Hence, for organizations that already employ a traditional gating system, the use of iterative, time-boxed development cycles could improve performance, and a hybrid model may therefore enable dealing with increased levels of uncertainty (Mangalaraj et al., 2009). However, when this is not the case, then an Agile-only approach would seem a better option. This finding informs literature on modified Stage-Gate (Ettlie & Elsenbach, 2007) and Agile adoption (Nerur et al., 2005).
6.2. Managerial implications
For innovation managers, this study advocates organizing development tasks in iterative sprints to increase performance. The solid positive association with multiple and typically
10 Dikert et al. (2016, p. 98), report that “[a] particular problem in collaboration between waterfall and agile
projects was that in agile, the software design was fleshed out over time as sprints progressed, but the waterfall method required a detailed design to be frozen upfront”.