Economics Student Theses and Capstone Projects Economics
2017
An Analysis of the Efficiency of the NFL Draft
Aryan von Eicken
Skidmore College
Follow this and additional works at:https://creativematter.skidmore.edu/econ_studt_schol Part of theEconomics Commons
This Thesis is brought to you for free and open access by the Economics at Creative Matter. It has been accepted for inclusion in Economics Student Theses and Capstone Projects by an authorized administrator of Creative Matter. For more information, please [email protected].
Recommended Citation
von Eicken, Aryan, "An Analysis of the Efficiency of the NFL Draft" (2017).Economics Student Theses and Capstone Projects. 41.
An Analysis of the Efficiency of the NFL Draft
By
Aryan von Eicken
A Thesis Submitted to Department of Economics
Skidmore College
In Partial Fulfillment of the Requirement for the B.A Degree Thesis Advisor: Qi Ge
Abstract
In the National Football League (NFL), teams with the worst record in the previous season are given the first opportunity to acquire the most talented players from college football through the reverse-order draft. Teams’ correct identification and selection of talent is vital to the effectiveness of the draft in attempting to competitively balance the league and allowing teams who struggled in previous seasons to compete for the title in the following year. This study analyzes all major positions independently and finds that first round draft choices on average do outperform later round choices, though there is a large amount of variability in each round which indicates inefficiencies throughout the process. Furthermore, findings indicate teams fail to consider many variables that effectively predict future success. This study is the first football related paper to utilize advanced analytics as a measure of productivity, though difficulties in measuring a players’ true productivity independently from his teammates illustrate the dilemma teams face when drafting players.
Acknowledgement
I would briefly like to acknowledge the significant help from both Yidi Wu, Jiebei Luo and Professor Qi Ge. Yidi Wu dedicated many hours of his own time making significant edits and improvements to the writing quality of this paper and without his aid, this paper would be a far lower quality. Jiebei Luo saved me many hours of working excel data by introducing me to a variety of excel short codes, thereby streamlining the data collection process. Professor Qi Ge contributed significantly to this by consistently giving weekly feedback and suggesting numerous ways through which I can improve this paper. Thank you again to these people.
I. Introduction
The first National Football League (NFL) draft was held at the Ritz-Carlton Hotel in Philadelphia on February 8th, 1936. The Philadelphia Eagles selected Jay Berwanger, the first player to ever be chosen although he never ended up playing in the NFL. Berwanger was the first of tens of thousands of players to enter the NFL through the draft, which is now a regular occurrence since its conception. The draft has become the most anticipated and publicized offseason event in the NFL, shown by the analyzing done by journalists on the upcoming draft, prior to the preceding NFL season even beginning (Easterling, 2016). The 2016 NFL draft garnered 8.2 million viewers on the first night, displaying the interest this event has gained over time (Welsch, 2016). Though it has now become a highly-publicized event, the initial reason for the introduction of the reverse-order draft was to increase competitive balance, as the league was being dominated by a select amount of teams. The purpose of the draft is to allow the worst teams an opportunity to improve as they are able to choose first from the incoming talent of that year, thereby, in theory, narrowing the gap between the best and worst teams in the league. Past research has not been able to identify a balancing impact, but it is still a profitable decision for league owners as drafted players have been
monopsonistically exploited by teams, due to their rookie contracts being significantly below their contributions to the team (Quinn, 2012; Krautmann, 1999; Krautmann et. al, 2009).
As past studies have shown, the draft has not had a significant competitive balancing effect (Quinn, 2012). This study looks to analyze the inefficiencies that cause this lack of balancing, as in theory, the NFL draft should have significant balancing effects. It will do so by measuring how effectively teams have drafted over the time period of 1999-2008. It will first analyze if players drafted early outperform players drafted later and subsequently will measure which pre-draft variables teams’ value and which actually impact career
first to look at all major positions and use advanced statistics to measure the productivity of players. It focuses on a time span of ten drafts and first analyzes the relationship between draft round and future performance. In this, I find that players selected earlier, on average, perform better though there are large variations in each position. At certain positions, such as tight end, results find that a player not chosen in the first round is highly unlikely to become an impactful player, while a lot of quality offensive lineman are still found in the later rounds. Subsequently, it measures what characteristics teams value when drafting players and what characteristics end up predicting career production. Through this, I compare the results and determine that teams appear to frequently overvalue strong athletic results from the NFL combine, while undervaluing actual production in college football for skill positions, thus indicating statistical discrimination towards less athletic players. Furthermore, certain positions such as quarterback, running back, tight end, linebacker and defensive back should be focused on in the first round of the draft, while other positions such as defensive end or offensive line can be drafted later. Following the initial results, I employ advanced analytics from profootballfocus.com over a shorter time span as the measure for productivity and find differing results from those found previously. Ultimately, I combine all my results and expand on my recommendations on how teams can more efficiently navigate the draft process as there are still clear inefficiencies in the current process. I then relate the results back to economic theories, discuss flaws of the study, and give suggestions for future research.
The rest of the paper is organized as follows. Section II introduces readers unfamiliar to the NFL draft to the process. Section III gives an in-depth outline and discussion of past literature both related to football and other major American sports, as well as predictions for the results of this study. Section IV discusses the data and variables used. Section V measures the relationship between draft position and future performance. Section VI examines which variables teams value when drafting and how those variables correlate with future
relates the results to the those found in the previous two sections. Finally, in Section VIII, I discuss the combined results found in sections V, VI and VII, suggest how teams can improve their draft and strategy, and give concluding remarks. All tables and regression results, as well as the glossary, are in the Appendix.
II. The NFL Draft Process:
The NFL draft is the process for new players to enter the NFL. Though the rules of the NFL do not state that a player must attend college, virtually all players play college football. Players with aspirations to make it to the professional level already heavily consider how each potential college could give them a boost in getting drafted into the NFL. Factors considered are coaching staff, past players from the school who have played into the NFL, and potential playing time. Many college players, especially quarterbacks, take a redshirt year in their first year as it allows them to keep their four years of eligibility to play collegiate sports. In this redshirt year, they practice with the team but are not allowed to play in any of the games. The earliest a player is allowed to declare for the draft is after being in college for three years. Therefore, the range of time most players spend at college varies from three to five years. During this time, they try to demonstrate their skills on the field, since their collegiate play is expected to have a large impact on their future career in football. Following a player’s declaration for the draft, a select amount of college players are invited to the NFL scouting combine, at which players participate in a variety of physical tests to demonstrate their level of athleticism; the most well-known of which is the 40-yard dash, as well as position specific drills. The physical drills are much simpler to measure for studies such as this one, as the position-specific drills tend to be those in which scouts rely on their experience to grade the player solely on the intangibles they see on the field, as no numerical measures can be recorded. Players not invited to the NFL combine still have the opportunity to run the same
drills at their respective institution’s “pro day”, a workout day hosted by all football programs with draft hopefuls. College and combine performance are the two components on which players are judged most heavily, though many aspects may not be measurable by statistics, which is something past studies and this study attempt to account for as much as possible.
One of the main reasons for the introduction of the NFL draft was competitive balance, as the reverse order nature of the draft gives the worst team in the league the first overall pick in the following draft, thereby having the first choice in choosing a player to improve their team. The reverse order continues throughout the seven rounds of the NFL draft in which each of the 32 teams owns a pick. Therefore, the minimum number of draft picks is 224. Additionally, teams are awarded compensatory picks for players they had lost in free agency the year
before, often leading to there being significantly more than 224 draft picks. All players that do not get drafted are free to sign with any team that wants to take a chance on them. This study does not incorporate the amount of talent missed on players who were not drafted, but suggests that this would be a future extension on the topic, considering in 2013, 31.8 percent of players who were on the opening day 53-man rosters were never drafted into the NFL (Dulac, 2014). A new addition in the last collective bargaining agreement (CBA) signed in 2011 was that the salaries for players drafted are not freely negotiable anymore. Nonetheless, it is extremely vital for teams to successfully choose talented players, specifically in the early rounds of the draft, as they will be spending a lot of money and cap space on those players.
III. Literature Review
The main goal of the literature review will be to analyze the past work in the field of sports economics pertaining to reverse-order drafts, specifically the NFL Draft. In the review, I will focus mostly on the data used, the methodology employed and findings of past studies about the draft that will impact my study. Since each sport does differ quite significantly, I will divide the review into two parts. One will specifically focus on American football, while
the other will discuss the drafts and measuring of player productivity in other sports leagues, mostly basketball and baseball.
There has been a significant amount of work in the literature pertaining to the NFL draft and the efficiency with which NFL executives are able to identify talent, but this research can also be expanded to the broader field of economics literature. Hendricks et. al (2003) used their study to measure the inefficiency of a labor market. Most labor studies have focused on the prejudice or bias based on certain characteristics. This is an example of
statistical discrimination. As described by Aigner and Cain (1977), statistical discrimination is a situation in which groups have the same true productivity, but one of them is still hired more often or paid a higher wage, due to the belief that the true productivity of them being higher than the rest. This is most often found in respect to race, gender, and age. The other model is called option value method, in which the employer can observe an employee’s true
productivity through different tests or a probationary period. Lazear (1981) finds that it is optimal to create this type of structure for an employer. It is more efficient if employees are first paid less than their value of marginal product (VMP) when they are new to a position, and subsequently earn more than their VMP later in their career. This creates large incentives for employees to be productive, which is something that employers look to create. An
additional factor in the hiring process is risk aversion. As Hendricks et. al (2003) points out, groups for which forecasting their true productivity is difficult could be at a disadvantage, though this also heavily depends on the cost of error. If errors do not cost the employer a significant amount, then they will be more likely to take risks in hope of gaining a higher payoff.
The goal in Hendricks et.al’s (2003) study is to measure the relationship between prior beliefs and expectations and the ex-post performance. This is challenging because most markets are not well suited for this study as they are biased towards the worker's ex-ante
expectations. Vrooman (2009) finds that the NFL is both the most competitively balanced and wealthiest league out of the four major sports leagues in the United States. Therefore, it is the perfect place to conduct an ex-ante-ex post study, as large amounts of money are involved and the players identified as better ex-ante are generally not put into situations in which they have greater opportunity. If anything, the players with the highest expectations end up being on worse teams, but with the great amount of competitive balance occurring in the NFL, this issue should be negligible. In most cases, first round choices are chosen at a position at which a team is lacking talent and therefore almost always is given an opportunity to play early in their career. Following the first round each team has had a selection and therefore each player theoretically had a chance to be on any team, therefore displaying equal opportunity for each player, which makes the NFL a perfect subject for an ex ante-ex post study. In addition, the rookie contract structure in the NFL is a great example of an option value structure, as it is not until players either sign a contract extension or finish playing under their rookie contracts that they are eligible to freely negotiate. While analyzing this aspect of NFL contracts is an
interesting topic, it is not the focus of this study. Their biggest conclusion is that they are able to identify systematic grouping during the draft process, indicating both effects of statistical discrimination and option value. In my study, I will be able to identify this more in depth and especially be able to more specifically analyze at which positions and to what degree players are being over/undervalued.
A topic more heavily discussed in the field of sports economics though also applicable outside of this field is the uncertainty of outcome hypothesis (UOH). The UOH is widely believed to be a prominent if not the leading explanation of demand for sports events, as it states that fans prefer a game in which outcomes are uncertain (Bird, 1982). This topic has confounded economists ever since Rottenberg (1956) attempted to measure the competitive balance in major league baseball. Zimbalist (2002) writes “Competitive balance is like wealth. Everyone agrees it is a good thing to have, but no one knows how much one needs.”
Reverse-order drafts were implemented to promote the competitive balance and thereby increase demand for sports leagues. Therefore, the efficiency with which team’s draft is vital to the effectiveness of the draft in respect to competitive balance as teams can only improve if they are able to correctly identify and select talent.
A. Articles focusing on Football
The first paper published attempting to examine pre-draft data’s impact on draft position and the players’ following performance was Hendricks et. al (2003), as they attempt to measure teams’ risk averseness in relation to the college attended by players drafted. To measure productivity at all positions equally, which is difficult since only four positions consistently have the ball, they used variables such as years played and percentage of active years in which a player made the pro bowl. Berri and Simmons (2009) correctly point out that employing these variables as measures of productivity are counterintuitive to the purpose of the study. This is because they use a type of evaluation of productivity impacted by decision makers to measure the effectiveness of the previous decisions also made by decision makers. Though this weakens their conclusions on the effect of future productivity, Hendricks et. Al (2003) do find that teams appear to prefer players from established football colleges in the early rounds of the draft while preferring taking risks later in the draft in hope of finding a star from a small school.
Massey and Thaler (2013) take a similar approach to Hendricks et. Al(2003) to measure the efficiency of trades during the NFL draft, but they also make the mistake of measuring productivity by assessing the number of games played in, the number of games started, and the number of Pro Bowl appearances. Despite their error in measuring
productivity, their results are very interesting because they find that teams overvalue the early picks in the draft. If teams were to overvalue their early picks that would mean that players picked early in the first round do not significantly outperform players chosen later in the draft,
which is precisely what I attempt to determine in my study. In a more recent paper, Kitchens (2015) attempts to determine if players who enter the NFL draft after playing for a successful team in college football are overvalued during the NFL draft. Similar to the past two studies mentioned, Kitchens tries to encompass all positions by measuring productivity in terms of years played in the league as well as “approximate value” (AV), a statistic created by
profootballreference.com that measures a player’s average productivity regardless of position. Though they do not publish their exact formula, it is an approach similar to ESPN’s QBR approach, in which they try to measure the performance as independently from other positions’ performance as possible. The AV used in this case is the first and only in the literature so far in which a paper employs a measure that is not a simple numerical statistic or one solely determined by decision makers’ evaluation of a player. The flaw with AV, which is also present in my study, is that the statistics employed are not published and therefore require researchers to trust in the good reputation that pro-football-reference.com, as well as its variety of sister reference websites, enjoy. In his study, Kitchens finds that players who come from respected football colleges are chosen earlier, but there is no evidence of it causing inefficiency in the draft process. Though these studies have flaws especially in their measure of productivity, they do indicate a certain level of risk averseness during the early rounds of the draft. Another flaw these studies have is that they target the characteristics they are attempting to analyze, but fail to sufficiently account for other factors such as college statistics, though those are not available for all positions. Therefore, I will analyze each position individually so that one can take college statistics into account. All of the three studies mentioned above encompass all players in the draft, which is similar to my study though they evaluate all players collectively whereas my study evaluates each position independently. In their effort to measure the overall productivity of players, they attempt to break a barrier that continues to harm other studies that are forced to focus solely on the
quarterback and wide receiver positions, due to those being the positions with the most individual player statistics.
By utilizing AV, Kitchens is the first sports economist to employ any advanced
statistic in a football targeted paper. This follows a trend found especially in baseball in which advanced sabermetrics have significantly altered the method in which executives attempt to successfully build teams. The variable most focused on in baseball is “wins above
replacement” (WAR). In baseball, it is far easier to measure players’ individual contribution to the game, since most of the actions performed by a player are independent of the rest of his team. Hughes et.al (2015) attempt to create a positional WAR for players in the NFL by measuring the impact of a player being injured or suspended. Though a creative idea, this approach has multiple flaws. They are unable to standardize an average replacement throughout the league, therefore making each measure above replacement team-specific. In addition, they also fail to consider different player packages, blurring the exact definition of the term “starter” for each team. Their results ultimately raise significant questions, as they find that no injury or suspension to any defensive player will alter a team’s predicted win total, therefore suggesting that individually defensive players are not vital to a team. Ultimately, a statistic similar to WAR in football seems unlikely to ever be possible, as football has much more facets than baseball and players’ performance is far more
interdependent. This is where advanced analytics such as those created by Pro Football Focus are far more accurate when attempting to measure each position’s productivity individually, and thus should be used in future economics research pertaining to this topic.
Berri and Simmons (2009), Boulier et. al, (2010) and Treme and Allen (2009) are most similar to my study since they analyze the relationship between draft position and the subsequent performance in the NFL, thereby analyzing the effectiveness with which
positions, so that they could employ more position specific measures for productivity, while my paper encompasses every position except fullback, special team’s specialist, and long snapper. The reason these positions were left out of my study is the lack of data on these positions, as well as the low frequency with which these positions are drafted.
Berri and Simmons (2009) focus on the relationship between college prospects, their draft position, and their ultimate performance. In this paper, they focus solely on the picking of quarterbacks. In their approach, they split their paper into three questions focusing first on the relationship between the player’s draft position and his subsequent performance; secondly, one the factors teams consider when drafting a quarterback; finally, on factors correlating with future performance in the NFL. This is the approach I plan to employ for my study since it encompasses how well an average player performs based on his draft stock, what teams look for in drafting players early, and what teams should be looking for in order to draft effectively. Since they focus on only one position, they can use more individualized statistics, allowing them to take into account common statistics such as Quarterback Rating (RAT), net points and QB score. The only issue, which the authors also admit to, is that these measures are not independent of the rest of the play of the offense. This is one aspect in which QBR, a statistic developed by ESPN, has garnered the most recognition throughout the football community in measuring the quarterbacks play independently from his teammates, but the issue with this statistic is that it is only available as of the 2006 season. Another aspect of Berri’s study that I will consider building into my own study is only keeping data points in which a quarterback has logged at least 100 plays, because otherwise, it could create outliers such as a backup playing one quarter far above his true skill level and subsequently not playing again, thereby biasing the true results. When focusing on the questions pertaining to draft data characteristics, they use NFL Combine data in combination with college
performance data and employ simple linear regressions to determine their results. The results themselves are quite surprising. They find that the level of play between early and late rounds
picks do not differ significantly, but the opportunity for early round picks to play is much higher. In addition, NFL executives appear to value taller, smarter, and faster signal callers, though statistically, they have no impact on future production. For example, one needs only to look at the current NFL in which players such as Drew Brees or Russell Wilson are elite quarterbacks in the league, but they do not fit those characteristics very well. A unique
process the authors employ is the attempt to measure the scouting ability. In this process, they regress the specific draft pick on college performance and the other draft characteristics. Then they save the residuals, thereby capturing everything they have yet to measure, which they suggest is scouting data in addition to other unobservable characteristics. Then NFL
performance is also regressed on the same variables as in the draft pick regression in addition to NFL experience. This then reveals whether the omitted scouting variables are important.
Building on the Berri and Simmons paper, Boulier et. al (2010) analyzes the effectiveness with which teams draft both quarterbacks and wide receivers. In addition to adding a second position to the paper, a major difference is that they focus on career production while Berri and Simmons measure each individual season of players. Their
argument for this decision is that a team “is interested not only in the average performance per play or per season but also in the numbers of seasons the individual will play.” To measure quarterback’s performance, they use the number of years played, the number of passes thrown, and the quarterback rating. For wide receivers, they use the number of years in the league and total yards of receptions. In their measurement of years played they take two different approaches: first, measure the number of years a player was in the league; second, measure the number of years he was an active player, determined by the player either catching or throwing a pass depending on which position they were analyzing. A flaw with the second form of measurement is that the authors set the barrier for being participatory in a team’s offense very low. It is extremely common for a backup quarterback to be inserted into the game in which the outcome is already evident, so as to not risk injury to the starter; this, on
the other hand, does not make him an important member of the team. In this regard, Berri and Simmons’ (2009) barrier of solely measuring quarterbacks who had thrown over 100 passes appears to be the more accurate cut-off point.
In their methodology, Boulier et. al (2010) initially measures each of the years from 1974-2005 individually by measuring the spearman rank of each draft at each position in order to calculate the correlation between draft rank and subsequent performance. In addition, they use a censored normal regression to analyze the relationship between draft round and future performance, measured in terms of years in the league. For quarterbacks, they find that in most years there was statistically significant evidence that players drafted early would perform better, though they only find this to be the case 15 out of 32 times when using quarterback rating (QR) as the measure of productivity. A likely explanation for this is that they do not drop outliers, such as one player who had only thrown five passes in his career, but completed all five of them and threw one for a touchdown, and therefore had a perfect QR. This problem would have been avoided with the technique previously mentioned by only using players who had thrown 100 passes in a season. For wide receivers, they find
statistically significant evidence that the earlier a receiver gets drafted the better his career productivity is for every draft year measured. In addition, they find that the years in the leagues decreased by each round for both positions. Ultimately, this article indicates that teams can effectively evaluate talent, though it appears that executives are more accurate when drafting wide receivers than quarterbacks. This indicates that inefficiencies differ by position, which is something I am attempting to measure in my study.
In an additional analysis of what characteristics impact the draft position and how that affects a player’s rookie season is conducted by Treme and Allen (2009), focusing solely on the wide receiver position. Additional to college and NFL combine performance, this study accounts for the frequency that a player is in the news. Employing OLS regressions, the
authors find that the three most significant factors that influence a wide receiver’s draft stock are media exposure in terms of times the player's name was mentioned in the news, speed, and past performance in college. An improvement of 0.1 seconds on the 40-yard dash correlates with a 12-spot increase. In addition, each reception in college corresponds to an about 4 spot improvement, which, especially in the first round can be the difference of several million dollars. If accurate, this approach displays massive flaws in the selection process, such as teams missing out on talented wide receivers that played on run-heavy college teams or a wide receiver that was only the No.2 wide receiver on his college team. They also find that players that have one standard deviation more articles written about them than the average player play in an average of 2.4 more games in their rookie seasons. With the slew of off-the-field issues such as the murder committed by New England Patriot standout, Aaron
Hernandez, and three-time pro bowler Ray Rice knocking his wife unconscious, damaging the NFL’s reputation, these results might be different if replicated with data over recent years. Currently, being newsworthy appears to have a negative impact on a player’s reputation and draft position. Still, it is important to notice how off-the-field factors can play into a player’s draft stock as well. Ultimately, these past studies demonstrate many good ideas that I will incorporate into my study; they also help me identify flaws for which I must control for in my data selection and methodology.
B. Articles on other sports drafts
Though each sport and league have its uniqueness, one can still learn about different methods of productivity measurement, methodological practices, and variables that impact draft stock from research conducted in other fields regarding the efficiency of drafting. Basketball is a field that has been heavily researched over the past years; mostly assessing the impact draft position has on productivity, and how much college productivity correlates with future pro-productivity. Berri et. al (2010) performs a similar analysis to the paper mentioned
in the previous subsection. In his study, he performs a simple OLS regression measuring productivity and other factors such as height, age, and college conference. He finds that scoring a lot has the biggest positive impact on your draft stock, while efficient shooting, getting assists and blocking shots were also significant values. Non-performance measures that played a large role include playing for a team that made the final four during the NCAA tournament and height. The surprising result, when regressing those characteristics on subsequent NBA performance, is that both points scored and being a champion in college have a negative correlation with future performance. This displays the inefficiency still present in the draft process as teams are under the impression that being on a winning team makes it more likely for them to be successful. In addition, scoring is something that has been found to be overvalued in many facets of the NBA such as salary determination and
employment discrimination, according to Berri et. al (2010). These inefficiencies in the process hurt the competitive balancing aspect of the draft. This is because if teams draft poorly they do not get better, which in turn hurts competitive balance and consequently revenue for both the team and the league, as past studies have found that fans desire competitive balance (Vrooman, 2009).
A similar paper is written by Harris and Berri (2015) on the same topic, but focusing on the WNBA. Unlike the past paper, they use a Poisson distribution model and Negative Binomial model to regress the characteristics on draft position in order to find the marginal effects at the sample means. Similar to the NBA article, height, points scored, assists and shooting efficiency all provided a boost in the player’s draft stock. Again, they find
inefficiencies in what statistics are focused on most, as points scored has the largest impact on the draft position, while it is actually shooting efficiency that carries over to the pro level. Ultimately, they conclude that both in the NBA and WNBA, executives are not very good at identifying and efficiently drafting talent. Out of a player’s perspective, one should focus on scoring as many points as possible in college and play in a strong division, as this offers the
largest draft boost and therefore increases earnings. These past articles display the large inefficiencies that are plaguing the second most balanced league of the major sports leagues in the United States. In addition, it appears that in college basketball the total amount of certain statistics is valued more than the efficiency with which these statistics are gained, which could be similar in the NFL. Though focusing on a different sport, these past two papers can be used for methodological applications as well as possible variables that could potentially be
included in my own model.
The third and final sport this literature review will outline is baseball. Due to the plethora of advanced sabermetrics that are available to measure baseball productivity, it would appear much easier to conduct basic studies on the MLB draft, but instead the MLB draft is the least discussed in economics literature. This is the case not only in academic literature but the coverage in sports journalism is also significantly lower than that for the NFL and NBA draft. A likely explanation for the lack of emphasis laid on the draft is the long path most players take before they even reach the major leagues, if they ever do at all, as only 17.2 % of signed draft picks made the major leagues from 1987-2008 (Baseball America, 2013). Nevertheless, economic studies that look to measure the inefficiencies have been performed on the draft process in MLB. The most heavily researched aspect of the MLB draft is the difference of return one gets from drafting a college player or a high school player. This became a major focus, after Michael Lewis’ book Moneyball (2003) states that scouts should give college players a premium as they are more likely to find success in professional
baseball.
Burger and Walters (2009) are the first economists to discuss the efficiency of the MLB draft. In their analysis, they find evidence that executives and scouts appear to make systematic errors when drafting. They find teams overvalue high school players in comparison to college players as the return was only 36% for high schoolers and 57% for collegians. In
addition, they find that teams significantly overvalue pitchers who had only an expected return of 34% while position players had 52%. The overvaluation of positions is one of the aspects I am looking to determine in my study on the NFL draft. If specific positions have a less certain rate of return it would be wiser for teams to draft the less risky position earlier and get a quality player while using multiple picks in the later rounds on the risky positions in which one could potentially find a gem, but the cost of error would be lower. The opportunity cost of taking a risk with a first-round pick in the NFL draft is significantly higher if scouts are more able to successfully identify talent at one position than the other, as they are risking the highly likely prospect of drafting a quality player at one position in order to draft a different position which the player is much less likely to pan out.
Caporale and Collier (2013) take a similar approach though over a smaller sample size focusing on the first five rounds of the MLB draft and they find results different from the previously discussed study. A difference in their study is that they use the advanced statistic of WAR, while the previous study use wins shared (WS). WAR has become the most commonly used measure of productivity throughout baseball; this implies that Caporale and Collier’s study should be more accurate. But a caveat one must take from these two studies is that advanced statistics, even in a sport in which it is easier to measure players’ performance independently, are not perfect. Sims and Addona (2016) are the latest to look into the
potential lack of efficiency in the MLB draft though they focus more specifically on the relative age of high school students. In their study, they find that executives overdraft the relatively older players, though the younger players are more likely to make the major
leagues. In addition to undervaluing relative youth, teams also undervalue youth itself, though once in the majors neither factors have an impact on a player’s production level. Based on the past three papers, there appear to be inefficiencies in the MLB draft process as well.
The goal of my study is to identify the inefficiencies that occur in the NFL draft, but unlike the previous football-related papers, I will employ advanced statistics to evaluate how effectively teams have drafted in past years. Based on past studies of the NFL draft and also the inefficiencies of other major sports, I expect to find inefficiencies in the NFL as well, especially at positions that are of great importance such as quarterback. I believe that teams could overdraft players who will not be as productive as they expect. I will also analyze which college statistics and characteristics correlate with good draft position and which result in true production in the NFL. I predict that at certain positions such as wide receiver, running back, and cornerback and maybe even linebacker speed will be overvalued, due these positions being running intensive and because of the overvaluation of speed in recent literature (Berri and Simmons, 2009). Overall, I do expect results to be consistent with those from other papers, such as there being a desire to choose players from an established program earlier, despite them having similar statistics and characteristics as players from smaller schools. Each position will likely have its own inaccuracies and from that, I will look to determine methods in which executives could more accurately identify talent and minimize opportunity cost by drafting positions in which there is a larger gap of talent earlier while waiting on other positions till later rounds in the draft. Using advanced analytics, I will bring a new approach to measuring productivity in this type of study in order to effectively analyze player’s productivity at positions whose productivity previously was only measured by games played and accolades. An interesting extension would be to measure if teams learn from their mistakes when overvaluing certain positions or characteristics. In baseball, this does not appear to be the case (Caporale and Collier, 2013). Boulier et. al’s (2010) measurement of whether certain teams are more skilled at drafting wide receivers and quarterbacks than others also appears to indicate that teams do not learn, as no team was significantly more successful at drafting than others. To put the conclusions of my study back into the larger economic field of labor, this study will identify a potential example of statistical discriminations in the NFL
that causes certain groups of players to be drafted earlier, despite their true productivity not being different than other groups of players. In addition, certain characteristics such as the type of football program, college production, age etc. can be seen as risk lessening, such that if these factors lead to players being drafted earlier, executives would confirm past labor studies in which they chose to be risk averse when the cost erring was higher (Heyma et. al, 2014), but instead took chances later in the draft. This study is unique in this field and will attempt to identify inefficiencies of a process vital to a league that in 2007 made revenues of $7 billion (Vrooman, 2009) and use the results to further the study of labor markets as a whole.
IV. Data Description:
The draft data was collected from the public website pro-football-reference.com and is therefore easily replicable. The website has data ranging from 1936 to current drafts, but the sample that I focused on was from 1999-2008. The decision to focus solely on these 10 drafts is due firstly to the availability of NFL combine data which is only available online beginning from 1999, and secondly because for any year later than 2008 one could have a significant issue measuring a player’s career performance, as there is a good chance that they are still active and could continue to be active in future years. Even for the 2008 draft, there are numerous players that are still active. Though this could cause slight inaccuracies in the results, the assumption is that any player that is still active over such a lengthy period will already have good career performance statistics and will not play much longer to add to their numbers.
The data collected from pro-football-reference.com was the round, pick number, and year in which a player was drafted as well as what position he was drafted for, what team he
was drafted by, what college he attended and his age at the exact point he was drafted. In addition to draft details, an array of career performance characteristics and statistics were gathered as well. These include the range of years in which a player was active in the NFL, the times a player was voted 1st team All-Pro, and to the Pro Bowl, the years in which a player was the primary starter on his team at his position, the amount of games a player has played, and the amount of games a player has started. The most important variable gathered is the Career Approximate value (CarAV), a measure created by pro-football-reference.com that attempts to measure a player’s approximate value throughout his career. The significance of this value is that it measures each player independently and can be used to measure
performance across positions. This value is the primary measure of overall performance used in this study. Certain other position-specific statistics such as QB record were also collected. The parent website sport-reference.com has a subsection for every major United States sport, and therefore also measures college statistics. The statistics were gathered for all
players that played quarterback (QB), running back (RB), wide receiver (WR) and tight end (TE), though data was often not available for players that attended a smaller college whose football program was not division 1-A. For quarterbacks, these statistics included passing yards, completion percentage, quarterback rating and other statistics while for the other three positions standard rushing and receiving yardages and averages were used. It must be noted that the career college statistics were utilized, instead of their final season in college. Either option would be valid, though analyzing if teams appear to value a player’s final year higher than his previous years would be a potential topic for a future study. This is an important distinction because players who received an earlier opportunity to play will have a higher total amount of statistics, as well as players who played throughout their entire four years of
Additional data was gathered from nflsavant.com as they have the entire dataset of all NFL scouting combine data from 1999-2015. Since the NFL combine is such a highly-valued event in the pre-draft process, it is vital to understand how to combine performance impacts draft position and NFL performance. This data includes height, weight, forty-yard dash time, twenty-yard shuttle, vertical leap, broad jump, bench press and Wonderlic test. A glossary for different variables can be found in the appendix. Players are not required to participate in all drills and many players who end up being drafted, especially in the later rounds are not even invited to the NFL scouting combine.
Additionally, a subset of advanced analytics from profootballfocus.com (PFF) will be used to incorporate the most advanced measure of performance by players in the NFL. In their process of measuring player’s performance, they use advanced statistics to measure each player’s individual performance during each individual play of the season. Due to this
precision and attention to detail, they are viewed as the leading advanced statistics website in football. Their reputation has grown so large that their ranks of positions are used weekly by all television broadcasters during their presentation of the starting lineup. PFF has begun to expand to college football as well, as they combined with the senior bowl event, an event that invites the best senior prospects in college football, to measure prospects performance at the event. The reason that this data was not employed throughout the entire study is because there was not enough available for seasons prior to 2008 as well as career data being very difficult to compile. Another drawback for PFF’s advanced statistics is that they come at a cost of $249 dollars per month, though one can request access for a quote. Though I only employ the advanced statistics for a subsection of the paper, they give a glimpse into the future of
measuring individual player’s performance which will impact future studies similar to this one, especially when more data becomes available.
V. Draft position and NFL performance
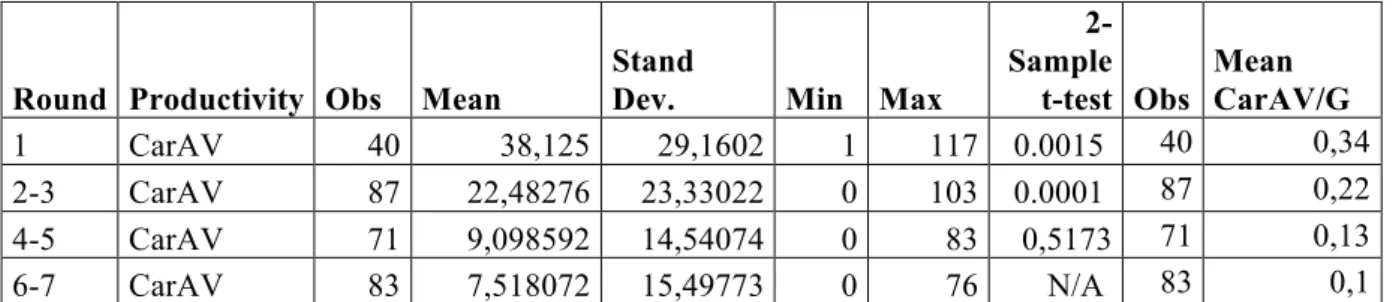
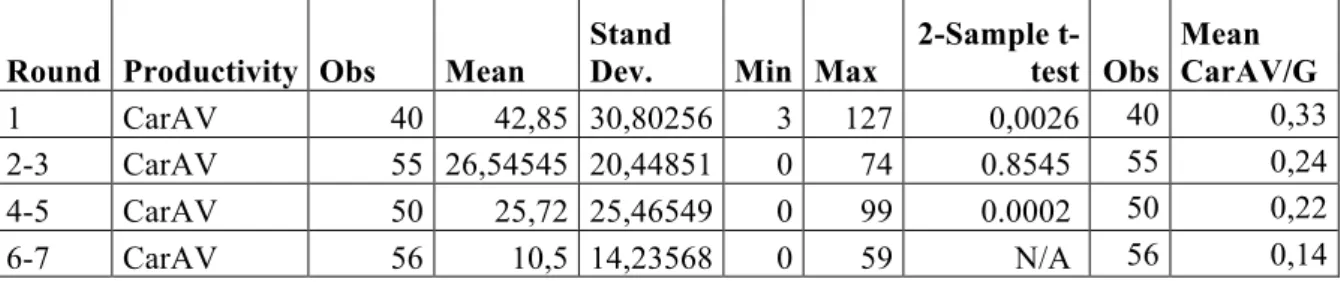
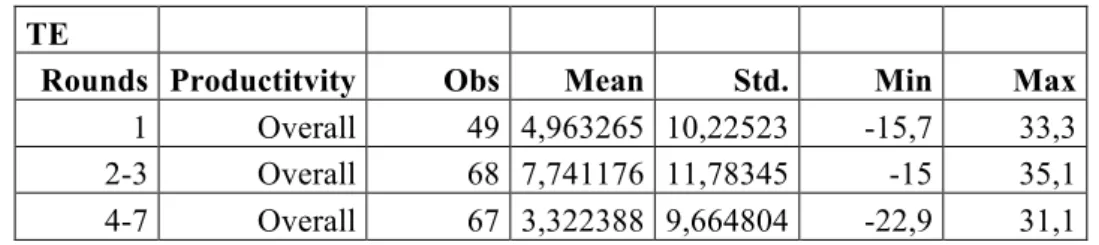
In order to present the differences in draft position, I have divided each position’s sample into four sub-samples. Due to the importance laid on the first-round of the draft and the significant drop in salaries and signing bonuses following the first round, it was measured individually. The other rounds were split into sections of rounds 2-3, rounds 4-5 and rounds 6-7. I will use the average “CarAV”, a measure that measures the approximate value of a player throughout his career, and its distribution to display the differences in NFL performance between players drafted in different rounds. The results can be found in Table-A where each position has its own subtable. Supplementary, scatterplots displaying the relationship between “PICK” and “CarAV” can be found at the end of the appendix. The results for every position, other than punters, display that the average “CarAV „drops off from each section to the subsequent one, indicating that teams are successful in choosing successful players early in the draft, though in most cases the standard deviations are extremely large, indicating large variations inside each subsection. The large variations are very noticeable in the scatterplots as well, though the a trend of “CarAV” being greater for the earlier picks is noticeable in all five scatter plots, though it is more prevalent for certain positions such TE. Furthermore, to confirm that there are statistically significant drop offs between individual rounds, I conduct 2-sample t-tests in order to give statistical evidence that the mean “CarAV” are different between each section. The results are presented such that the probability results found in a specific row are the test between that specific section that follows directly underneath. For example, the probability of .0009 found in Table A-QB in the “round 1” row indicates that when running a 2-sample t-test between “round 1” and “round 2-3” the results indicates that the population mean of average production of first round quarterback is significantly different from the population mean of average production of a second or third round quarterback.
Since the goal of this study is to measure the efficiency of the NFL draft, it is
important to note the differences in means, as positions in which the differences in means of draft rounds are small, it might be more efficient for a team to wait until the later round to draft that position and instead draft a player at a position in which there is a large drop off early. For example, when examining the quarterback results in Table A-QB, it is apparent that the mean CarAV for a quarterback drafted in the first round, 57, is much larger than that of the following three sections, 18.65,10.23 and 13.3. The standard deviation is also significantly larger in the case for the round which signifies the risk there is when taking a first-round quarterback, as he has the potential of being a highly productive quarterback, but could also be a large draft bust. The results from the 2-sample t-tests find that mean production for a first-round quarterback is significantly different from that of a second or third round
quarterback, but when comparing the following rounds, there is no evidence that the average quarterback taken in the second or third round will perform better than an average one taken in the sixth or seventh round.
A drawback to the usage of “CarAV” is that the only way to gain approximate value (AV) is to play; therefore, an argument can be made that it will entail similar flaws affecting other studies mentioned in the literature review, though not to the same extent, as in this case their performance on the field is still included. This flaw is that the same decision makers who influence the drafting of a specific player also impact who plays during the season, and
therefore, especially earlier in their careers, players who are drafted with higher expectations in the early rounds will be given more opportunity to play and thus will have more chances to gain approximate value. This form of bias could be the explanation for why the minimum “CarAV” at all positions for players selected in the first round is greater 0, while at all positions other than guard and center the minimum for all other rounds is 0. Due to the large amount of resources invested into a first-round draft pick, team’s coaches and management likely feel the pressure to play their first-round player, while a player drafted later is more
likely to get released if a lack of talent or production is detected early. The optimal method to counteract this weakness would be to measure “CarAV” per snap played, but that data is not available for a player’s entire career. The two measurements available to correct this flaw are games played (G) in and games started (GS) in. For a position such as quarterback or center in which starting normally implies playing the entire game, GS would be an optimal correction, but since most positions do not have the same player playing the entire game, this would likely overcorrect the bias, as backup players would gain AV without actually starting in the game. Therefore, I decided to measure “CarAV/G” to mitigate the advantage players drafted earlier have. “CarAV/G” measures the amount of AV a player gains per game throughout his career. Though controlling for this appears to lessen the differences between means, it is still evident that the mean “CarAV/G” decreases throughout by each section of rounds,
demonstrating that players drafted early are more likely to succeed at the professional level. When applying these results to how teams should draft, one must consider both the means discussed above as well as the standard deviation. The greater the standard deviation is for “CarAV”, the riskier choosing that position will be. Teams will prefer to draft positions at which there is less risk early but will prefer a position with a higher standard deviation in the later rounds, as there is a chance that one finds a great player without having to use an early pick on that position. For that reason, one must balance analyzing the mean and the standard deviation when deciding which positions should be drafted earlier. Therefore, positions such as quarterback(QB), running back (RB), tight end (TE),linebacker (LB), and defensive back (DB) appear to be positions that if a team has a need at this position, they should use an early draft choice in order to get a quality player, as the drop off in average production is immense. For other positions such as guard (G) or defensive end (DE), the likelihood for drafting a quality player in the second or third round is almost identical to finding a productive player in the fourth or fifth round, therefore indicating that teams should rather draft a different position in the second or third round and instead use a later round pick for one of these positions.
Interestingly, the results for the game’s most important position, QB, are unique as even though there is a large gap in the mean of both “CarAV” or “CarAV/G” between the first round and any of the later rounds, the standard deviation is extremely high, indicating that one might draft a great player, but at the large risk of drafting a terrible player. Since the position is so vital, it is justifiable for teams to take this risk if the need for a quality starting
quarterback is large. Ultimately, teams should attempt to fill their positional needs by waiting for certain positions till later in the draft, while for positions such as TE, it appears unlikely to be able to draft a top 10 tight end outside of the first round.
VI. Determining draft position and future performance
A. Methodology
As previously discussed, almost all players enter the NFL through the draft and previously attend a college at which they play football to impress NFL talent scouts.
Following their time at college, many of them were invited to the NFL scouting combine and were put through a variety of tests. The goal of this section is to determine the impact that these college statistics and combine results have on a players’ draft position. The only four positions for which college statistics were used were Quarterback, Running Back, Wide Receiver and Tight End, as offensive line college statistics were not available and defensive college statistics are not representative enough of their true level of play as well as not available for the time period over which this study is performed. For each of the four positions, the college statistics most representative of the performance were selected to be included in the regression. A flaw necessary to mention is that statistics of players from small schools were not always available. In addition to the college statistics, combine data is
Methodology 1:
𝑃𝐼𝐶𝐾% = 𝑏(+ 𝑏*∗ 𝐷𝑟𝐴𝑔𝑒 + 𝑏1∗ 𝑡𝑤𝑒𝑛𝑡𝑦𝑠𝑠 + 𝑏7∗ 𝑣𝑒𝑟𝑡𝑖𝑐𝑎𝑙 + 𝑏>∗ ℎ𝑒𝑖𝑔ℎ𝑡 + 𝑏@∗ 𝑓𝑜𝑟𝑡𝑦𝑦𝑑 + 𝑏D∗ 𝑏𝑟𝑜𝑎𝑑 + 𝑏E∗ 𝑏𝑒𝑛𝑐ℎ + 𝑏F∗ 𝑃𝑜𝑠𝑇𝑒𝑠𝑡 + 𝑏H∗ 𝐶𝑜𝑙𝑙𝑒𝑔𝑒𝐴𝑃𝑇𝑜𝑝25 + 𝑏*(∗ 𝑃𝑜𝑠𝐶𝑜𝑙𝑆𝑡𝑎𝑡𝑠 + 𝑒%
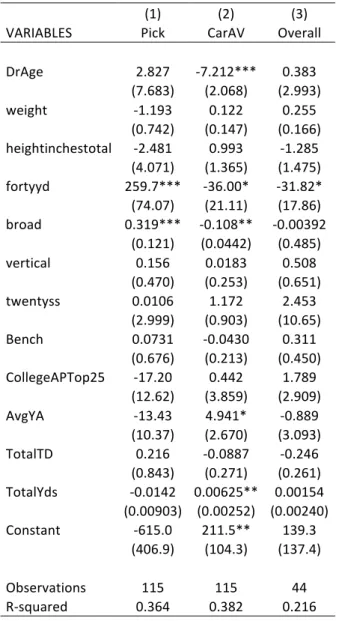
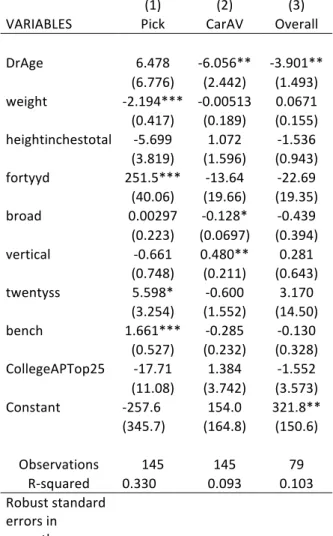
The variables other than “PosTest” and “PosColStats” are standard for all positions’ methodology other than quarterback in which “vertical” and “bench” are not included due to lack of participation in those drills. In the above-presented methodology “PostTest” represents the combine tests that were position-specific such as the Wonderlic test, for which data was only available for quarterbacks. “PosColStats” is also representative of numerous position specific college statistics that were included for each position, as statistics measuring quarterbacks differ from those for running backs. The dependent variable that I decide to measure is “Pick”, which represents the exact draft pick a player was drafted at. This variable is chosen as it is more specific than simply using draft round, since there is a large difference in being chosen as the first pick in a specific draft round in comparison to someone being chosen as the last pick of that draft round. Since the goal of players is to get picked as early as possible and the teams pick who they believe are the best players early in the draft, a negative coefficient indicates an increase in a variable will lead to an improvement in draft position. Again, each regression was estimated for each position individually. All results can be found in the appendix in each position-specific Table B subsection. The second model contains the same independent variables as the first, but to measure their impact on NFL performance, CarAV is inserted as the dependent variable. The presentation of the results is divided into different subsections to present the results in the most effective manner. Additionally, all results are estimated using robust standard errors.
Methodology 2:
𝐶𝑎𝑟𝐴𝑉% = 𝑏(+ 𝑏*∗ 𝐷𝑟𝐴𝑔𝑒 + 𝑏1∗ 𝑡𝑤𝑒𝑛𝑡𝑦𝑠𝑠 + 𝑏7∗ 𝑣𝑒𝑟𝑡𝑖𝑐𝑎𝑙 + 𝑏>∗ ℎ𝑒𝑖𝑔ℎ𝑡 + 𝑏@ ∗ 𝑓𝑜𝑟𝑡𝑦𝑦𝑑 + 𝑏D∗ 𝑏𝑟𝑜𝑎𝑑 + 𝑏E∗ 𝑏𝑒𝑛𝑐ℎ + 𝑏F∗ 𝑃𝑜𝑠𝑇𝑒𝑠𝑡 + 𝑏H ∗ 𝐶𝑜𝑙𝑙𝑒𝑔𝑒𝐴𝑃𝑇𝑜𝑝25 + 𝑏*(∗ 𝑃𝑜𝑠𝐶𝑜𝑙𝑆𝑡𝑎𝑡𝑠 + 𝑒%
B. Quarterback
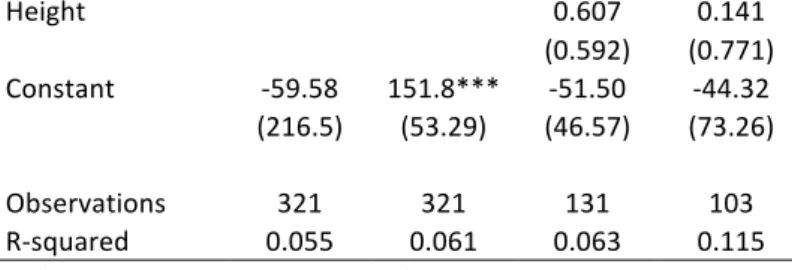
Table B-QB reports that at the quarterback position, traditionally regarded as the most important in football, only the Wonderlic test, forty-yard dash, and broad jump were
statistically significant in methodology 1, which is consistent with past studies done on this position (Berri and Simmons, 2009). However, it is surprising nevertheless that college statistics did not have a significant impact on a quarterback's draft stock. Both forty-yard dash and the Wonderlic were significant in the expected direction, i.e. the faster a quarterback was and the higher he scored on the Wonderlic, the earlier he was drafted. The surprising result was that the broad jump, which was statistically significant at the 1% level, implies that the farther a player jumps the later he will be drafted. There is no logical explanation for this result, as there is no reason why having the ability to jump greater distances would limit your ability to play quarterback, therefore outliers and the lack of a greater sample size are more likely to be the cause unless it is correlated with an unobserved omitted variable. No variable significantly affecting draft stock has a significant impact on career performance. Instead, drafting both younger quarterbacks and quarterbacks who had a high completion percentage in college end up having better professional careers. Not only were these values significant, but players predicted CarAV increased by 14 points for one additional year subtracted from their DrAge and having a one percent higher completion percentage in college is also correlated to 4.9 unit increase for CarAV. It appears that for the most important position in football, the measurable values that help boost a players’ draft value do not actually correlate
with future performance, and that combine tests for quarterbacks are irrelevant for predicting their future career.
C. Running back
Similar to the quarterback position, there appear to be significant differences between the variables that significantly impact draft position and the variables that actually
significantly predict future NFL performance in terms of CarAV, as can be seen on Table B-RB. Not surprisingly, teams value speed when drafting a running back which is evident by the forty-yard dash being significant at the 1% level when relating it to “PICK.” Though only significant at a 10 % level, running a 0.1 second faster time at the forty-yard dash corresponds to a predicted 3.5 slot increase in future production. For reference, the majority of 40-yard dash times fall in between 4.4 and 4.6 seconds for running backs, with the fastest being 4.24 seconds and the slowest ones being around 4.8 seconds. Once again, a better broad jump has the significant impact of being chosen later in the draft, as well as not having a very
productive career. These results are very surprising especially for a position such as running back in which athleticism is heavily valued. The age at which a running back is drafted also appears to have an impact on the career performance of a back, as being just one year older lowers a running backs career approximate value by 7 points. What is important to note is that two of the college statistics, “AvgY/A” and “TotalYds” are statistically related to career productivity, but not to “Pick”. This indicates that scouts appear to be more intrigued by the physical attributes and potential of a player instead of basing their evaluation on past
production, even if college football is not as competitive as the NFL.
D. Wide Receiver
The wide receiver position continues the trend of the first two skill positions in which the 40-yard dash significantly improves draft stock significantly, as an increase by 0.1
seconds increases draft position by 26 slots, despite the actual impact on NFL performance being insignificant. Another factor that impacts the draft position in a meaningful way, though not having a large effect on productivity is draft age, as each additional year leads to a player being picked 12.5 slots later. This is especially interesting since in both of the previously mentioned positions age did not impact draft positions but did significantly impact career production. The results indicate that coming from a college team that was ranked in the top 25 of the APTop25 poll at the end of their college season significantly improved a player’s draft stock, as that improves the estimated draft position by 37 slots, which is more than an entire round, while not having a significant impact on productivity. When drafting, teams appear to accurately value “TotalTD” as it both significantly improves draft position and predicts future performance. This is similar for “AvgYards/Rec”, as each average yard increase corresponds to a 6 slot improvement in draft position and 3 unit “CarAV” improvement. Surprisingly, the Vertical leap, which one would expect to be valued for a wide receiver and is also positively statistically related with productivity, though only at the 10% level and with a small
coefficient, is not only insignificant when predicting draft stock, but even the insignificant sign is over one standard deviation in the opposite direction of what would have been
expected. This trend that NFL scouts seem to be valuing many of the variables I am analyzing in an incorrect fashion appears to continue, though in the case of wide receiver they did take college statistics into account in an effective manner, which was not the case in the prior two sections.
E. Tight End
Similar to the other three positions, teams seem to highly regard the NFL combine tests, though in the case of the tight end most of them actually significantly predict future performance as well. The only combine variable statistically related to draft position that does not impact future production is the “Twentyss”. Otherwise, “Weight”, “Fortyyd” and
“Vertical” all significantly impact a player’s draft position as well as career performance in the expected direction, as better performances in any of these tests is correlated with being drafted earlier and having a higher career approximate value. It is important to note that the coefficient sizes, especially for future production, are at a size where the difference between the max and min of the sample only accounts for about 10 units of AV for both “Vertical” and “Weight“. What is intriguing is that two of the college statistics significantly impact
productivity in directions one would not expect. Both “TotalTD” and “AvgYards/Rec” are statistically related in the direction that having more touchdowns and higher average receiving yards per catch lead to a lower predicted career value. This is especially interesting as it is the opposite of what was found for wide receivers, where a higher “AvgYards/Rec” predicts more career success. One the other hand, “TotalRecYds” is statistically related in the expected direction. Based on these results it appears that when drafting, teams desire a combination of speed and strength which is intuitive as the tight end position is the position in which both the ability to make downfield plays with the ball as well as the ability to block is vital. The large inclusion into the passing game for tight ends is a relatively new development in the game of the football, which even in 1999, the beginning of this sample, was not as prevalent as it is currently. This could be a partial explanation for why teams did not value college receiving statistics as heavily. It is important to note as well that statistics to measure blocking are not available, especially at the college level, making it difficult to measure that aspect on the draft position of a tight end. Though some may make the argument that the “CarAV” measurement could be biased towards receiving tight ends, this not likely the case, at least not significantly, because “weight” does significantly impact CarAV, which would be expected as blocking tend to be heavier than then average receiving tight end.
Due to the similarities of the three position of tackle, guard, and center, I will combine these three positions into one discussion, though their regressions were all run separately as can be seen in tables B-T, B-G, and B-C. It is important to note that for these positions, no college statistics are available, as blocking statistics are only beginning to be developed in advanced analytics and currently only for the NFL. As one can see on the table, there is not a significant variable in either regression for centers. This is different for both guards and tackles. For both positions “Fortyyd” is significantly related to both draft stock and career value and in both cases, the coefficients state that the faster you are the earlier you are drafted, and the better your career value will be. A result also in line with expectations is that weight is valued by teams at a significant level for tackles during the draft, and it significantly improves players predicted “CarAV” as well. The results for tackles follows the expectations as both size and athleticism are important when blocking the opposing defender. Speed being the only significant value for guards is somewhat surprising as when considering offensive lineman draft workouts one generally does not think that the 40-yard dash is extremely important, as straight speed is not very frequently employed. Teams could consider good speed an indicator for athleticism and therefore lay emphasis on it, and it appears to predict professional
productivity as well. When drafting tackles, it appears that teams also appear to value a successful college program when considering a player as being on a top 25 team lowers a players predicted draft position by about 32 spots. An explanation for the lack of statistically significant values for the center position could be that this position is slightly different in technique than the other two, and therefore scouts may look at specific things related towards the technique of certain players instead of the physical attributes.
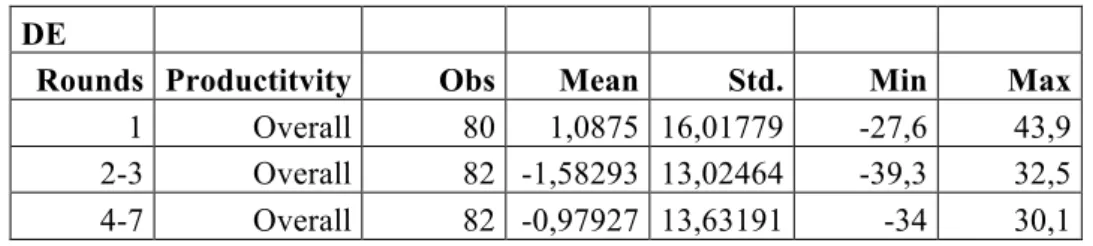
G. Defensive End
As reported in table B-DE, every variable except for height and playing for a top 25 college team are significant in one of the two regressions, but not a single variable is
significant in both regressions, indicating that the variables that teams value when drafting are the exact opposite of the ones they should be. It is surprising that the more a player bench presses the later he is drafted and the later his predicted draft position is, as it is
counterintuitive since one would think that strength is considered vital when overpowering offensive lineman. Both speed combine drills, “Fortyyd” and “Twentyss”, as well as
“Weight” are significant in the direction that the faster and heavier a player is, the earlier he will be drafted. The 40-yard dash appeared to have the biggest impact on draftposition as even a .05 second improvement led to being drafted 13 picks earlier. The tests that are significantly correlated with career NFL performance are “DrAge”,” Broad” and “Vertical”. The older a player is when being drafted, the lower his career productivity is, which is logical as he has less time in his peak to perform highly, and the higher a player jumps in the “Vertical” the better his career productivity is. The surprising result is that the farther a player jumps in the broad jump, the less productive he is predicted to be over his career. Similar to the running back and quarterback position, there is no logical explanation for this trend, as athleticism tends to help a player’s production on the football field, though in this situation the coefficient is so small that the difference between the max and min broad jump will only result in a 5-point drop in “CarAV”. It appears that at least when only considering combine data, NFL decision makers are not very effective in valuing the tests that are most indicative of future performance.
H. Defensive Tackle
Different from the previously mentioned defensive line position, the variables in Table B-DT that are significant are significant in both regressions for all but two variables. One case is that results suggest that teams appear to draft a player later who jumps higher in the vertical leap, though the small coefficient indicates that this will have a maximum impact of 12 draft spots, as the greatest vertical leap was 12 inches higher than the smallest, though in the first
round a difference of 12 picks is a difference of millions of dollars. The second difference is that teams appear to prefer DTs from successful college teams, though that has no correlation with future performance. The other four variables that are statistically related to both “Pick” and “CarAV” are “Weight”, “Fortyyd”,” Bench” and “DrAge”. All of the coefficients are in the expected direction: the heavier a player is and the better performances in the bench press and forty-yard dash are; the earlier a player is drafted and the better his career value is; the older a player is when being drafted, the later he gets chosen and the lower his career value is. These four variables are intuitive when analyzed in terms of football logic since it is important for a defensive tackle to possess strength, size, and agility. Especially the bench press can significantly improve your draft position as the difference between max and min was 29 reps, which would correspond to a 29-slot improvement in draft position. The teams seem to be evaluating talent in an efficient manner, though teams should shy away from overvaluing players from successful programs.
I. Linebackers and Defensive Backs
Despite their positions being quite different, the lack of significant results in either of these sections, as is illustrated by Tables B-LB and B-DB, is the reason these two positions are discussed jointly. For both positions “DrAge” has a significant impact on both “Pick” and “CarAV” in an expected manner. In both cases, the older a player is the later he is drafted and the worse his predicted career productivity is. For the linebacker position, another significant variable is the 40-yard dash, which predicts that the faster one runs the earlier one is picked and the more productive of a career one has. In addition, weight has a positive significant impact on predicted career performance. Another significant variable other than “DrAge” for defensive backs is being on a top 25 team, which NFL teams appear to value, despite it having no predictive value on their future performance. Defensive backs’ performance at the 20-yard shuttle is significant at the 10 percent level, indicating that teams at least value one measure of