Automated Data Collection, Analysis, and
Archival
Dr. Peter T. Martin, Associate Professor Civil and Environmental Engineering
Peng Wu
Research Assistant
Department of Civil and Environmental Engineering University of Utah Traffic Lab
122 South Central Campus Drive
Disclaimer
“The contents of this report reflect the views of the authors, who are responsible for the facts and the accuracy of the information presented. This document is disseminated under the sponsorship of the Department of Transportation, University Transportation Centers Program, in the interest of information exchange. The U.S. Government assumes no liability for the contents or use thereof.”
TABLE OF CONTENTS
1. Introduction... 1
1.1 Problem Statement ...1
1.2 Research Scope ...1
2. Literature Review ... 5
2.1 Development of Archived Data User Service ...5
2.2 Overview of Existing ITS Data Archiving Practices ...6
2.3 Case Studies ...8
2.4 Summary of Findings ... 12
3. CURRENT TMS DATA COLLECTION AND ARCHIVING ... 15
3.1 ATMS Elements... 15
3.2 TMS Data Collection... 16
3.3 TMS Data Storage and Processing... 17
3.4
Delay On-Line ... 20
4. Archived TMS Data Needs and User Requirements... 25
4.1 Potential Users and Applications for Archived ITS Data ... 25
4.2 Process of Establishing TMS Data Needs... 27
4.3 Summary of Data Needs Survey... 28
5. Development of Performance Measures ... 31
5.1 Available Performance Measures ... 31
5.2 Performance Measures Modeling ... 31
6. TMS Data Archiving System Architecture ... 39
6.1 Conceptual Architecture of TMS Data Archiving System... 39
6.2 Data Aggregation ... 42
6.3 Data Storage ... 43
6.4 Database Management System... 44
6.5 User Interface ... 45
6.6 Software/Hardware Requirements ... 48
7. Data Quality Control ... 51
7.1 Error Patterns... 52
7.2 Error Detection ... 52
8. System Transformation Plan ... 59
8.1 Recommended Development Methodology... 59
8.2 Immediate Next Steps... 59
8.3 Step-by-Step Approach... 59
9. Risks, Resources, and Estimated Costs ... 63
9.1 Critical Success Factors and Risk Factors ... 63
9.2 Resources... 63
9.3 Time and Cost Estimates... 64
10. Conclusions and Recommendations ... 67
10.1 Conclusions ... 67
10.2 Recommendations ... 67
References ... 71
Appendix 1. Survey Form ... 73
Appendix 2. Interview Tables 1-10... 75
LIST OF FIGURES
Figure 1.1 Research Process...3
Figure 2.1 National ITS Architecture ...5
Figure 2.2 Investigation of ITS Data Uses in HPMS...8
Figure 2.3 Architecture of PeMS...9
Figure 2.4 Example of PeMS Data Quality Check...10
Figure 2.5 Traffic Data Acquisition and Distribution Framework...11
Figure 3.1 ATMS Architecture Diagram...16
Figure 3.2 Layout of Traffic Monitor Station ...17
Figure 3.3 Current TMS Data Storage Process ...18
Figure 3.4 Delay On-Line User Interface...20
Figure 3.5 Volume/Capacity along I-80 WB ...22
Figure 3.6 Site-Specific Performance Measures Interface ...23
Figure 3.7 System Wide Delay Summaries by Hour ...23
Figure 3.8 Real-time Speed along I-80 EB...24
Figure 5.1 Data Flow of Performance Measures Calculation...32
Figure 5.2 Traffic Variability and Reliability Algorithm...37
Figure 6.1 Logical Architecture of TMS Data Archiving System...40
Figure 6.2 Physical Architecture of TMS Data Archiving System ...41
Figure 6.3 Multi-dimensional Implementation of TMS data ...45
Figure 6.4 User Interface 1...46
Figure 6.5 User Interface 2...47
Figure 6.6 User Interface 3...48
Figure 7.1 TMS Data Detection and Imputation Procedure ...51
Figure 7.2 TMS Data Error Patterns Example ...52
Figure 7.3 Variation of TMS Data Error Distribution ...53
Figure 7.4 Illustration of Neighboring Detector...56
LIST OF TABLES
Table 2.1 Examples of Existing ITS Data Archiving Practices...6
Table 2.2 Summary of Loop Detector Data Archiving Practices...12
Table 3.1 20-second TMS Data Sample ...18
Table 3.2 15-minute TMS Data Sample ...19
Table 3.3 Delay On-line’s Performance Measures...21
Table 3.4 Corridors List ...21
Table 4.1 Potential Users and Applications for Archived ITS Data...25
Table 4.2 Data Needs Survey List ...28
Table 4.3 Data Needs ...29
Table 5.1 Performance Measures ...31
Table 6.1 Comparison of Data Size at Different Storage Level...42
Table 6.2 Storage Media Features...43
Table 7.1 Data Error Types...52
Table 7.2 Statistical Analysis of TMS Data Erros...54
Table 7.3 Performance Classification of TMS...54
Table 7.4 Suggested TMS Data Error Imputation Model...55
LIST OF ACRONYMS
ADMS Archived Data Management Subsystem ADUS Archived Data User Service
ATMS Advanced Transportation Management System DBMS Database Management System
DOL Delay On-line
EB Eastbound
ER Entity-Relationship model FHWA Federal Highway Administration
HPMS Highway Performance Monitoring System HOV High Occupancy Vehicles
ITS Intelligent Transportation System
MAG Mountainland Association of Governments MPO Metropolitan Planning Organization NB Northbound
PeMS Performance Measurement System
SB Southbound
SDEV Standard Deviation SVG Scalable Vector Graphics SQL Structured Query Language
TDAD Traffic Data Acquisition and Distribution TMC Traffic Management Center
TMS Traffic Monitoring Station TOC Traffic Operation Center TTI Travel Time Index
UDOT Utah Department of Transportation UTL Utah Traffic Lab
VHT Vehicle Hours Traveled VMT Vehicle Miles Traveled WB Westbound
1. INTRODUCTION
Intelligent Transportation System (ITS) applications and their sensors and detectors provide transportation system performance data [1]. This data is used for traffic signal control, traveler information services, and incident management.
As ITS operations expand in major urban areas, data collection is becoming more comprehensive. If this data is saved and made accessible it could be used for new purposes. For example, ITS-derived performance measures describing traffic throughput, delay, and variability could be applied in transportation pla nning, research, and other areas beyond present operational and monitoring uses. More traffic management operators are considering an automated system for archiving, managing, and disseminating data generated by traffic monitoring devices.
1.1 Problem Statement
The Utah Department of Transportation (UDOT) and other transportation agencies collaborated to deploy a comprehensive Advanced Transportation Management System (ATMS). Traffic Monitoring Stations (TMS) are a component of the ATMS. They are located on the interstate freeway system at approximately half-mile increments. Each TMS generally consists of a set of inductive loop detectors that cover each mainline and its on-ramps. Loop detector data is aggregated at 15-minute intervals and archived as ASCII-CSV files on a FTP server at a Transportation Operation Center (TOC). Data storage for one month requires 420 Megabytes (MB). Because large quantities of data exist, they are only temporarily stored and are overwritten monthly.
Presently, UDOT does not archive this information for long-term purposes. Fifiteen-minute-interval data currently is archived in an ASCII-CSV file. About 155,000 records are archived each day. This data temporarily is kept on-line and is overwritten monthly. The Utah Traffic Lab (UTL) began to download 15-minute TMS data in Feb 2002 and placed the data from previous months on back-up CDs. TOC and UDOT planning, traffic and safety, pavement management agencies require this information. Transportation professionals outside of UDOT, such as Wasatch Front Regional Council (WFRC), Mountainland Association of Governments (MAG), Salt Lake City/ County, and universities, also need this information.
1.2 Research Scope
This study explores multiple TMS data application purposes. It establishes guidelines for developing a TMS data archival, analysis, and retrieval system. The system makes data available to users in Utah. Its results should be evaluated and applied to make TMS data usable, to diversify TMS data uses, and to enable data dissemination. This research project discusses TMS data management system data analysis and archival processes.
This project consists of four objectives:
1. to conduct a review of nationwide data collection, analysis, and archival practices 2. to identify user requirements inside and outside of UDOT
3. to develop the TMS information system architecture
4. to provide recommendations for implementation in the system.
This paper consists of the following:
1. literature review – summary of standards of Archived Data Users Servers (ADUS), a component of National ITS architecture; review of existing ITS data archival practices 2. investigation of current procedure for TMS data collection, storage, and analysis; review
of UDOT’s current TMS data processing software, Martin Knopp’s Delay On-line software
3. interview with the potential users of archived TMS data; identification of the types of data required and methods of data acquisition
4. development of a set of models to compute a range of key performance measures based on TMS data
5. definition of archiving system requirements 6. explanation of data quality control
7. recommendations for implementing TMS data archiving system; determination of institutions that should maintain data archiving routines
Figure 1.1 Research Process
Review Existing Practices and Standards
Define Data Needs and User Requirements
System Design
System Logical Architecture Design
System Physical Architecture Design
Data Aggregation Data Quality Control Database Design
Data Storage User Interface
System Implementation
Recommendations Review Utah’s TMS Data
2. LITERATURE REVIEW
This chapter reviews the advancement of ITS data archival and explains development of the Archived Data User Service (ADUS). Case studies summarize ITS data archiving practices and data applications.
2.1 Development of Archived Data User Service
ITS technologies generate massive amounts of operational data. This data presently is used in real time to effect traffic control strategies. ADUS meets the needs of ITS historical data archiving. It also provides a framework for the collecting, manipulating, retaining, and distributing data generated by ITS for use in other transportation activities.In the mid-1990s, real time data from traffic and transit operations was archived and used for purposes beyond ITS control strategies. This led to the creation of ADUS. In December 1999, ADUS officially was incorporated into Version 3.0 of the National ITS Architecture. A five-year program (2000-2004) is being conducted to support the implementation of ADUS. ADUS provides the following functions [2]:
• collects, archives, manages, and distributes data from ITS sources
• provides proper formatting, quality control, and assigns necessary metadata
• performs data fusion, or the association and joining of data elements from numerous disparate sources
• prepares “data products” for input into federal, state, and local data reports
•
Figure 2.1 shows Archived Data Management Subsystem (ADMS), the physical entity in the National ITS Architecture that provides ADUS services.
The following equipment packages carry out ADMS processes [1]:
• Traffic and Roadside Data Archival — collects and archives traffic, roadway, and environmental information for use in off-line planning, research, and analysis. This package enables importation of data from devices outside the ITS domain into an ITS data archive. For instance, traffic volumes from sensors maintained by transportation planners can be imported into an ITS data archive.
• ITS Data Repository — collects data and data catalogs from one or more data sources. And stores data in a focused repository for a particular set of ITS data users. This package is the basic data storage and management function that most relational databases provide.
• On-Line Data Analysis and Mining — provides advanced data analysis, summarization, and mining features that facilitate discovery of information, patterns, and correlations in large data sets. This package provides additional analysis functions that enable typical users to analyze large relational databases.
• Virtual Data Warehouse Services — provides capabilities to access “in place” data from geographically dispersed archives and coordinates information exchange with a local data warehouse. This package enables data sharing between agencies that maintain separate databases. For example, it could allow many users access to data maintained in a state highway patrol database and access to the traffic speed data are maintained in a DOT data archive.
• Government Reporting Systems Support — selects and formats data in an ITS archive to meet local, state, and federal government data reporting requirements. For example, this package could provide reports to FHWA’s Highway Performance Monitoring System (HPMS) database.
ADUS establishes a general process for developing an ITS data archiving system and carrying out the functional requirements of the system. The main objective of ADUS is to store various data sources and maximize their applications. Due to limited data availability, initial efforts to implement ADUS usually start with archiving and mining traffic surveillance data. The following section reviews existing ITS data archiving practices.
2.2 Overview of Existing ITS Data Archiving
Practices
Transportation agencies have realized that ITS data should not be limited to real time operational uses. Since the formation of ADUS many ITS data archiving activities have been conducted by different transportation agencies [5]. Table 2.1 describes these activities.
Table 2.1 Examples of Existing ITS Data Archiving Practices
Location Archived Data
Phoenix, AZ
Loop detector data from freeways and arterials are archived; plans underway to archive all “relevant” data used by the Traffic Operations Center.
Los Angeles, CA Developing an archival system for freeway loop detector data.
Orange County, CA Developing an archival system for freeway loop detector data.
Location Archived Data
Chicago, IL Developing an archival system for arterial loop detector data.
Montgomery County, MD Loop detector data from selected arterials are archived.
Detroit, MI Loop detector data from freeways are archived. Minneapolis-St.Paul, MN Loop detector data from freeways are archived. TRANSCOM, NY/NJ/CT Travel times derived from AVI-equipped vehicles are
archived.
Houston, TX Travel times derived from AVI-equipped vehicles are archived.
San Antonio, TX
Loop detector data from freeways, travel times derived from AVI equipped vehicles, and incident management data are archived.
Seattle, WA Loop detector data from freeways are archived State of VA Currently developing an archival system for
ITS-generated data.
Table 2.1 shows roadway surveillance data. These are the primary data sources for current ITS data archiving system. The following archived data are applicable to vario us fields of transportation:
• Freeway Performance Evaluation in Puget Sound Region, Wash. Loop detector data monitors congestion patterns, including variability in speeds and travel times.
• Evaluation of HOV Lanes in Houston, Texas. Probe vehicle data compares travel times for HOV and non-HOV lanes.
• Traffic Statistics in Chicago, Ill. Loop detector data has been used to produce an “atlas” of traffic statistics.
• Development of Travel Time Prediction Models, Texas. Data from probe vehicles is being used to develop short-term travel time prediction models for traffic operations.
• Ramp Metering Evaluation, Minneapolis-St. Paul, Minn. Freeway and ramp loop detector data used to evaluate cycle lengths on ramps.
•
These applications indicate that archived ITS data can be applied in diverse areas. However, the data mainly is associated with highway performance analysis. The Federal Highway Administration’s (FHWA) Office of Highway Policy Information conducted a nationwide investigation to determine ITS traffic detector potential in Performance Monitoring System (HPMS) reporting. It asked various states three questions about HPMS reporting [3]:
• Is the state traffic monitoring office aware of ITS detectors?
• Is the state using ITS detectors for HPMS reporting purposes?
• If the state is not yet using ITS detectors for HPMS, why not?
•
Answers to these questions were available for 43 states. Fourteen states answered positively to both questions and 16 states answered positively to the first question and negatively to the second. Survey percentages are shown in Figure 2.2.
Yes-Yes 33% Yes-No 37% No-No 30%
Figure 2.2 Investigation of ITS Data Uses in HPMS
(Source: Status of ITS Traffic Data for HPMS. The FHWA Office of Highway Policy information, August 2002.)
One-third of these states used ITS traffic detectors to supply HPMS traffic data. Several states noted that the number of ITS detectors available currently was limited, but was expected to increase in the future. Thirty percent of the surveyed states had no ITS traffic detectors at that time, though many were implementing the detectors. Several states reported that they were willing to use the detectors and expected to have them in the future. However, some states without detectors believed the detectors provided poor quality data. Others were still considering the benefits and drawbacks of ITS detector application. Overall, 70 percent of the states have ITS detectors available. Nearly one-half of these states currently are archiving some data for HPMS.
2.3 Case Studies
This section provides case study summaries of several well-known ITS data archiving and utilizing systems. It illustrates some basic processes of and principles for developing an ITS data archiving and analysis system. These systems have many applications.
2.3.1
PeMS in California
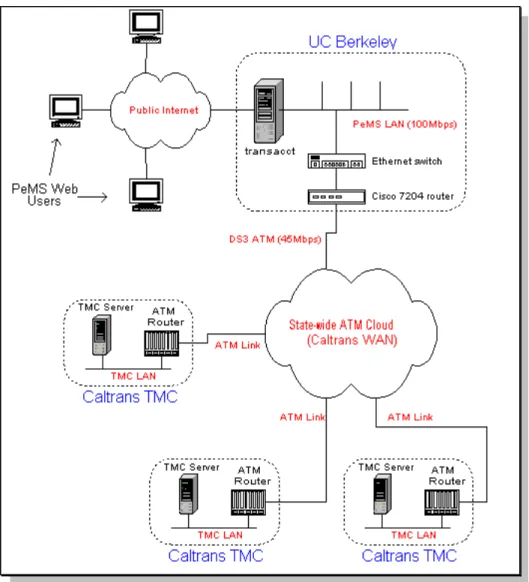
The California Department of Transportation (Caltrans) and researchers at the University of California at Berkeley (UCB) have worked together to create a freeway PeMS. In this PeMS, a front-end processor at the Traffic Management Center (TMC) receives data from freeway loops every 30 seconds. It formats this data and writes it into the TMC database. Data is sent over the Caltrans Wide Area Network from the TMCs to the PeMS computer, a data warehouse located at UCB. PeMS maintains a separate part of the database for each of Caltrans’ 12 districts [5]. Through the software, users can query diverse information on traffic conditions using web browsers (http://transacct.eecs.berkeley.edu).
PeMS extracts traffic information from real time and historical data and presents it in a low-cost, easy-to-use format. This assists managers, traffic engineers, planners, freeway users, researchers,
and transportation information service providers. Managers can use PeMS to determine how well the systems work. Engineers can use it to obtain detailed traffic analyses and to spot bottlenecks or malfunctioning equipment. PeMS also can be used by planners to evaluate management strategies, by travelers to find the quickest or shortest routes for their trips, and by researchers to validate theories and calibrate simulation models [4].
Figure 2.3 Architecture of PeMS
(Source: www.path.berkeley.edu/PATH/Research/presentations2001/alex_skabardonis/PeMS_Phase_II.ppt)
PeMS has different processes of data health checking and dia gnosis than other ITS data archiving and processing systems. Data quality control is a major part of PeMS function. Figure 2.4 is an example of a PeMS data quality report. According to statistics, data are categorized into six groups based on their data error types. Only 32.78 percent of detectors worked well and provided reliable data. Aside from checking data quality, PeMS also developed sophisticated algorithms to compute values for bad and missing detectors. All web pages on the PeMS site use processed data rather than raw data.
% Working Suspected Errors
Figure 2.4 Example of PeMS Data Quality Check (Source: http://pems.eecs.berkeley.edu)
2.3.2
TDAD in Washington State
Researchers at the Washington State Transportation Center (TRAC) are working with the Washington State Department of Transportation (WSDOT) to demonstrate uses of archived ITS data and to extend its applications. They developed several analytical tools that now are used by TRAC and WSDOT.
TRAC and WSDOT collect freeway detector data every 20 seconds from field controllers. The data is then summarized by five-minute increments in the data archive. Before the detector data is loaded into a CD archive, a data quality control procedure is performed to document failed information. PC-based CD retrieval software retrieves and adds the five-minute loop data to local or network disk drives. CD Analyst software uses spreadsheet macros to analyze the loop data and to develop graphical presentations [5].
Presently, TRAC researchers are also developing a web-based ITS data mining application in the Traffic Data Acquisition and Distribution (TDAD) study. This prototype application has a map-based interface (http://www.its.washington.edu/tdad/). It is used to select loop detector locations of interest. At this time, the raw 20-second loop data populates the TDAD database. Approximately six months of data have been accumulated [6].
Archived ITS data in WSDOT is used for a variety of purposes. It tests and evaluates operational improvements such as ramp metering of HOV lanes, freeway performance monitoring, pavement design, and freight performance analysis.
Figure 2.5 Traffic Data Acquisition and Distribution Framework (Source: http://www.its.washington.edu/tdad/tdad.gif)
2.3.3
ITS Data Management in Texas
Texas uses ITS data archiving. The TransLink® ITS Research Program at Texas Transportation Institute has developed an on-line ITS data management system referred to as DataLink. This prototype DataLink system provides user-friendly access to 40+ Gigabytes (GB) of TransGuide loop detector data. The data has been stored since late 1997. A range of transportation system performance measures can be queried in a web browser interface. This eliminates the need for Structured Query Language (SQL) [5].
Furthermore, a FHWA performance-monitoring program was started in 2000 with support from the Texas Transportation Institute and Cambridge Systematics. It continuously archives freeway detector data from 10 cities. Houston and San Antonio are attendees to this program. The archived data is gathered in a variety of formats and is compiled into a standard five-minute, lane-by-lane format for further processing and analysis. This multi-city data archive primarily is meant to monitor data mobility and reliability at the city and national levels. In this program, raw data is saved off-line on CDs and summary data is kept on-line for analysis. Basic data quality control methods identify and remove suspect or erroneous data [7].\
2.4 Summary of Findings
According to nationwide research and practice review, many existing TMCs archive or plan to archive traffic surveillance data. Archived ITS data can be successfully applied to purposes beyond real time uses. Table 2.2 summarizes ITS data types and their archival and dissemination.
Table 2.2 Summary of Loop Detector Data Archiving Practices
Data Source Data Archiving
Data Archiving
Activi ties Interval Spacing Aggregation Storage Distribution
Caltrans PeMS 30 s 0.5 mi 5 min Current 40G online Internet
Washington
Seattle TDAD 20 s 0.5 mi 5 min CD and online Internet
San Antonio
Transguide 20 s 0.5 mi 5 min CD and online Internet
Minneapolis TMC 20 s 0.33-2 mi 5 min CD
Long Island
INFORM 60 s 0.5 mi 5 min Tape, recent months online Internet
Michigan ITS 20 s 0.5 mi 5 min Tape, one week available online
Phoenix AZTech 20 s 0.5 mi 5 min Online and offline storage
Salt Lake City
TOC 20 s 0.5 mi 15 min Overwritten each month
Florida UCF 20 s 0.5 mi 15 min Online Internet
The following are common concerns and similarities in archiving activities.
Data Source
ITS generates a variety of data through its freeway management, incident management, and transit management components. However, initial ITS data archiving efforts were focused only on freeway detector data such as volume, speed and occupancy. This data usually is gathered for individual lanes by lo op detector systems every 20 or 30 seconds. This data is a major source of current ITS infrastructure. It also provides basic information about transportation systems.
Data Aggregation and Storage
Data often is aggregated into different levels before it is archived. This reduces storage space and improves efficiency. Table 2.2 shows that data frequently is summarized by five-minute increments.
User Identification
Many TMC personnel are interested in making data accessible to secondary users, such as planners, traffic performance monitoring programs, and travelers.
Data Quality
Many ITS data archiving efforts emphasize the importance of data quality. Only accurate data is worth further analysis. Data quality control is performed in relatively mature archiving systems. This control includes checking data quality, identifying and correcting erroneous data, and providing missing data.
Easy Data Access
Stored ITS data are relatively inaccessible and unusable due to their size and format. Many TMCs want to decipher these data and distribute them via the Internet or CD rather. This process would make data more accessible than archiving data onto magnetic tape cartridges or off-line storage devices.
Institutional Issue
Transportation operations personne l usually own ITS data. Dedicated research institutions should manage archived data. The University of California at Berkeley, the University of Washington, and the University of Texas A&M maintain archival data and develop applications to distribute this data. Assignment of responsibility and adequate funding are important in managing data archives [8].
3. CURRENT TMS DATA COLLECTION AND
ARCHIVING
ATMS is a computerized communications system that carries out traffic surveillance and management, incident detection, and information dissemination. UDOT has installed compre-hensive ATMS. This section reviews the elements of ATMS and identifies available data produced by ATMS. It also discusses TMS data as a major ATMS data source. In addition, it discusses Delay On-Line, UDOT’s current TMS data archiving and processing software.
3.1 ATMS Elements
UDOT’s current ATMS includes the following elements [9]:
• A TOC
• TMSs on all freeways and some arterial roadways
• Interconnected traffic signals on many arterials, in addition to ramp metering
• Closed Circuit Television (CCTV) on all freeways and some arterials
• Variable Message Signs (VMS) on all freeways and a few arterials
• Highway Advisory Radio (HAR) stations at nearly a dozen locations
• Roadway-Weather Information System (RWIS) stations at a number of locations
•
Figure 3.1 diagrams the relationship among the above ATMS elements. The heart of ATMS is TOC. This center interconnects different elements of ATMS and communicates with other transportation communities. The diagram, TMS, CCTV, and RWIS provide data input for other elements. These data are processed in TOC. They are then broadcast via HAR, VMS, and the Internet. Major traffic information, such as volume, speed, and occupancy are collected by TMSs. Therefore, they are a basic component of the ATMS data source. The following sections discuss the specific data inputs, intervals, and formats for the TMS data currently available.
Figure 3.1 ATMS Architecture Diagram
(Source: Intelligent Transportation System at the 2002 Salt Lake City Olympic Games, Iteris, Inc., August 2002.)
3.2 TMS Data Collection
Currently, 641 TMSs connect to the TOC via communications links. This number will grow with TMS expansion. Almost all TMSs are located on the freeway system at approximately half-mile increments. A few arterials and state routes also house TMSs. Each TMS generally consists of a set of detectors, one detector in each mainline lane. It also has additional detectors on the on-ramps. Each mainline detector consists of double inductive loops to measure volume, speed, and occupancy. The detectors at the 23 metered on-ramps generally have several loops in each lane to detect calls, clearance, and queue backup. Detectors at non-metered on-ramps include fewer loops. Figure 3.2 illustrates the layout of a TMS. TMS data includes:
• speed, volume, and occupancy
• recording time
• TMS site ID
• detector ID
• lane ID at every TMS site
• milepost value of each TMS site
D=Detector TMS
Figure 3.2 Layout of Traffic Monitor Station
3.3 TMS Data Storage and Processing
TMS data are collected in real time. The standard sampling period is 20 seconds. Through CommuterLink fiber-optic communications, average 20-second volumes, speeds, and occu-pancies continuously flow back to TOC. TOC uses the data to perform real time traffic management and traveler information functions.
Figure 3.3 illustrates 20-second and 15-minute TMS data stored in separate ways according to their uses. Tables 3.1 and 3.2 give the average volumes, speeds, and occupancies in 20-second and 15-minute levels. The malfunction records are coded as “–9”.
Public Internet Users
UDOT LAN
SQL Server Database Sybase Database
TMS Data Collection
Utah Traffic Operation Center
20-sec TMS data 15-min TMS data
CommuterLink.com
Delay Online
Figure 3.3 Current TMS Data Storage Process
Table 3.1 20-second TMS Data Sample
Station_id Timestamp Volume Speed Occupancy
1 2003-05-21 15:48:40.000 -9 -9 -9 2 2003-05-21 15:48:40.000 33 59 11 4 2003-05-21 15:48:40.000 23 66 6 6 2003-05-21 15:48:40.000 18 63 5 9 2003-05-21 15:48:40.000 16 67 4 11 2003-05-21 15:48:40.000 9 67 3 13 2003-05-21 15:48:40.000 14 71 3 14 2003-05-21 15:48:40.000 18 69 5 15 2003-05-21 15:48:40.000 19 71 4 16 2003-05-21 15:48:40.000 15 72 4 17 2003-05-21 15:48:40.000 10 60 4 20 2003-05-21 15:48:40.000 12 62 3
Table 3.2 15-minute TMS Data Sample
DetectorIDStationID SampleStart Dir&Lane Mile_PostStation_Length Avg_SpeedAvg_OccupancyTotalVolume LocationText
1263 1 Feb 9 2003 12:00AM 12 0.5 0.3 0 0 0 Interstate 215 East Southbound @ Foothill
1264 1 Feb 9 2003 12:00AM 13 0.5 0.3 0 0 0 Interstate 215 East Southbound @ Foothill
1067 2 Feb 9 2003 12:00AM 10 1.3 0.6 -9 -9 -9 Interstate 215 East Southbound @ Interstate 80 Split 1068 2 Feb 9 2003 12:00AM 11 1.3 0.6 -9 -9 -9 Interstate 215 East Southbound @ Interstate 80 Split 1069 2 Feb 9 2003 12:00AM 12 1.3 0.6 -9 -9 -9 Interstate 215 East Southbound @ Interstate 80 Split
1058 4 Feb 9 2003 12:00AM 10 1.9 0.3 69 0 23 Interstate 215 East Southbound @ 3300 South
Twenty-second real time data is stored in a “buffer” in the TOC computer. The real time data is then fed to CommuterLink. Over the Internet, CommuterLink provides real time traffic speed information using different colors to display speeds in different ranges. The Website, http://commuterlink.utah.gov shows the functions of CommuterLink.
3.4 Delay On-Line
System Introduction
In 2001, Martin Knopp, a UDOT employee, released Delay On-Line (DOL) 1.1, a system that monitors total delay on detectorized freeway systems. This software obtains 20-second TMS data from TOC’s data server, a collection and storage base for TMS data. Currently, the system provides real time display, and it aggregates and examines TMS data collected from Utah’s freeways. Delay On-Line also provides a wide variety of performance measures focusing on traffic delay analysis. Any authorized user can access this system. However, before running the system, the user must to download and install the Citrix ICA Client software on their workstations. Figure 3.4 shows an easy-to-use graphical interface.
Site Specific Performance Measures System Wide Performance Measrues
Corridor Wide Performance Measures
Performance measures provided by DOL can be divided into three groups according to their coverage capacity: site-specific measures, corridor-wide measures, and system wide measures. Each group’s measures can be categorized at a different temporal level. Table 3.3 provides a complete list of DOL performance measures organized by their spatial and temporal differences. Table 3.4 shows each Utah freeway broken down by corridors. The following sections describe performance measures along Utah’s freeways. Twenty-second measures are described in real time performance measures. The others are discussed in historical performance measures.
Table 3.3 Delay On-line’s Performance Measures
Point Corridor Freeway Systems
20 Seconds Vol, Speed, V/C, Delay
Vol, Speed, V/C,
Delay
Hour Vol, Speed, Occ, V/C, Delay, TTI Delay
Day ADT, Delay Delay
Month Speeding Delay, Speeding
Year Delay
Note: Volume (Vol), Occupancy (Occ), Travel Time Index (TTI).
Table 3.4 Corridors List
Freeway Name Corridor Name I-15 South SLC NB I-15 South SLC SB I-15 North SLC NB I-15 North SLC SB I-15 SLC NB I-15 I-15 SLC SB I-215 SouthWest SB I-215 SouthWest NB I-215 NorthWest SB I-215 NorthWest NB I-215 East NB I-215 I-215 East SB I-80 West EB I-80 West WB I-80 East EB I-80 East WB I-80 SLC EB I-80 I-80 SLC WB SR 201 WB StateRoad 201 SR 201 EB Space Level Time Level
Real Time Performance Measures
Martin’s software provides features similar to the UDOT CommuterLink system. Real time traffic speed information is visible on a map of the freeway system. The system updates this information every 20 seconds. Figure 3.4 shows the speed on each freeway segment. It is typically about one-half mile long and is shown as a color-coded band.
Based on 20-second data, connecting TMS data along a specific route makes it possible to monitor real time traffic conditions using volume, speed, V/C, and delay curve. For example, a V/C ratio curve along I-80 WB displays current congestion conditions at different locations. These could be supplied to traffic operators and others interested in monitoring traffic flow.
Stations
V
/C
Figure 3.5 Volume/Capacity along I-80 WB (Source: Delay On-Line software)
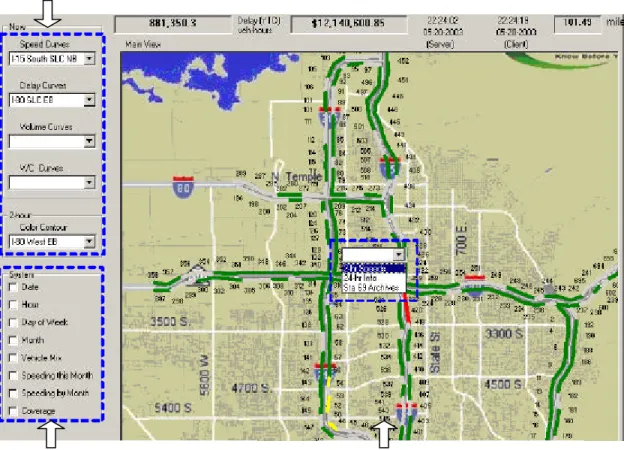
Historical Performance Measures
This software aggregates 20-second raw data into one-hour data and archives it for historical and system-wide freeway performance analysis. Figure 3.6 show an interface for accessing historical data. DOL provides primary site-specific measures, such as speed, volume, occupancy, Travel Time Index (TTI), delay, and V/C for each specific day and station.
Figure 3.6 Site-Specific Performance Measures Interface (Source: Delay On-Line software)
Archived data is used to evaluate the freeway system’s performance. System delay is computed by hour, day of week, and month. Figure 3.7 reveals that afternoon peak period traffic causes a significant delay every day. It also shows percentage of vehicle congestion.
Summary
DOL is particularly strong in delay analysis. However, developers currently are enhancing it. DOL does not perform sophisticated data quality control. All analyzed and displayed data is raw data, which can lead to possible bias of summarized performances.
System delay, speeding, and TTI analysis depend on accurate speed measurement. However, a significant number of current TMS detectors tend to provide higher than average traffic speeds. This can cause low estimates in system delay and high calculations in speeding percentages. Erroneous data includes missing data, unreported data, and data with “–9” values. If data “holes,” are not filled, the accuracy of system measures also is questionable. Figure 3.8 illustrates a sample of speed data along I-80 Eastbound (EB) with a significant amount of missing and erroneous data.
4. ARCHIVED TMS DATA NEEDS AND USER
REQUIREMENTS
User requirements for ITS data influence the design of data archiving systems. The following section identifies user needs and requirements through the input of potential users. These users include operation personnel, planners, researchers, and traffic engineers.
4.1 Potential Users and Applications for Archived
ITS Data
TMS archives a variety of ITS data. Table 4.1 lists the ITS data types used by different groups. Needs of different user groups may help determine appropriate designs for ITS archiving systems. This section describes several stakeholders listed in Table 4.1 and discusses the following:
• Typical data elements of interest
• Spatial/temporal aggregation levels of interest • Additional data characteristics of importance • Examples of common ITS applications
Table 4.1 Potential Users and Applications for Archived ITS Data
Stakeholder Group Primary Transportation- Related Functions Example Applications Metropolitan Planning Organization (MPO) and state transportation planners
Identifying multimodal passenger transportation improvements (long and short-range);
congestion management; air quality planning;
develop and maintain forecasting and simulation models
• congestion monitoring • link speeds for Traffic Demand Forecasting and air quality models
• AADT, K- and D-factor estimation
• temporal traffic distributions • truck travel estimation by time of day
• macroscopic traffic simulation
• parking utilization and facility planning • HOV, paratransit, and multimodal demand estimation
• congestion pricing policy Traffic
management operators
Day-to-day operations of deployed ITS (e.g., Traffic Management Centers, Incident Management Programs)
• pre-planned control
strategies (ramp metering and signal timing)
• highway capacity analysis • saturation flow rate determination • microscopic traffic simulation
Stakeholder Group Primary Transportation- Related Functions Example Applications -- historical -- short-term prediction of traffic conditions
• dynamic traffic assignment • incident management
• congestion pricing operations • evaluation and performance monitoring
Transit operators Day-to-day transit operations: scheduling, route delineation, fare pricing, vehicle
maintenance, transit management systems, and evaluation and planning
• capital planning and budgeting
• corridor analysis planning • financial planning • maintenance planning • market research • operations/service planning • performance analysis planning • strategic/business planning Air quality analysts Regional air quality
monitoring;
transportation plan conformity with air quality standards and goals
• emission rate modeling • urban air shed modeling
MPO/state freight and intermodal planners
Planning for intermodal freight transfer and port facilities
• truck flow patterns (demand by origins and destinations) • HazMat and other
commodity flow patterns Safety planners and
administrators
Identifying countermeasures for general safety problems or hotspots
• safety reviews of proposed projects
• high crash location analysis • generalized safety
relationships for vehicle and highway design
• countermeasure effectiveness (specific geometric and
vehicle strategies)
• safety policy effectiveness Maintenance
personnel
Planning for the rehabilitation and replacement of
pavements, bridges,
and roadside appurtenances; scheduling of maintenance activities
• pavement design (loadings based on ESALs)
• bridge design (loadings from the "bridge formula")
• pavement and bridge performance models • construction and maintenance scheduling Commercial vehicle enforcement personnel Accident investigations; enforcement of commercial vehicle regulations
• HazMat response and enforcement
Stakeholder Group Primary Transportation- Related Functions Example Applications • intermodal access
• truck route designation and maintenance
• truck safety mitigation • economic development Emergency
management services (local police, fire, and emergency medical)
Response to transportation incidents; accident
investigations
• labor and patrol planning • route planning for emergency response • emergency response time planning
• crash data collection Transportation
researchers
Development of forecasting and simulation models and other analytic methods; improvements in data collection practices
• car-following and traffic flow theory development • urban travel activity analysis
Private sector users Provision of traffic condition data and route guidance (Information Service Providers);
commercial trip planning to avoid congestion (carriers)
Source: http://www.fhwa.dot.gov/ohim/its/tab1_1.pdf
4.2 Process of Establishing TMS Data Needs
Data needs are established through user input. This process requires coordination of different agencies. Users establish data needs in a series of one-on-one interviews via e-mail or telephone. However, these data needs may be beyond the capacity of the newly developed TMS database. More ITS data may become part of the database in response to existing needs. This process allows data providers to modify or adapt data collection practices. They also may sensor designs to meet data needs. However, if data needs are too exhaustive, the data provider may be incapable of provid ing all data elements. Table 4.2 lists the people who attended to the data needs survey. These potential users are from different agencies within and outside of UDOT, who have different purposes in traffic data collection.
Table 4.2 Data Needs Survey List
Name Organization Phone No. E-mail Stan Burns Research 965-4190 sburns@utah.gov Sam Sherman ITS 887-3744 ssherman@utah.gov Joe McBride TOC 887-3716 joemcbride@utah.gov Gary Kuhl Planning 964-4552 gkuhl@utah.gov Rob Clayton Traffic/Safety 964-4521 robertclayton@utah.gov Robert Hull Traffic/Safety 965-4259 rhull@utah.gov
Within UDOT
Tammy Kaeser Traffic Statistics 965-4137 tkaeser@utah.gov
Chad Worthen MAG 229-3811 cworthen@mountainland.org Wayne Bennion WFRC 363-4230-
115
wbennion@wfrc.org Kent Barnes SL County 562-6422 kbarnes@co.slc.ut.us Kevyn Smeltzer SL County 562-6490 ksmeltzer@co.slc.ut.us
Jerry Blair SLC 535-7103
Tom Stetich SLC 538-6530
Outside UDOT
Richard Hodges UTA 262-5626- 2354
rhodges@uta.cog.ut.us
4.3 Summary of Data Needs Survey
Interviews with traffic data users reveal a variety of data applications. Table 4.3 summarizes these applications. The appendix lists each user group’s specific data needs by data format and detail level.
Most organizations indicated that they obtain traffic data from the annual traffic report produced by UDOT. Traffic counting and monitoring stations like Automatic Traffic Recorder (ATR) are located throughout the state. These stations provide monthly average traffic counts for weekdays and weekends. This data is collected by the Transportation Monitoring Unit of UDTO. It is then developed and analyzed by UDOT’s Program Development Division. This information is not included in an automatic archiving system. Therefore, these organizations must wait until the annual report is released. A more effective way to query data is needed as organizations want quick access to speed, volume, and occupancy data for different times and locations.
Some users found TMS data difficult to understand in its current format and size. Data users commonly worry about data quality. Some users mistrust the huge amount of data collected by TMS sites. Table 4.3 shows data needs and user concerns incorporated into a system design plan for an automated data management system.
Table 4.3 Data Needs
User Purpose Data Needs
Research Research AADT
Speed/5min
Traffic Volume/5min, peak hour ITS Real Time Traffic Control
/ Management AADT Incidents Speed/Hourly Travel Time Traffic Volume/Hourly Vehicle Classification TOC Manage Commuter Line and
Provide Instant Data on Road and Traffic Conditions; Congestion Management; Signal Timing.
Speed/15min
Traffic Volume/Hourly, Real Time Turning Movement/Peak Times Vehicle Classification
Planning Long Range Planning HOV Analysis Capacity Analysis
Traffic Volume/Hourly Peak Hour Volume/Directional Split
Ramp Volumes Vehicle Classification Traffic/Safety Safety Studies
Traffic Studies AADT/AWDT Density/15min Speed Traffic Volume Vehicle Classification Turning Movement/15min Traffic Statistics
Traffic Statistic and Reporting AADT
Traffic Volume/15min
Vehicle Classification/Length, Axle Within
UDOT
Maintenance Road Maintenance AADT
Traffic Volume MAG Planning Signal Coordination Incident Analysis Congestion Analysis Speed/Hourly Traffic Volume/Hourly Turning Movement Ramp Metering WFRC Long Range Planning
Validate Transportation Model
AADT/AWDT Speed/15min Vehicle Classification/Hourly Traffic Volume/Hourly Turning Movement SL County Maintenance Signal Design AADT Travel Time Turning Movement Outside UDOT SLC Maintenance Signal Design AADT Travel Time Turning Movement
User Purpose Data Needs UTA Route performance Analysis
Scheduling
Evaluation and Planning
Speed/ 15min Incidents/Accidents Volume/Hourly, by lane Vehicle Classification
Universities Research AADT
Speed/5min
Traffic Volume/5min Turning Movement/5min
5. DEVELOPMENT OF PERFORMANCE MEASURES
This chapter summarizes a variety of performance measures that can be generated from TMS data. A set of models is developed for the evaluation of transportation systems. It is based on site-specific measurements of volume, speed, and occupancy.5.1 Available Performance Measures
Table 5.1 lists performance measures derived from archived TMS data. Performance measures are collected by point, link, corridor, and system. Points are locations of detector stations. They measure volume, speed, and occupancy for each detector and station. A link is section of lane or road holding detectors. Link-based measurements can be taken by lane or a segment. A segment is a collection of several lanes. Performance measures, such as VMT, VHT, travel time, and delay, show transportation system mobility at the corridor or system level. Just as measurements take place at different spatial levels, they also take place at different time levels, ranging from 20 seconds to one year.
Table 5.1 Performance Measures
Measure Level Measure Type Performance Measures
Point Measures Detector Station
Speed Volume Occupancy
Link-Based Measures By Lane Road Segment Speed Volume Travel time Delay Corridor or System Measures By Lane Road Travel Time Delay
Vehicle Miles Traveled (VMT) Vehicle Hours Traveled (VHT)
5.2 Performance Measures Modeling
There are two ways to obtain performance measures. The first is to aggregate and summarize original data to calculate volume, speed, and occupancy measures. The second is to derive measures such as travel time, delay, VHT and VMT from existing data. Figure 5.1 shows the process of calculating performance measures. This section describes each measure and defines a set of algorithms to compute these measures.
• • •
Figure 5.1 Data Flow of Performance Measures Calculation
Original TMS Data Aggregated TMS Data Derived Performance Measures
Hourly Daily Monthly Annually
5 Minutes 20 Seconds Volume Speed Occupancy Volume
Peak Hour Volume
Peak Hour Speed
Weekly
AWDT AMDT AADT
Travel Time Peak Periods Delay VMT VHT Location 15 Minutes Volume Speed Occupancy Link Length Volume Speed Speed Occupancy Occupancy ADT Delay Delay VMT VHT
TMS output is an average of 20-second volume, speed, and occupancy measures. Occupancy describes traffic density and often is used for short-term traffic pattern analysis. Volume and speed are the most commonly used traffic characteristics. They are measured at intervals varying from 20 seconds to one year. These intervals depend on anticipated use of the data. 20-second data can be aggregated to find data for different time intervals. Traffic volumes for Average Annual Daily Traffic (AADT), Average Daily Traffic (ADT), and Peak Hour Volume (PHV) are found by aggregating and averaging. However, certain transformations are needed to obtain average speeds.
TMS data is collected by lane. Therefore, weighting factors should be considered when determining the average speed at a particular point in all lanes. Weighting factors are based on the volume in each lane. The lane with a higher traffic volume is given a heavier weight. Equation 5.1 is used to calculate average speed at a specific site.
∑
∑
= = = n m n m i Dm i Dm i Dm i F V F V 1 1 / ) ( Equation 5.1 Where: iV = Weighted average speed at the ith TMS site for the specified period.
i Dm
V = Average speed at the mth detector of the ith TMS site for the specified period.
i Dm
F = Total volume at the mth detector of the ith TMS site for the specified period.
n
= Number of detectors at the ith TMS site.Similarly, when hourly or peak period speed is computed, the weighting process should adjust the result. Equation 5.2 shows that weight is the ratio of total volume in time of t to total volume in time of T.
∑
∑
= = = n k n k i tk i tk i tk i T F V F V 1 1 / ) ( Equation 5.2 Where: i TV
= Weighted average speed at the ith TMS site for the specified period T. itk
V = Average speed at the ith TMS site for the specified period t. i
tk
F = Total volume at the ith TMS site for the specified period t.
n
= The number of t intervals included in the T.∑
= = n n t T 1 .5.2.2 Travel Time
Travel time is the time it takes to travel along a particular segment of a corridor or road. It is computed with the average speed traveled on a segment and the distance between two points. Travel time and its variability measure service quality offered by the transportation system.
] / 1 ) ( / 1 [ ) ( i i i i F t V t f l D =
∑
× × −Travel time over a link can be computed precisely using real time speed when vehicles are traveling at a particular speed. An average five-minute speed typically is used to estimate travel time. Travel time
T
i(
t
)
at time t over the ith segment is computed as follows:Where:
)
(
t
V
i= average speed in a five-minute interval at the
ith
TMS at time
t
when
vehicles travel over the
ith
segment.
i
l
= the length of the
ith
segment holding the
ith
TMS, which can be derived
from the adjacent TMSs’ locations marked by milepost value.
Assuming
x
1,
x
2,...
x
nas locations of
n
TMSs on a directional roadway,
l
iis calculated as
follows:
2
/
)
(
+1−
−1=
i i ix
x
l
Equation 5.3
The length of the first and last segments are:
l
1=
(
x
2−
x
1),
l
n=
(
x
n−
x
n−1)
Equation 5.4 shows that travel times are aggregated over a set of links to find the tota l travel time
T for an entire or specific section of a route.
∑
=
l
/
V
(
t
)
T
i iEquation 5.4
5.2.3 Delay
Delay is the difference between actual travel time and travel time assuming that vehicles are traveling at free-flow speed on the section being studied [10]. Delay
D
i(
t
)
on a link during afive-minute period can be computed as follows.
]
/
1
)
(
/
1
[
)
(
)
(
i i i i it
l
F
t
V
t
f
D
=
×
×
−
Where,
F
i(
t
)
is the total volume at the ith TMS site for the specified period t andf
i is the free-flow speed at the ith segment. Equation 5.5 calculates travel time delays over a set of individual links. It represents the total delay on some routes or in a freeway system.Equation 5.5
)
(
/
)
(
t
l
V
t
T
i=
i i5.2.4
VHT and VMT
Vehicles Hours Traveled (VHT) and Vehicles Miles Traveled (VMT) describe the efficiency and productivity of a transportation system. VHT measures the total hours traveled by all vehicles on specific routes or links during a given time period. VMT is the number of vehicle -miles traversed in a given amount of time. Using average five-minute traffic facts, VMT and VHT for each link is calculated as follows:
,
i i il
F
VMT
=
×
VHT
i=
l
i×
F
i/
V
iVMT and VHT can be added for any set of links (e.g., one corridor or a whole freeway system) and for any time interval.
5.2.5 Travel Time Index
TTI is the ratio of peak period travel time to free-flow travel time [11]. It represents the ease of getting to a destination. A TTI of 1.3 indicates that a 10-minute off-peak trip will take 13 minutes during peak traffic. A higher TTI value means the system is more congested. Equation 5.6 shows how TTI is calculated. TTI can measure either chosen corridors or a whole system, depending on the range of road links aggregated.
∑
∑
= i i i i f l t V l TTI / ) ( / Equation 5.65.2.6 Variability and Reliability
Traffic demand variation, crashes, and other irregular events influence travel reliability. Variability and reliability usually are measured in terms of travel time. Reliable travel time increases predictability of a trip. Highly variable travel time indicates a low degree of reliability, or an unpredictable travel time.
ITS data is collected continuously and is comprehensive. Therefore, it provides consistent and accurate information regarding variability and reliability of traffic conditions. TMS data allows statistical analysis of traffic variability and reliability.
Standard Deviation (SDEV) is the difference between a given set of numbers. It can assess variability in travel time. Equation 5.7 shows how to determine variability based on historical travel data. A large number of trips were recorded to obtain the necessary inputs for Equation 5.7. This equation calculates variability of a specific route during a particular period. Higher standard deviation means higher variability. This results in a more unpredictable travel time.
1
)
(
2 2−
−
=
∑
T
M
n
s
i Equation 5.7Where:
s = the estimate of travel time standard deviation.
i
T
= the travel time of the ith travel crossing a specific route.M = the mean travel time of a set of samples.
n = the number of sampling travels.
Level of confidence can quantify travel time reliability. The 95 percent confidence region contains 95 percent of the historical travel time data of a representative sample of the population. So, based on past trips, a traveler could obtain the suggested travel time with a 95 percent probability of actually arriving within the pre-planned time. For example, it takes an average of 13 minutes for a commuter to travel from Sandy to downtown Salt Lake City. However, due to congestion, this commuter must allow 20 minutes of travel time if he or she wants to arrive at his or her office on time 95 percent of the time. With increased traffic demand, the 20 minutes previously needed would likely only guarantee an 80 percent possibility of on-time arrival which results in lower travel time reliability.
Figure 5.3 shows the process for calculating traffic variability and reliability. TMS data provide basic inputs for this algorithm. Travel time can be derived from TMS speed data and location information. Users also must provide the expected number of trips, n, which should occur during the same traffic periods.
5-min Speed TMS Location Travel Time (Ti) 1 ) ( 2 2 − − =
∑
T M n s i TimeTravel Time Standard Deviation (SDEV) # of Travels =n?
Yes
No
Ÿ The higher the SDEV, the higher the variability, but the lower the reliability
Ÿ Compare different facilities’ performance (HOV, General Lanes)
Ÿ Evaluate traffic reliability changes over time TMS Input
Conclusion
n T
M =
∑
i /Travel Time Mean
6. TMS DATA ARCHIVING SYSTEM
ARCHITECTURE
This chapter describes the architecture of an automated TMS data archiving and performance measuring system. This architecture provides guidance for archiving, analyzing, and disseminating TMS data. Several capabilities are incorporated into the system’s design:
• Capability to store and manage large amounts of data.
• Capability to aggregate data, derive performance measures at different spatial and temporal levels, and present them in tabular and graphical formats to users.
• A user-friendly point-and-click query interface to acquire measures of interest.
The following section considers the above features and documents the development of a TMS data archiving system used to archive, analyze, and present data from TMSs. This information can guide researchers to develop a prototype version of a TMS data management system.
6.1 Conceptual Architecture of TMS Data Archiving
System
Figure 6.1 shows the six components of the proposed TMS system: data collection, data transmission interface, data aggregation and quality control, off-line data storage, database management system, and user interface.
TMSs provide the main source of archived data. They use double inductive loop detectors to measure traffic volume, speed, and occupancy across all lanes and on on-ramps and off-ramps at hundreds of freeway locations. The system receives real time data every 20 seconds from TMSs over UDOT’s Local Area Network.
W e b Q u e ry a n d D is p la y C D -B a s e d R e p o rt
Off-line Historical Data Archive U
s e r In te rf a c e Within UDOT Research ITS TOC Planning Safety Statistics Maintenance Outside UDOT MAG WFRC SL County SLC UTA Universities User Database Management System
D B M S S e rv e r
12-month Online Storage Data Storage Schema
SQL Query Design Summary Report W e b S e rv e r Geographic Data Mgmt Query Result Visualization User Access Control Data Aggregation and Quality Control
CD Monthly Original Data CD Monthly Cleaned Data Magnetic Tape Annually Cleaned Data Backup U D O T L A N D a ta T ra n s m is s io n I n te rf a c e Aggregation Aggregate 20sec data into 5min
Magnetic Tape Annually Original Data Backup Q u a li ty C o n tr o l Error Detection Error Imputation Detector status Report Data Collection TMS Volume Speed Occupancy
Public Internet UDOT LAN UDOT LAN Users out of UDOT Tape Y -A x is Users within UDOT TOC Server
DBMS Server Web Server
CDR
Permanent Storage
UDOT TOC TMS Data Collection
Utah Traffic Lab
Processed Data Raw Data
Data Aggregation and Quality Control
6 Strands Fibers
The data processing block in Figure 6.1 is comprised of data aggregation and quality control. The system aggregates the received data into a level that can reduce data flow size without sacrificing user needs. To assist TMS inspection and maintenance, data quality control detects erroneous data. It also imputes missing data and produces a detector status report.
The system also provides on-line and off-line storage of raw and processed data. Original five-minute data must be permanently preserved off-line in the historical data archive. After the data quality control procedure, processed data also should be copied off-line. In addition, data processed in the last 12 months are kept in a database management system for on-line queries. The archived data management system is a key subsystem for this PeMS. It implements all functions that provide data users with different types of data products. It includes a Database Management System (DBMS) server and a web server. Users can interact with DBMS by inputting queries on Web pages without acquiring DMBS knowledge.
Figure 6.2 demonstrates the structure of this system. The Utah Traffic Lab (UTL) is proposed to hold the TMS data archiving system because UTL has advanced communication infrastructures, is integrated with UDOT’s network, and has strong expertise in database management. The functions of this system, such as data aggregation and quality control, data storage, database management, and data distribution are implemented by UTL.
6.2 Data Aggregation
The enormous volumes of TMS data require innovative storage and aggregation strategies. Currently at UDOT, TMS data coming from detectors at 20-second intervals is aggregated at 15-minute intervals and archived as ASCII-CSV files on a FTP server. However, users from different agencies require data at different intervals, ranging from five minutes to one hour. To meet data requirements for multiple applications we recommend that 20-second raw data be aggregated into five-minute intervals rather than the current 15-minute intervals. The archiving system should also be able to summarize five-minute data into various time periods, ranging from fifteen minutes to one hour to one day. This allows the database to serve a number of different purposes. These may include real time point analysis, corridor congestion monitoring, and long-term planning applications.
Data aggregated at five-minute intervals is reasonably detaile d at 12 data intervals per hour. In addition, the size of five-minute data measurements is manageable in DBMS. Table 6.1 shows the required storage size for different aggregation levels. For example, each day of data measured at five-minute intervals requires approximately 33.6 megabytes (MB) of storage space. A month of the same aggregated data requires 1.0 gigabytes (GB). A full year of data requires 12.3 GB. The constant flow of large amounts of TMS data requires an efficient data storage strategy.
Table 6.1 Comparison of Data Size at Different Storage Levels and Times Level
Time
Day 504 MB 33.6 MB 11.2 MB 2.8 MB
Month 15.1 GB 1.0 GB 336 MB 84 MB
6.3 Data Storage
TMS data can be stored either as original 20-second data or as aggregated data. Table 6.1 shows that a full year of 20-second data is about 184.0 GB. It is not economical to save such a great amount of data. Because the previous analysis proved that five-minute data could provide a reasonable basis for future analysis, it is cost-effective to archive aggregated five-minute TMS data.
Figure 6.1 shows that data storage encompasses both on-line and off-line storage of raw and processed data.
Off-line Storage
The off-line Historical Data Archive is comprised of both raw data and processed data. Original data stored in the master archive should not be modified as a result of user-specified data requests or data manipulation. Data should only be manipulated (e.g., editing, formatting, aggregation, cleaning, or fusion of data) from copies of the master archives. Cleaned or otherwise transformed data can co-exist with the original data in the Historical Data Archive.
Table 6.2 describes the capacity, cost, and durability features of CDR and magnetic tape. Both are recommended as cost-effective data storage devices for the Historical Data Archive. Table 6.1 shows the size of aggregated five-minute data. Magnetic tape backs up yearly data.
Table 6.2 Storage Media Features
Media Type Capacity (GB) Unit Cost ($/GB) Applications
CDR 0.65 0.39 Data and application distribution,
PC desktop storage Magnetic
Tape 70 1.78
Permanent data archival or storage for PC desktop or enterprise system
On-line Storage
Most archived data are distributed on-line through web queries. On-line data storage provides flexibility for data analysis. Three types of on-line data are designed for storage in DBMS: current 20-second raw data, the last 12 months of five-minute data, and hourly data from previous years. Twenty-second current-day raw data provides a real picture of data received from TMSs. It can be compared with cleaned data to verify data integrity. Five-minute data can satisfy different data needs. Current DBMS restricts the capacity to store an unlimited amount of data. Therefore, long-term historical data is only stored in a 60-minute level. This reduces the amount of data stored on-line. Users usually require detailed data for the most recent time periods. Therefore, this storage strategy balances data needs and DBMS limitations. Furthermore, storage of long-term hourly data also can improve the efficiency of data analysis. It can be processed from 60-minute data instead of five-minute data, thus reducing data size.