273
Volcano monitoring
James G. SmithU.S. Geological Survey, 12201 Sunrise Valley Drive, Reston, Virginia 20192, USA Jonathan Dehn
Alaska Volcano Observatory, Geophysical Institute, University of Alaska, Fairbanks, USA Richard P. Hoblitt
Richard G. LaHusen
U.S. Geological Survey, Cascades Volcano Observatory, 1300 SE Cardinal Court, Vancouver, Washington 98683, USA Jacob B. Lowenstern
U.S. Geological Survey, 345 Middlefi eld Road, Menlo Park, California 94025, USA Seth C. Moran
U.S. Geological Survey, Cascades Volcano Observatory, 1300 SE Cardinal Court, Vancouver, Washington 98683, USA Lindsay McClelland
U.S. National Park Service, Geologic Resources Division, Washington, D.C., USA Kenneth A. McGee
U.S. Geological Survey, Cascades Volcano Observatory, 1300 SE Cardinal Court, Vancouver, Washington 98683, USA Manuel Nathenson
U.S. Geological Survey, 345 Middlefi eld Road, Menlo Park, California 94025, USA Paul G. Okubo
U.S. Geological Survey, Hawaiian Volcano Observatory, Hawai‘i Volcanoes National Park, Hawai‘i, USA John S. Pallister
U.S. Geological Survey, Cascades Volcano Observatory, 1300 SE Cardinal Court, Vancouver, Washington 98683, USA Michael P. Poland
U.S. Geological Survey, Hawaiian Volcano Observatory, Hawai‘i Volcanoes National Park, Hawai‘i, USA John A. Power
David J. Schneider
U.S. Geological Survey, Alaska Volcano Observatory, Anchorage, Alaska, USA Thomas W. Sisson
U.S. Geological Survey, 345 Middlefi eld Road, Menlo Park, California 94025, USA
Smith, J.G., Dehn, J., Hoblitt, R.P., LaHusen, R.G., Lowenstern, J.B., Moran, S.C., McClelland, L., McGee, K.A., Nathenson, M., Okubo, P.G., Pallister, J.S., Poland, M.P., Power, J.A., Schneider, D.J., and Sisson, T.W., 2009, Volcano monitoring, in Young, R., and Norby, L., Geological Monitoring: Boulder, Colorado, Geological Society of America, p. 273–305, doi: 10.1130/2009.monitoring(12). For permission to copy, contact editing@geosociety.org. ©2009 The Geological Society of America. All rights reserved.
INTRODUCTION TO VOLCANO RESOURCES
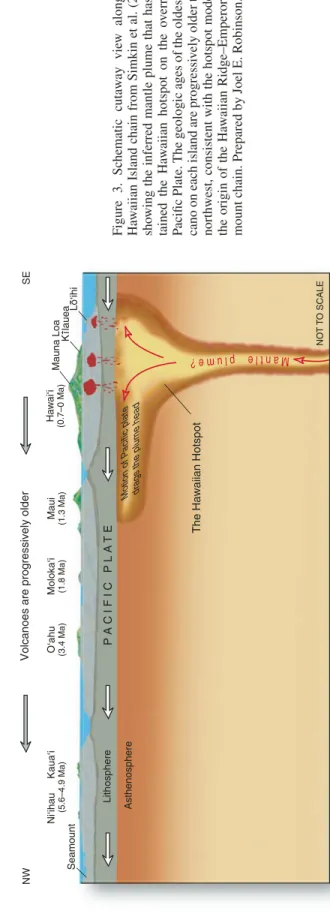
Volcanoes are not randomly distributed over the Earth’s surface. Most are concentrated on the edges of continents, along island chains, or beneath the sea where they form long mountain ranges. More than half of the world’s active volcanoes above sea level encircle the Pacifi c Ocean (see Fig. 1). The concept of plate tectonics explains the locations of volcanoes and their relation-ship to other large-scale geologic features. The Earth’s surface is made up of a patchwork of about a dozen large plates and a num-ber of smaller ones that move relative to one another at <1 cm to ~10 cm/yr (about the speed at which fi ngernails grow). These rigid plates, with average thickness of ~80 km, are separating, sliding past each other, or colliding on top of the Earth’s hot, viscous interior. Volcanoes tend to form where plates collide or spread apart (Fig. 2) but can also grow in the middle of a plate, like the Hawaiian volcanoes (Fig. 3).
Of the more than 1,500 volcanoes worldwide believed to have been active in the past 10,000 years, 169 are in the United States and its territories (Ewert et al., 2005) (see Fig. 4). As of spring 2007, two of these volcanoes, Kīlauea and Mount St. Hel-ens, are erupting, while several others, including Mauna Loa, Fourpeaked, Korovin, Veniaminof, and Anatahan, exhibit one or more signs of restlessness, such as anomalous earthquakes, deformation of the volcano’s surface, or changes in volume and composition of volcanic gas emissions, that could foretell the onset of another eruption.
Volcanoes, by virtue of their geology and typography, dis-play evocative landscapes and are home to diverse ecosystems, many of which are delicate and unique. Volcanic eruptions can obliterate landscapes and threaten lives, ecosystems and property. For example, the 1980 eruption of Mount St. Helens, although relatively modest on the scale of potential volcanic events in the United States, released energy equivalent to a 24-megaton explosion, devastating forests and obliterating wildlife, includ-ing almost 7,000 large game animals, over 600 km2, killing 57 people, and infl icting more than $1 billion in damages to local economy, agriculture, businesses, and structures. Thus, the very processes that produce the esthetic and ecological resources that we associate with volcanoes are also capable of destroying those resources in minutes.
Most volcanoes are capable of eruptions that pose signifi cant threats to natural landscapes, lives, ecosystems, and property, but fortunately, eruptions are typically preceded by weeks to months of increasing restlessness, allowing eruptions to be forecast if volcanoes are properly instrumented and data are interpreted by teams of experts in the fi elds of geology, seismology, geodesy, and geochemistry of volcanoes.
In the United States, the Robert T. Stafford Disaster Relief and Emergency Assistance Act mandates that the U.S. Geological Survey (USGS) issue timely warnings of potential geologic disas-ters to the affected populace and civil authorities. Through this act’s mandate, the USGS has the primary responsibility to moni-tor volcanic activity in the United States. The USGS maintains
Figure 1. Map of the world showing locations of volcanoes, many surrounding the Pacifi c Rim and along boundaries of other tectonic plates. Image courtesy of the Smithsonian Institution’s Global Volcanism Program (http://www.volcano. si.edu/world/fi nd_regions.cfm). For a more detailed map of volcanoes, earthquakes, impact craters and tectonic plates, see Simkin et al. (2006). Image prepared by Paul Kimberly, Smithsonian Institution Global Volcanism Program.
Figure 2. Schematic cross-section of plate tectonics from Simkin et al. (2006) sho
wing dif
ferent types of plate boundaries. Ima
ge prepared by José F . V igil and Robert I. T illing.
Figure 3. Schematic cuta
w
ay vie
w along the
Ha
w
aiian Island chain from Simkin et al. (2006)
sho
wing the inferred mantle plume that has
sus-tained the Ha
w
aiian hotspot on the o
v
erriding
P
acifi
c Plate.
The geologic ages of the oldest v
cano on each island are progressi
v
ely older to the
northwest, consistent with the hotspot model for the origin of the Ha
w
aiian Ridge–Emperor
Sea-mount chain. Prepared by Joel E. Robinson.
CONVERGENT PLATE BOUNDARY TRANSFORM PLATE BOUNDARY DIVERGENT PLATE BOUNDARY CONVERGENT PLATE BOUNDARY
CONTINENTAL RIFT ZONE
(YOUNG DIVERGENT PLATE BOUNDARY)
ISLA ND ARC VO LC AN ICA RC TREN CH TRE NC H STRATO- VOLCANO SHIELD VOLCANO SUB DU CTING PLATE SUBDUCT ING PLATE HOTSPOT EXTR ATERRE STRIAL OBJECT LITHOSPHERE ASTHENOSPHERE MANTLE PLUME ? CONTINENTAL CRUST
José F. Vigil and Robert I. Tilling
NO T T O SCALE OCEANIC CRUST SCHEMA TIC CR
OSS SECTION OF PLA
TE TECT ONICS OC EA NIC S PR EA DIN G RID GE Moho Moho MANTLE MA NTL E MA NTLE Mauna Loa Lö‘ihi K ilauea P A C I F I C P L A T E Lithosphere Asthenosphere NO T T O SCALE
Volcanoes are progressively older
NW
SE
The Hawaiian Hotspot
Ha w ai‘i (0.7–0 Ma) Maui (1.3 Ma) O‘ahu (3.4 Ma) Ni‘ihau Kaua‘i (5.6–4.9 Ma) Moloka‘i (1.8 Ma) Motion of P acific plate dr
ags the plume head
Seamount M a n t l e p l u m e ?
# # # # # # # # # # # # # # # # # # # # # # ## # # # # # # # # # # # # ## ## # # # # #### # # # # # # # # # # # ## # # # # # # # # # # # ## ### # ## # ## # # # # ## # # # ### # #### # # # # # # # # # # # # # # # # # # # ## # # # # # ## # ### # # ### ##### # # # # # # # # # # # # # # # # # # # # # # # ## # #
Marianas
Hawaii
Utah Montana California Idaho Nevada Oregon Arizona WyomingColorado New Mexico
Washington North Dakota Canada U.S.A. So. Dak.
Alaska
CanadaU.S. Volcanoes: Threat Levels
Er u p ti n g Re st le s s Ve ry h ig h Hig h Mo de ra te Lo w Ve ry lo w 01 0 0 2 0 0 5 0 Mile s 0 5 0 100 150 25 Mi les 0 5 0 100 150 25 Mi les 04 9 0 9 8 0 24 5 M ile s 04 0 8 0 1 2 0 M ile s 145°E 145°E 20°N 20°N 15°N 15°N 156°W 156°W 22°N 22°N 20°N 20° N -105°W -110°W -110°W -115°W -115°W -120°W -120°W -125°W 45°N 40°N 35° N 170°W 180°W 120°W 130°W 140°W 140°W 150°W 150°W 160°W 160°W 170°W 180°W 170°W 160°W 60°N 60°N 50°N 50°N
Figure 4. Map sho
wing locations of v
olcanoes in the United States, classifi
ed by threat le
v
el as determined by the U.S. Geological Surv
ey National V olcano Early W arning System.
monitoring networks consisting of large numbers and wide variet-ies of monitoring instruments in order to collect the data needed to forecast volcanic behavior and issue warnings and information to reduce the loss of life, property, and economic impact of hazards related to volcanoes. While the data obtained from these monitor-ing networks contribute to basic research and advance scientifi c understanding of volcanoes, the primary justifi cation for instru-ment deployinstru-ment is public safety and disaster reduction.
In this chapter, we will discuss the principal vital signs asso-ciated with volcanic eruptions, explain the methods for moni-toring them, and give a case study. The vital signs described include earthquake activity, ground deformation, gas emission, gas plumes, hydrologic activity, and slope instability. Monitoring methods range from well-established ones to the latest innova-tions that should become routine in the next few years.
Eruption Style and Frequency
Individual volcanoes erupt different combinations of lava fl ows, pyroclastic fl ows, and tephras (ash and coarser frag-mental ejecta). At some volcanoes, landslides, debris fl ows, and fl oods are as hazardous, or more hazardous, than the volcanic eruptions themselves. Debris fl ows are mixtures of mud, rocks, boulders, and water that travel at speeds of tens to as much as 100 km/h. Highly mobile debris fl ows originating on a volcano are also called lahars. Evaluating likely eruptive and hazardous events (event style, size, and frequency) at individual volcanoes is accomplished by constructing geologic maps and conducting hazard assessments.
Factors that infl uence eruption styles are: the diverse temper-atures and chemical compositions of magmas that feed a volcano; the rates at which magma reaches the surface; and local factors, such as the presence of faults or fractures that can serve as easy pathways for magma to reach the surface, or that allow volcanic gases to escape from magma non-explosively. These controlling factors are generally unknown or not suffi ciently understood ahead of time to aid in developing detailed hazard assessments or eruption forecasts. Instead, geologic mapping and associated investigations are used to examine, document, and quantify a volcano’s past activity. In these investigations, key characteris-tics are identifi ed that distinguish particular deposits from one another, and overlapping relations between deposits reveal the sequences of events. Tracing individual deposits across the land-scape allows geologists to determine the sizes of past events and thus estimate the regions likely to be affected by similar events in the future. Geologists collect samples suitable for age dating by various laboratory techniques. Together, the information on the types of events (eruptions, landslides, debris fl ows), their magnitudes, and their frequencies are combined to give a his-tory for a volcano. Unexpected features are usually encountered while determining this volcanic history, and detailed studies of these features advance the understanding of general volcanic pro-cesses, enabling better-designed monitoring strategies and more accurate forecasts of future behavior.
Volcanic events are probabilistic, that is, the time between eruptions, fl ank collapses, debris fl ows, or fl oods can be shorter or longer than the average, and the time intervals can be described by probability distributions (Nathenson, 2001). The simplest approach is to divide the number of known events by the total time encompassed to arrive at an average recurrence interval, but this approach has signifi cant drawbacks. Some volcanoes are known to undergo episodic behavior, where multiple events occur closely spaced in time, and then no events occur for a time interval much longer than the average. Clustering of events is probably typical of all volcanoes to some degree, and underlies the intuition that it is more dangerous to approach a volcano that erupted recently, than it is to approach a volcano which has not erupted for a long time. Furthermore, the likelihood of an event is coupled in some way with the magnitude of the event, with smaller eruptions, debris fl ows, landslides, or fl oods taking place more frequently than larger ones. Global data illustrate that long periods of quiet commonly precede the more explosive and dan-gerous eruptions. For example, of the 16 largest explosive erup-tions of the nineteenth and twentieth centuries, 12 were from vol-canoes with no previously known historical eruptions (Simkin and Siebert, 1994). Geologic mapping and related fi eld investiga-tions, coupled with age dating, provide the information neces-sary for probability estimates that link event style, magnitude, and frequency.
Volcano Hazards
Risks from a volcano’s hazards commonly extend well be-yond a volcano’s summit. For example, valley bottoms as far as 80 km beyond Mount Rainier’s summit are at risk of inundation by mudfl ows generated far up on its fl anks inside Mount Rainier National Park. More than 150,000 people live in these inunda-tion hazard areas and major transportainunda-tion lifelines cross them (Driedger and Scott, 2002). Lava fl ows from the presently rest-less Mauna Loa volcano in Hawai‘i can reach the highly devel-oped Kona Coast in as little as two hours. The potential harm these hazards can cause, in terms of loss of life and disruption to society and the economy on which it depends, are serious consid-erations for downslope communities.
Airborne ash clouds are a serious hazard to aircraft. Jet air-craft engines have failed after fl ying through drifting clouds of even thinly dispersed ash half a continent away from the volca-noes that created them. Large clouds of fi ne particles of volcanic ash are transported by winds for hundreds to thousands of km beyond their volcanic source (Fig. 5). Volcanic ash particles are angular, abrasive fragments of rocks, minerals, and volcanic glass the size of sand and silt; they have the hardness of a pocketknife blade (Kenedi et al., 2000; Neal et al., 1997). These particles abrade the turbine blades and leading surfaces of aircraft, cause failure of electronics, and melt and coalesce in engines, causing catastrophic and complete loss of power.
Volcanic ash is extremely abrasive. Prolonged breathing of ash causes nasal, throat, and eye irritation and infection in
both humans and animals. Shortness of breath, sore throats, and bronchitis can occur (from http://volcanoes.usgs.gov/ash/ cit-ing Blong, 1984). Layers of ash just a few millimeters thick will retard growth of plants and if ingested can sicken or kill animals, especially cattle and other domestic and wild ruminants. Thicker ash falls can smother people, plants, and animals. Ash falls can also ruin internal-combustion engines, cause roofs to collapse and communication networks to fail, and break electric power lines. Stones large enough to seriously injure or kill people, plants, and animals can be ejected as far as a few kilometers from an explo-sive volcano. Winds or even passing vehicles can stir ash back up into the air (Kenedi et al., 2000).
Periods of volcanic unrest, even those that do not lead to eruptions, will likely trigger emergency responses that can lead to area closures and community evacuations. Restless volcanoes challenge public offi cials because unrest creates uncertainty about how long restlessness will last, when it will end, its sever-ity, who will be affected by it, and even if an eruption will occur at all. All these uncertainties cause major psychological and economic impact in areas around a volcano. Uncertainty brings with it an intense demand for accurate and authoritative informa-tion. Civil authorities need information to insure public safety,
business owners use information to make business decisions, and news media seek all the information they can get all the time. Satisfying all these demands for accurate and up-to-the-minute information is not easy.
Volcano Threat Levels and Volcano Monitoring
Volcanic threat is a combination of destructive natural phe-nomena that a volcano is capable of producing (volcano hazard) and the people, property, and infrastructure at risk from these phenomena (exposure). Matching a volcano’s required monitor-ing level to its threat level provides the most safety for the most people and infrastructure at risk, and it most effi ciently distrib-utes funds and scientists’ time. Matching required monitoring to threat level became possible in 2005 when the USGS quantifi ed volcano hazard, risk exposure, and threat levels for all 169 geo-logically active volcanoes in the United States and its territories (Ewert et al., 2005).
Based on its numerical threat score, each volcano was placed in one of fi ve threat categories: very high, high, moder-ate, low, and very low. Fifty-fi ve of the nation’s volcanoes are defi ned as very high or high threat: this is nearly one-third of all potentially active U.S. volcanoes. Because many volcanoes are either unstudied or incompletely studied, threat scores will likely rise as future studies discover previously unknown past eruptive activity or unrest, and as population and infrastructure at risk increase.
In order to provide adequate warning, volcanoes with high or very high threat levels require intense real-time round-the-clock detailed monitoring. Signals from their monitoring instruments must be transmitted in real-time to a regional volcanic observa-tory so that volcanologists can quickly diagnose the meanings of the subtlest changes. As a rule of thumb, volcanoes in these two threat categories will require at least 12–20 permanent seismic stations within 20 km of the main volcanic vent, including sev-eral stations very close to the vent; routine deformation surveys and continuously recording permanent Global Positioning Sys-tem (GPS) stations; frequent airborne and ground station mea-surements of volcanic gases; and instruments along river valleys, sensitive to the unique sounds of passing mudfl ows, which trigger alarms to warn people downstream. Moderate-threat volcanoes will require real-time monitoring to detect weak pre-eruptive signals as they occur. Typical coverage will require six seismic stations within 20 km of a volcano, including three to four high on its fl ank, at least six continuously recording, permanent GPS stations in the vicinity, infrequent gas measurements as appropri-ate for each volcano, and mudfl ow detectors along river valleys (Ewert et al., 2005).
Of course, if unrest were to start or escalate, or if monitoring data suggested that a given volcano might be moving toward an eruption, monitoring would have to be augmented as quickly as possible for accurate current data to be obtained. In response to increased concern, a wider variety of volcanic phenomena would have to be monitored. New types of instruments would have to Figure 5. Image of types of volcano hazards. From Myers and
be installed, existing networks of instruments would have to be augmented by reconfi guring existing instruments and adding new ones, and data transmission networks would have to be forti-fi ed—all to enable volcanologists to interpret volcanic unrest and forecast likely consequences around the clock.
Low-threat and very low-threat volcanoes, on the other hand, require a lower level of monitoring. For these volcanoes, as for all volcanoes, baseline seismic, deformation, gas, and hydrologic baseline data need to be established, after which low-threat volca-noes require only enough monitoring to detect anomalous activ-ity in near-real time. Very low-threat volcanoes would require even less monitoring.
Because resources were insuffi cient to instrument and moni-tor all potentially active volcanoes at an adequate level until quite recently, volcano monitoring by the USGS was done reactively; that is, adequate monitoring was not put in place until some form of unrest was observed at the Earth’s surface. Therefore, precur-sory signals went undetected, and the interval between the fi rst observed signs of unrest and a volcanic crisis was often short. Thus, civil authorities, citizens, businesses, and scientists were forced into playing a dangerous game of “catch up” with vol-canoes. Authorities worked overtime to put civil-defense mea-sures in place before unrest escalated to dangerous levels, while volcanologists scrambled to augment instrumentation and install upgraded communication networks, often at great expense and danger to themselves.
Quantitative determination of the specifi c threat level for each U.S. volcano would allow the USGS to apportion resources so that the most threatening volcanoes could be monitored round-the-clock well before they show any signs of unrest. This proactive approach to monitoring, were it to be implemented, would make it possible for volcanologists to send at-risk com-munities reliable information from the onset of restlessness, thus giving them the maximum amount of time to activate response and mitigation plans. Proactive monitoring by the USGS gives volcanologists the maximum amount of time to augment moni-toring should that be necessary. Even though not every restless volcano erupts, proactive monitoring is still necessary to mini-mize either overreacting, which costs money, or underreacting, which can cost lives. However, the major obstacle to implement-ing proactive monitorimplement-ing in the United States and throughout the world is fi nding the resources to pay for the necessary equipment and scientists.
Proactive monitoring offers many practical advantages over reactive monitoring. Monitoring:
• Minimizes risk of surprise eruptions.
• Increases time to implement civil defense measures before unrest escalates and a volcanic crisis worsens.
• Enables safe installation of instruments and communica-tion networks at preplanned sites in an orderly fashion. Most very high-threat and high-threat volcanoes in the United States are towering snow- and glacier-clad peaks that are inaccessible except during a short summer season, whereas onset of volcanic restlessness can occur in any
season. Summertime installation and equipment mainte-nance maximizes the probability that preferred sites are snow free, ensures maximum safety for volcanologists and support personnel, and gives adequate time to test instru-ments and communication networks.
• Increases safety to the more than 80,000 airline passen-gers per day who fl y the busy air routes along the Cascade and Aleutian volcanic arcs. When fully implemented, pro-active monitoring of these arc volcanoes will enable vol-canologists to notify the Federal Aviation Administration (FAA) within fi ve minutes after a major explosive erup-tion, allowing planes to change course quickly to avoid ash clouds.
• Improves accuracy and timeliness of future warnings. During the past 25 years, understanding of basic volcanic processes has improved tremendously, based in part on data gained from long-term volcano monitoring. Monitor-ing data help volcanologists formulate and test models of how volcanoes work. Better models, in turn, improve how volcanoes are monitored, identify the most effective moni-toring methods, and suggest new monimoni-toring techniques. • Adds scientifi c credibility to land managers’ designations
of safe areas that can remain open to visitors—in some cases even while a volcano continues to erupt. After 18 years of relative quiescence, Mount St. Helens reawak-ened in late 2004 when swarms of small earthquakes were detected by the USGS, alerting volcanologists to the presence of magma beneath the volcano. The U.S. Forest Service closed all access to the mountain. Over the next year or so, a series of lava domes episodically extruded within the volcano crater, accompanied by explosions and rockfalls (Schilling et al., 2006). How-ever, by mid-2006, USGS monitoring indicated slowing dome growth, falling rates of volcanic gas emission, and an end to explosive blasts whose effects extend beyond the crater. Although the present dome continued to grow at the rate of about a dump-truck load per minute, which rendered the crater off limits for a time, USGS volcanol-ogists were able to provide guidance to U.S. Forest Ser-vice offi cials, allowing them to reopen trails to the sum-mit in mid-2006. A Web-enabled system for obtaining climbing permits helps ensure visitor safety and allows quick notifi cation should volcanic activity change (U.S. Forest Service, [2007–]).
Restless and Erupting Volcanoes Create Management Challenges
Restless and erupting volcanoes create short- and long-term problems for land managers and civil authorities. Deciding how best to protect human safety while maintaining access and con-tinuing daily life, even while restlessness continues, causes the most short-term challenges. Deciding where to rebuild dam-aged and destroyed facilities and how to manage destroyed and
damaged natural resources creates longer-term challenges. A few real examples of problems and responses to volcanic unrest illustrate the challenges land managers and civil authorities potentially face. (For more examples and greater detail, see the day-by-day account of events and responses preceding the cata-clysmic eruption of Mount St. Helens volcano on 18 May 1980 in Klimasauskas, 2001.)
Restless and erupting volcanoes:
• Attract spectators who are naively unaware of volca-noes’ dangers, but who are nonetheless eager to see the activity for themselves up close. On 1 April 1980, six weeks before a restless Mount St. Helens erupted cata-clysmically, two counties near the volcano asked their state’s National Guard for assistance. The counties had maintained six roadblocks around the clock for just four days before they realized they were unable to keep people from entering offi cially designated danger zones. An FAA spokesman estimated that as many as 100 planes were in the controlled fl ight zone around the volcano on the same day. Many planes intentionally maintained radio silence presumably to escape detection (Klimasauskas, 2001). A study of wilderness hikers in Hawai‘i Volcanoes National Park who ignored prominent National Park Service (NPS) warning signs and attempted to reach active lava fl ows found that 77% suffered from dehydration, more than half returned with scrapes and abrasions, and 6% suffered from broken bones. “Many hikers were inexperienced tourists willing to disregard warning signs and enter high-risk areas” (Heggie and Heggie, 2004). Several hikers have even died (Johnson et al., 2000). Takahashi et al. (2003, photos 44, 45, and 55) show the spectacular meet-ing of molten lava with the ocean that draws park visitors to ignore warnings.
• Require designating areas of restricted access and complete exclusion which in turn requires posting signs, disseminat-ing restrictions to the public, and increasdisseminat-ing law enforce-ment staff to ensure the public are kept out of harm’s way. Boundaries of closed areas have to be adjusted as volcanic unrest waxes and wanes, sometimes for reasons other than public safety. On 8 April 1980, at Mount St. Helens, “Offi -cials moved the roadblock on State Route 503 from Jack’s Store back to the Swift Canal east of Cougar after local merchants threatened to sue them over loss of business” (Klimasauskas, 2001). This action moved the restricted area’s boundary closer to the volcano. On 10 April 1980, the reported cost of maintaining roadblocks in the vicinity of Mount St. Helens was $9,000 per day. To save money, the U.S. Forest Service closed its press center and grounded its two observation planes. On 15 April 1980, one county shut down some of its roadblocks citing “expense, pub-lic harassment, and the stable pattern of explosions at the volcano” (Klimasauskas, 2001). Mount St. Helens’ cata-clysmic eruption occurred 34 days later. These kinds of
problems can be mitigated. For example, close collabo-ration between the USGS scientists who monitor Hawai-ian volcanoes and Hawai‘i Volcanoes National Park staff enables the NPS to post regularly updated information on safe and unsafe areas on the park’s Web site (http://www. nps.gov/havo/closed_areas.htm).
• Affect plants, animals (even insects), and humans. In ex-treme cases, volcanic ash increases morbidity and mortal-ity of plants and animals in the short term. Lava, ash, and other eruptive materials are sterile when fi rst deposited. Only after weathering do they become the rich, productive volcanic soils typically associated with volcanoes. In the short term, volcanic ash has a deleterious effect on plants and animals. For example, pine trees growing on recently deposited volcanic ash grow more slowly and are shorter than the same species growing on nearby unaffected soils (Ishii et al., 2003). Ash also can clog streams and raise their acidity to levels lethal to fi sh and aquatic plants. On 2 April 1980, “Operators of a fi sh hatchery some 5 miles from Mount St. Helens reported a decrease in pH from 6.8 to 5.8 caused by stream leaching of upstream volca-nic ash. At a pH of 5.0 the fi sh would die, so hatchery managers decided to release the salmon when the pH fell to 5.5” (Klimasauskas, 2001). Ruminants are vulnerable to chemical poisoning when they graze in areas where volcanic ash has fallen and to starvation in areas covered by extensive ash deposits (Blong, 1984). Even insects are affected by ash falls; numbers of some species are sig-nifi cantly reduced while others, freed of insect predators, become pests (Fuentes, 1975). See also Brosnan (2000) for a volcano’s effect on plant life.
• Create stress on land management and law enforcement agencies and their staffs to answer public requests for information. Requested information is not necessarily rel-evant to the emergency situation, and contacts by irate citi-zens are common. On 31 March 1980, local newspapers reported that calls to the U.S. Forest Service offi ces about restless Mount St. Helens included calls from “frustrated citizens who could not access their cabins within closed areas while members of the press had been allowed in…” to “gamblers requesting the number of explosions in the previous 24 hours, to those blaming the volcano’s restless-ness on the desecration of Indian graves in the area” (Kli-masauskas, 2001).
• Require decisions under pressure on when to relocate or close facilities and businesses, move valuable portable equipment, and relocate people working and living in newly restricted areas. Relocations and closures, or just the uncertain possibility of them, can result in signifi cant changes in how businesses and government agencies func-tion. These changes commonly affect local economic activ-ity, which generates pressure to avoid economic loss by delaying decisions or rescinding decisions already made.
Conclusions
A variety of precursory signals are generated by the many processes that occur as molten rock (magma) forces its way up through miles of the Earth’s crust before eruption at the surface. Many of these signals are extremely subtle and complex, and consequently require expensive arrays of sensitive instruments to detect and scientists with years of experience to interpret. The sections in the rest of this chapter outline the different major techniques used by the USGS to detect, quantify, and interpret each type of signal. In one way or another, each technique tracks types, magnitudes, and locations of earthquakes; uplift and sub-sidence of the ground surface; or changes in heat, water, and gasses emitted by volcanoes. Because the techniques measure different processes that occur during magma ascent, effective monitoring requires applying many techniques simultaneously to assess near-real-time developments at a volcano.
Just as doctors monitor patients’ potential future health risks by studying their medical histories and interpreting results of lab tests over time, so, too, do volcanologists learn about the possibility and size of future volcanic activity by studying a vol-cano’s historic activity and measuring and evaluating the sig-nals it generates over many years. Doctors and volcanologists both know that routine monitoring over time is the best way to detect potential future problems early, when they are most eas-ily dealt with. While patients can go to laboratories for tests, volcanologists can only assess the state of volcanoes in the fi eld by placing monitoring instruments on and near them. Ideally, complete networks of monitoring instruments are put in place while potentially active volcanoes are still quiet. By missing the earliest signals of restlessness, volcanologists risk losing critical early data needed to establish “baseline” trends and accurately estimate the size of a possible eruption. For example, when Mount St. Helens reawakened in 2004, additional monitoring instruments could not be installed rapidly enough to catch the volcano’s initial signals. This prevented confi dent determination of the volume of magma intruded beneath the volcano (Ewert et al., 2005), which in turn added signifi cant error to estimates of the size of potential eruptions.
For updates on activity of U.S. volcanoes in the past seven days, see http://volcanoes.usgs.gov/vhpfeed.php.
STRESSORS/POSSIBLE CHANGE
Volcano monitoring methods are designed to detect and mea-sure signals caused by magma movement beneath a volcano. Ris-ing magma typically will (1) trigger swarms of earthquakes and other types of seismic events; (2) cause deformation (swelling or subsidence) of a volcano’s summit or fl anks; and (3) lead to release of volcanic gases from the ground and vents. By monitor-ing changes in the state of a volcano, scientists are sometimes able to anticipate an eruption days to weeks in advance and to detect remotely the occurrence of certain related events like explosive
eruptions and lahars (Guffanti et al., 2001). (See Table 1 for a summary of volcano vital signs and monitoring methods.)
VITAL SIGN MONITORING DESCRIPTIONS
Vital Sign 1. Earthquake Activity
Introduction
Movement of magma and associated fl uids within volca-noes often occurs with concurrent, measurable earthquake activ-ity (seismicity). At restless volcanoes, evolving seismic activity commonly, but not always, precedes eruptions. The most com-mon seismic disturbances are earthquakes in response to stress changes caused by magma movement beneath a volcano.
When magma rapidly intrudes into surrounding rock, the rock breaks abruptly, causing an earthquake whose signal is simi-lar to that of an earthquake along a tectonic fault (Fig. 6A). This type of earthquake is called a volcano-tectonic (VT) earthquake. VT earthquake signatures are characterized by clear and often impulsive, or abrupt, wave onsets and contain energy across a broad range of seismic frequencies.
A second type of earthquake associated with volcanic areas is the direct result of magma or other fl uids fl owing through con-duits in volcanic or active hydrothermal areas (Fig. 6B). Pressure variations in fl owing magma or hydrothermal fl uids force the cracks through which these fl uids move to vibrate. Compared to VT earthquakes, these earthquakes appear with a dominant and lower frequency of oscillation and are called long-period (LP)
earthquakes (e.g., Lahr et al., 1994; Harlow et al., 1996).
In addition to volcanic earthquakes, continuous or sustained ground oscillation is often observed at restless volcanoes. This is referred to as volcanic tremor and is closely linked to LP earth-quakes. Tremor can be thought of as sustained crack vibration driven by the moving magma (Fig. 6B and parts of 6C).
Explosions at a volcano’s vent or at shallow depths beneath the vent create the fourth type of common volcanic earthquakes. Naturally enough, these are called explosion earthquakes. Figure 6D shows a recording of a small explosive event at Mount Pinatubo that lasted for only a few minutes. However, sequences of explosion earthquakes can go on for hours as they did at the cataclysmic eruption of Mount St. Helens in 1980. Explosion earthquakes are generally accompanied by forceful ejection of steam, volcanic gases, ash, and fragments of lava in various proportions.
For additional information on seismic monitoring methods, see Braile (this volume).
Level 3, Method 1: Seismic Monitoring
Volcanic eruptions are almost always preceded by increasing seismicity, and the most reliable indicators of impending erup-tion are shallow earthquakes and tremor (e.g., Chouet, 1996). Typically, volcanic unrest begins deep beneath a volcano and progresses to shallower depths as time to eruption approaches.
The object of seismic monitoring at volcanoes is to record and monitor the earthquakes and tremor that accompany volcanic unrest. Seismographic networks record the signals radiated from volcanic seismic sources, then specialists analyze and interpret these signals and their patterns.
Seismologists use seismic data from a network of seismom-eters to locate an earthquake’s hypocenter (the point directly beneath the Earth’s surface where the rupture on a fault begins) and its epicenter (the point on the Earth’s surface directly above the hypocenter). Seismicity can be detected at greater distances and from deeper sources than other signs of volcanic unrest. Therefore, seismic monitoring typically provides the earliest sig-nals of volcanic unrest.Evolving patterns of hypocenters and epi-centers help scientists to infer whether magma is moving either vertically or laterally. Cataloging events as either VT or LP helps
distinguish between tectonic faulting and moving magma earth-quake origins.
Seismographic Networks
Effective volcano monitoring networks extend from the volcanic center or active vent outward to distances of 20 km. To determine especially shallow source depths precisely, several seismic monitoring stations in the network must lie within a few kilometers of the vent. To locate epicenters and hypocenters pre-cisely, stations should be distributed evenly around a volcano at varying distances from the vent. Best practice requires 10–20 seis-mographic stations around each potentially hazardous volcano in the United States.
Each monitoring station in a network is equipped with a seismometer, electronics to amplify and convert the signals for
TABLE 1. SUMMARY OF VOLCANO VITAL SIGNS AND MONITORING METHODS l a i c e p S e s i t r e p x E s d o h t e m d n a s n g i s l a t i V equipment
Cost* Personnel Labor
intensity† Earthquake activity i c S y t i v i t c a c i m s i e
S entist Yes $$$ Group High
Ground deformation h g i H p u o r G $ $ $ s e Y t s i t n e i c S ) M D E ( g n i r u s a e m e c n a t s i d c i n o r t c e l E h g i H p u o r G $ $ $ s e Y t s i t n e i c S n o i t a l u g n a i r T h g i H p u o r G $ $ $ s e Y t s i t n e i c S g n il e v e L h g i H p u o r G $ $ $ s e Y t s i t n e i c S t li T
Global Positioning System (GPS) Scientist Yes $$$ Group High
Aerial photography/light detection and ranging (LIDAR) Scientist Yes $$$ Group High
Interferometric synthetic aperture radar (InSAR) Scientist Yes $$$ Group High
Emission at ground level
Direct fumarole sampling of gases and isotopes Scientist Yes $$$ Group High
On-site instrumental measurements
(open-path Fourier transform infrared spectrometer, differential optical absorption spectrometer, gas chromatograph)
Scientist Yes $$$ Group High
c S s t n e m e r u s a e m x u l f f e li o
S ientist Yes $$$ Group High
Emission of gas plume and ash clouds
Correlation spectrometer (COSPEC) and Mini-UV spectrometer (Flyspec)
Scientist Yes $$$ Group High
h g i H p u o r G $ $ $ s e Y t s i t n e i c S ) r e t e m o r t c e p s d e r a r f n i ( R O C -I L h g i H p u o r G $ $ $ – $ s e Y t s i t n e i c S r a d a r r e l p p o D Hydrologic activity s i t n e i c S y t i v i t c a c i g o l o r d y
H t Yes $$$ Group Medium-high
Slope instability
(see Hillslope chapter for determining types of landslides and triggers and causes of landslides)
h g i H p u o r G $ $ s e Y t s i t n e i c S ) S I G + Z R A H A L ( n o i t a e n il e d d r a z a h r a h a L
Real-time monitoring of lahars—acoustic flow monitor
(AFM)
Scientist Yes $$$ Group High
Techniques that can be used to monitor various vital signs
h g i H p u o r G $ $ $ s e Y t s i t n e i c S e t il l e t a s a i v g n i s n e s e t o m e R h g i H p u o r G $ $ $ s e Y t s i t n e i c S ) V A U ( s e l c i h e v l a i r e a d e n n a m n U
Interferometric synthetic aperture radar (InSAR) Scientist Yes $$$ Group High
h g i H p u o r G $ $ $ s e Y t s i t n e i c S d n u o s a r f n I
*Cost (in US$): $ = <$1,000; $$ = $1,000–$10,000; $$$ = >$10,000.
transmission, telemetry components, and batteries and solar panels to power the station. The seismometer is buried 1–2 m beneath the ground’s surface. The station’s electronics and power components are installed in small, above-ground housings. The transmission antenna and the solar panel, if not installed atop the station housing, are installed on a short mast. Stations are designed to minimize the impact of the station installation and operation in remote or wilderness areas.
The seismometer registers ground motions, and converts the motions to electrical signals. The converted signals are teleme-tered in either analog or digital form to a nearby volcano obser-vatory. In general, analog stations cost less to buy and install, use less power, and transmit their signals over longer distances than digital stations. Digital stations provide higher quality data and therefore more accurate recordings of seismic shaking. Once installed, they are simpler to maintain than analog stations. Many seismographic networks use combinations of analog and digi-tal stations. An analog station costs $7,000 to $10,000, while a digital station costs $15,000 to $20,000 (all amounts herein are in US$). In the future, it is likely that the performance advan-tages of digital stations will become more important than the cost
differences. Therefore, the proportion of digital seismic stations in volcano monitoring networks will likely increase.
Seismic Data Processing
Data telemetered from fi eld stations to a volcano observa-tory are collected onto customized computer systems that make possible real-time and near-real-time analysis of seismic data streams and near-real-time posting of seismic analysis products. Important analysis products include locations of epicenters and hypocenters, earthquake magnitudes and continuous seismic amplitude and spectral displays. Real-time data analysis and dis-play greatly facilitates short-term eruption forecasting and evolv-ing hazard assessment. Observatory staff members interactively review the analysis products to verify the output and enter addi-tional information that more completely describes the events. A computer system with these capabilities consists of a number of workstation computers and costs several tens of thousands of dollars. The computers also store and archive the data. Software packages for seismic data acquisition and analysis are commer-cially available. Alternatively, similar software packages have been developed, are maintained, and made available by the U.S. Geological Survey.
Discussion
While increased seismicity commonly precedes volcanic eruptions, the time from the earliest earthquakes to an eruption varies widely. Increasing numbers of volcano-tectonic earth-quakes may occur months or even years before an eruption. However, not every increasingly restless volcano erupts; seismic activity may wax and wane without an eruption for long periods of time.
Volcanic processes are complex and variable, and therefore produce multiple types, patterns, and numbers of earthquakes (e.g., Chouet, 2003). Missing a volcano’s crucial early seismic signals impedes scientists’ ability to accurately forecast events. Protection of people and property requires installation of seismic monitoring networks at potentially dangerous volcanoes to mea-sure baseline seismicity and monitor for suggestive increases in seismicity, well before unrest begins or obvious signs of signifi -cant unrest are noticed at the Earth’s surface.
Baseline seismic monitoring of seismic signals from earth-quakes near a volcano as well as from the other side of the globe as they travel through a volcano enables scientists to catch the beginnings of unrest and to determine locations of faults and possible accumulations of magma. Volcano scientists use this knowledge to improve their assessment of a volcano’s eruption probability, volume of erupted magma, and location of hazard-ous areas.
Vital Sign 2. Ground Deformation
Introduction
As magma moves beneath a volcano, it creates space for itself by displacing the Earth’s surface. Quantifying the characteristics Figure 6. Examples of seismic event signatures observed at Mount
Pinatubo in the Philippines, as interpreted and reproduced from Fig-ure 3 of Harlow et al. (1996). (A) Long-period earthquake (LP) and volcano-tectonic earthquake (VT). (B) Tremor consisting of closely spaced LP earthquakes. (C) Tremor consisting of closely spaced deep LP earthquakes. (D) Explosive eruption signal. Time sequence on each seismographic recording is from upper left to lower right; evenly spaced tick marks along each trace mark one-minute intervals.
of this deformation over space and time can give important information about the depth, volume change, and geometry of magma reservoirs below the ground. For example, when magma accumulates beneath a volcano, perhaps as a prelude to an erup-tion, the overlying surface will infl ate like a balloon. Similarly, after magma has been erupted, or when magma drains to deeper levels or moves laterally below ground to other locations, the surface defl ates in response to this removal of the volume. A more detailed explanation is available at http://hvo.wr.usgs.gov/ howwork/subsidence/infl ate_defl ate.html. Displacements of the Earth’s surface can be measured by a variety of methods, includ-ing both terrestrial and space-based technologies. Each method has advantages and disadvantages; therefore, deformation moni-toring should not rely on a single technique, but should instead incorporate as many methods as possible. Concurrently utilizing several different methods offers the best chance of recognizing surface displacements at a volcano and providing information on the probability and timing of an eruption.
Trailing-Edge Technologies
Though several classic volcano deformation monitoring methods have been replaced by newer methods due to techno-logical advancements, these older monitoring methods may still be useful at some volcanoes. These classic methods include electronic distance measurement (EDM) and triangulation. Both methods require precisely located ground points as references for the measurements. Called benchmarks, these points are com-mon, especially at the tops of hills and mountain peaks. Bench-marks are usually brass or aluminum disks (Fig. 7A) with center-ing marks (often a cross or dimple), but can also be less obvious pins (Fig. 7B) or shapes chiseled into rock. It is important that these marks are not disturbed, because they are used for repeat surveys over time. If the marks are destroyed or moved, they can-not be reoccupied and volcano deformation monitoring capabili-ties are diminished.
Level 3, Method 1: Electronic Distance Measuring (EDM) EDM measures the distance between two points by placing a laser over a benchmark at one point, pointing it at a refl ector array over a benchmark at a second point (perhaps as far away as tens of kilometers), measuring the travel time of a laser pulse between the two benchmarks, and then converting the time to dis-tance. Measured distances are accurate to within a few centime-ters. EDM requires at least two people, one at the laser and one at the refl ector site. Because variations in atmospheric conditions are the primary source of error in EDM, temperature and atmo-spheric pressure measurements at both endpoints and along the track of the laser via aircraft are recommended. Repeat measure-ments between a pair of sites show how the distance changes over time. The Web site http://volcanoes.usgs.gov/activity/methods/ deformation/index.php provides a more detailed explanation under the EDM tab.
Networks of EDM line-length measurements were state-of-the-art for determining volcano deformation in the 1960s–1980s.
Because EDM is now outdated, EDM equipment is diffi cult to purchase. Instruments can cost $20,000 to $30,000, depending on the model. Refl ectors are over $100 each.
Level 3, Method 2: Triangulation
Triangulation uses precise surveying instruments to measure the horizontal angles of a triangle whose vertices are benchmarks that may be tens of kilometers distant from one another. Changes in the angles over time are used to determine horizontal defor-mation of the Earth’s surface. Vertical angle measurements, for example, from the base of a hill or mountain to its top, may also be taken to determine changes in elevation over time. Triangulation Figure 7. Benchmarks are cemented into the ground and provide known points that can be surveyed year after year. (A) Typical brass disk benchmark, ~10 cm in diameter. The cross at the center of the triangle is the center point of the mark, and is used as the reference point for deformation studies. (B) Occasionally, less conspicuous pins, only ~2 cm in diameter and with center punch at the top, are used as benchmarks. These are harder to see and less likely to be stolen.
requires a signifi cant investment of time for relatively little data (repeated measurements from each of the vertices in the triangle are required). The instrument used to collect angle measurements is a theodolite, which can cost as much as $20,000.
Though EDM and triangulation were once important defor-mation monitoring methods, the Global Positioning System (GPS) has largely replaced them. GPS provides better data than most of the classic deformation monitoring methods while requir-ing less time and personnel (though more specialized trainrequir-ing and advanced computing routines are required). Still, many volcano monitoring networks in the United States were originally estab-lished using EDM. By comparing past EDM surveys with recent measurements using GPS, it is possible to determine line-length or angle changes since the time of the previous measurement, which can be quite useful for determining long-term deformation of a given volcano. This practice also continues the time series of deformation data, allowing for easier recognition of anomalous signals. For example, an EDM network was established at Lassen Peak in Lassen Volcanic National Park in 1981. InSAR results analyzed in 2004 suggested that the volcano is subsiding ~1.5 cm per year. To obtain independent ground measurements, the EDM network was reoccupied with GPS that same year. Results con-fi rmed the subsidence and suggested that the deformation has been occurring since at least the 1980s.
Both EDM and triangulation measurements require clear lines of sight between the instrument station and target loca-tions. Thus, EDM and triangulation benchmarks tend to be on the tops of hills or mountains, which are often diffi cult and costly to access. In these cases, it is wise to abandon these sites and establish new GPS stations at more accessible locations. This will reduce the need for helicopter access, decreasing both the expense and intrusiveness of deformation monitoring.
Level 3, Method 3: Leveling
Another classic surveying technique is leveling, a method which measures vertical elevations of benchmarks. Unlike EDM and triangulation, however, leveling is still regularly used today. Repeated leveling surveys along a series of benchmarks can deter-mine elevation changes over time to sub-millimeter accuracy. No other method, with the possible exception of continuous GPS, is as sensitive to vertical deformation.
Leveling is accomplished using a pair of precisely gradu-ated rods made of invar (a metal with a low coeffi cient of ther-mal expansion), usually 2–3 m tall, and a leveling “gun” (a sight designed to take readings from the rods). The gun is positioned between the two rods and precisely balanced, and the gradu-ations on each rod are read by looking through the gun sight (Fig. 8). Differencing the rod readings determines the differ-ence in elevation between the two rods. After the reading is completed and recorded, one rod leapfrogs the other, the gun is repositioned, and the measurement is repeated. By continu-ing these measurements along a transect between benchmarks, it is possible to determine the relative elevations of a network of benchmarks. Over time, repeated leveling surveys show how
benchmark elevations change, perhaps as a result of magmatic activity beneath the surface.
Leveling surveys require four to six people: one person to operate the leveling gun, two people to hold the rods, and one to three people to support the survey by fi nding benchmarks, collecting temperature readings, recording measurements, and directing traffi c (most leveling lines are located along roads). An experienced leveling crew can typically survey 5–7 km per day, depending on topography and desired accuracy. Leveling equip-ment may require reading and recording by the gun operator and an assistant, or may be digitally recorded. In the latter case, the leveling rods have barcodes on them instead of numerical gradu-ations. The gun reads the barcode and determines the elevation difference between rod locations, recording the measurement on a memory card.
A leveling gun costs about $3,000; leveling rods are about $1,000 each for either a digital (barcode) or an optical (gradu-ated) model. Ancillary equipment, including temperature probes, tripods, and traffi c signs could cost as much as $1,000. Because the rod scale must be as accurate as possible, recalibration is rec-ommended every 2–4 years (depending on the desired accuracy and frequency of use). Calibration of the rods can only be done by a university laboratory in Quebec and costs about $1,000.
Leveling is still used at numerous volcanoes worldwide. For example, in Hawai‘i Volcanoes National Park, annual level-ing surveys are an important and informative monitorlevel-ing method because their great accuracy has shown changes in the magni-tude and direction of vertical deformation of Kīlauea volcano. Since the start of the Pu‘u ‘Ō‘ō eruption in 1983 through 2003, the summit of the volcano subsided by as much as 1.5 m. How-ever, the displacement pattern changed to uplift in late 2003, perhaps indicating increasing magma supply to the volcano that may be a precursor to future changes in eruptive activity. In fact, uplift continued through 2007, when new eruptive vents broke Figure 8. Leveling crew working in Hawai‘i Volcanoes National Park.
out on the east rift zone, leading to a major change in the erup-tive style of Kīlauea Volcano. Leveling surveys have also helped characterize volcanic unrest at Yellowstone National Park, where similar changes from uplift to subsidence, thought to be related to the subsurface circulation of hydrothermal fl uids, have been observed over short (1–2 year) time spans.
The most useful applications of leveling are on relatively fl at volcanoes that are well covered by roads. Because of the large commitment of time and personnel required by the method, level-ing over extreme topography or rough terrain, which requires an inordinate amount of time, generally does not justify the cost. For this reason, leveling is an excellent tool for monitoring volcanoes like Yellowstone caldera, but not optimal for use at stratovolca-noes (steep, conical volcanoes built by the eruption of viscous lava fl ows, tephra, and pyroclastic fl ows) such as Mount Rainier.
Level 3, Method 4: Tilt
Ground tilt has been used to monitor volcano deformation for almost 100 years. Thomas A. Jaggar, founder of the Hawaiian Volcano Observatory, fi rst used tilt to monitor volcanic activity at Kīlauea, Hawai‘i, in 1912. Since that time, instrumentation and techniques for measuring tilt have evolved through several itera-tions. The most cost-effective and modern method uses tiltmeters that are installed in shallow boreholes.
A borehole tiltmeter is analogous to a carpenter’s level. The instrument is a cylinder, 0.6–1 m in length (Fig. 9) and fi lled with an electrolytic fl uid that contains a bubble. Electrodes sense the movement of the bubble as the instrument tilts. By placing the tiltmeter in a sand-fi lled borehole in bedrock, ~2 m deep (which effectively couples the instrument to the Earth), the tilt of the ground surface can be measured. Using a network of tiltmeters,
sources of infl ation or defl ation at active volcanoes can be iden-tifi ed. More information and examples are available at http:// volcanoes.usgs.gov/activity/methods/deformation/index.php at the tilt tab.
Tilt data can be stored at the instrument site in a data log-ger and periodically downloaded, but it is far more practical to telemeter the data, ideally in real time, to a volcano observatory. The processing and interpretation of tilt data is trivial, since volt-ages output by the instrument translate directly to magnitude and direction of ground tilt via a simple calibration factor. The simplicity of the data and processing makes tiltmeters attractive as monitoring instruments, but note that tiltmeters do not record displacements, only tilt. Also, the instruments are quite sensi-tive to environmental changes, including temperature fl uctua-tions between day and night, atmospheric pressure changes, and rainfall. Thus, tiltmeter sites should be equipped with rain gages, thermometers, and barometers so that raw tilt data can be inter-preted with respect to environmental factors.
A tiltmeter costs about $8,000, but much additional equip-ment is needed to operate a telemetered tiltmeter station. A data logger and radios (which can telemeter both the tilt and environ-mental data) for the site and a receiving station cost an additional $6,000, and a portable drill (hundreds to a few thousand dollars) is needed to make the borehole. Batteries and solar panels, at a cost of $1,000, are necessary to keep the instrument operational, and environmental sensors (thermometer, barometer, and rain gage) can cost a few hundred dollars.
The best example of tilt as a volcano monitoring method is provided by the Hawaiian Volcano Observatory. In Hawai‘i Volcanoes National Park, almost 20 borehole tiltmeters moni-tor Kīlauea and Mauna Loa volcanoes. Each instrument takes a reading once a minute, which is immediately telemetered to the Hawaiian Volcano Observatory. These near-real time tilt measure-ments routinely provide short-term warnings of changes in volca-nic activity, like the new magmatic intrusions in 1997 and 1999, and the 2008 episodic defl ation/infl ation episodes at Kīlauea’s summit that lasted hours to two days. No other technique that is currently in use can detect such activity as it occurs.
Level 3, Method 5: Global Positioning System (GPS)
In the late 1980s, the Global Positioning System (GPS) became a viable method for measuring deformation of the Earth’s surface, gradually replacing EDM and triangulation. The primary advantage of GPS over all other deformation monitoring meth-ods is the ability to simultaneously measure horizontal and verti-cal displacements within accuracies of a few millimeters.
GPS is utilized in one of two modes: continuous and survey. Continuous GPS uses a permanently installed GPS receiver and antenna (Fig. 10A) at one location to track the motion of that sta-tion over time. The advantage of continuous GPS is that changes in the magnitude and direction of displacement are well resolved. However, the station cannot be moved; thus, any variations in spatial deformation patterns cannot be identifi ed. In survey mode, a GPS antenna on a tripod (Fig. 10B) is set over a benchmark for Figure 9. Borehole tiltmeter installation in Hawai‘i Volcanoes
Na-tional Park. The instrument is being lowered by its cable into a cased hole. The solar panels, telemetry mast, and electronics box have been installed at the right.
a short time period (e.g., two days) while the station’s position is continuously recorded. The GPS installation is then moved to other sites as needed. Repeat occupation of the same benchmarks provides information about how the surveyed points in a region have moved, but time resolution will be poor.
Both methods of GPS monitoring require a clear view of the sky. Obstructions such as buildings and vegetation obscure the satellite signals and result in poor measurement quality. In addi-tion, short-term GPS measurements tend to be contaminated by multipath (satellite signals that do not travel direct lines between the satellite and the receiving antenna). It is important to collect as much data as possible to average out such effects. Survey sites should record data for at least six to eight hours per day. This
is not an issue for continuous installations, which record data 24 hours a day.
GPS positions are calculated using processing software that is generally provided free of charge by research institutions such as the National Aeronautics and Space Administration (NASA) and the Massachusetts Institute of Technology. The software is highly specialized and requires substantial experience and train-ing to use correctly. A GPS receiver and antenna cost about $4,000. Continuous GPS sites require batteries, solar panels, and radio telemetry, at a cost of about $3,000 per site. For equipment that is operated in survey mode, only tripods and batteries are necessary (about $500), in addition to the receiver and antenna.
GPS is the ultimate tool for measuring three-dimensional displacements; therefore, it is no surprise that GPS is presently the dominant method for deformation monitoring at volcanoes. In Hawai‘i Volcanoes National Park, over 50 continuous GPS stations are supplemented by over 100 sites that are occupied for a few days each during annual or event-driven GPS campaigns. This combination of methods provides the best possible tem-poral and spatial resolution of deformation patterns associated with active volcanism. GPS surveys of ~40 sites, in the vicin-ity of Mauna Loa supplemented by three continuous stations, fi rst detected infl ation of Mauna Loa volcano, Hawai‘i, in 2002. In response to this activity, the continuous GPS network was expanded by ~20 more sites in the following three years. The new continuous stations provide better resolution of surface dis-placements over time, which will result in more reliable forecasts of future activity of Mauna Loa.
Level 3, Method 6: Aerial Photography/Light Detection and Ranging (LIDAR)
Light detection and ranging (LIDAR) surveys and aerial photography are used at restless volcanoes to quantify areas expe-riencing large surface deformation. Both techniques are also used at erupting volcanoes to quantify the volume of extruded mate-rial such as lava fl ows, volcanic domes, etc. LIDAR surveys and aerial photography are used to construct digital elevation models (DEMs) of the ground surface. Volcanologists use DEMs from successive surveys to calculate volume change between surveys. For example, during the 2004–2008 eruption of Mount St. Hel-ens, a time series of DEMs provided the only reliable measure of lava volume as well as its extrusion rate. Tracking volume and extrusion rate helps volcanologists forecast how long an eruption might last and the total volume of lava that might be produced.
Aerial photography is the most basic and cheapest method used to construct DEMs; this is a mature technology in use for decades. A pair of slightly overlapping vertical photos is taken from an aircraft. A stereoscope or specialized computer software is then used to create a topographic map of the ground surface, from which a DEM is generated. During the run-up to the 18 May 1980 eruption of Mount St. Helens, DEMs corroborated the rap-idly increasing rate of infl ation on the volcano’s north fl ank, leading to the recognition that the north side of the volcano was unstable before the collapse occurred on 18 May 1980.
Figure 10. Methods of Global Positioning System (GPS) monitoring. (A) This continuous GPS installation in Hawai‘i Volcanoes National Park consists of an antenna (white disk on the pedestal at the left), solar panels, electronics box (beneath the solar panels), and telemetry mast. (B) A survey GPS site, with a GPS antenna and tripod set up over a benchmark. The box at the lower right contains the GPS receiver and battery.
LIDAR is similar to radar, but uses much higher frequen-cies of light (usually ultraviolet, visible, or infrared) to survey the elevation of the ground surface. Light, emitted by a laser mounted on an airplane, is refl ected from the ground surface, and the travel time is measured by an optical telescope mounted in the same air-plane. The light’s travel time is converted to distance (analogous to EDM), from which a DEM accurate to within a few centimeters is constructed. LIDAR surveys require precise location of the air-craft, so a reference GPS station on the ground must be available within the survey area. Highly specialized software and extensive operator training are required to process LIDAR results, therefore most LIDAR surveys are completed by private companies.
Generally, the lower cost of aerial photography makes it the method of choice for monitoring volcanoes. A fl ight to collect aerial photography may cost $1,000 to $5,000, whereas LIDAR fl ights cost tens of thousands of dollars. LIDAR data also requires several weeks to process, whereas, depending on the desired level of accuracy, aerial photography can be converted into a DEM within days. However, the greater accuracy of LIDAR makes it ideal for locating subtle low-relief features on the ground’s sur-face, such as faults with minor surface offset. In the fi rst weeks following the onset of renewed eruptive activity at Mount St. Hel-ens in late 2004, both LIDAR and aerial photography were used to construct DEMs, which provided important data on the growth of the lava dome in the volcano’s crater. However, the great cost of LIDAR caused DEM studies to be done entirely by aerial pho-tography within two months of the start of the eruption.
Level 3, Method 7: InSAR
The use of interferometric synthetic aperture radar (InSAR) is described in detail in the Emerging Volcano Monitoring Tech-niques section below. Although InSAR is rapidly evolving, limit-ing factors include satellite availability, distortions from atmo-spheric effects, and the need for relatively long intervals between measurements so that deformation is evident above detection lim-its. However, InSAR is effective for measuring large-scale, long-term deformation over large areas where other methods would be prohibitively expensive, and it is a good technique for prospect-ing for deformation where it has not previously been identifi ed, and as a long-term precursor for potential volcanic activity, as illustrated at South Sister volcano (see Emerging Volcano Moni-toring Techniques section). With a few exceptions, InSAR is not yet an operational tool for most volcanoes that are showing sig-nifi cant unrest, threatening to erupt, or actually erupting because repeat InSAR images of a given volcano can only be captured at roughly monthly intervals when the satellite is overhead, prevent-ing monitorprevent-ing of short-term changes.
Remote sensing via satellite, described in the emerging tech-niques section of this chapter, can also be used to monitor surface deformation. Unmanned aerial vehicles (UAVs), also described in the emerging techniques section, are appropriate in areas that are diffi cult or dangerous to access to monitor changes in active lava domes, lava fl ows, and vents, such as the growth and collapse of a new lava dome.
Summary
Combinations of monitoring methods allow comprehen-sive monitoring of spatial and temporal evolution of a volcano’s deformation; only a combination of methods can compensate for the weaknesses of any single method. Clearly, various methods and instruments used to monitor deformation at active volcanoes have advantages and disadvantages. For this reason, effective monitoring strategies employ a mix of continuous and survey methods. For example, in Hawai‘i Volcanoes National Park, the U.S. Geological Survey’s Hawaiian Volcano Observatory uses 20 borehole tiltmeters, more than 50 continuous GPS receivers, more than 100 survey GPS sites, and InSAR data from several differ-ent satellites to monitor deformation at Kīlauea and Mauna Loa volcanoes. The same combination of methods is used at Mount St. Helens, where aerial photography is also employed to create DEMs and track the volume and rate of erupted lava over time.
Vital Sign 3. Gas Emission at Ground Level
Introduction
Volcanic gas is naturally released from both active and many inactive volcanoes. Water vapor is typically the most abundant volcanic gas, followed by carbon dioxide (CO2) and sulfur diox-ide (SO2). Other common volcanic gases are hydrogen sulfi de (H2S), hydrogen chloride (HCl), hydrogen fl uoride (HF), carbon monoxide (CO), and hydrogen (H2), along with many other trace gases and isotopes as well as volatile metals. Concentrations of these gases can vary considerably from one volcano to the next. The majority of potentially active volcanic areas are character-ized by one or more low-temperature fumaroles and a fairly well developed hydrothermal system. Large volcanic systems, such as Yellowstone, have numerous vents and fumaroles discharg-ing volcanic gases to the air over a wide geographic area. Some active volcanic systems, such as Kīlauea in Hawai‘i, have a vari-ety of gas vents and fumaroles that can range in temperature up to several hundred degrees.
Volcanic gases can be harmful to humans, animals, plants, and property. Usually, the hazards, which can range from minor to life threatening, are restricted to the areas immediately sur-rounding volcanic vents and fumaroles. However, heavier-than-air gases such as CO2 can collect in topographic depressions on the fl anks of volcanoes and pose a hazard to human health and safety. Acid gases, such as SO2, when present in abundance, can combine with water in the atmosphere to produce localized acid rain downwind from volcanic vents.
Molten rock, or magma, beneath volcanoes contains abundant gases that are the driving force of eruptions. Volcanoes become restless when magma begins to move from depth toward the Earth’s surface. As magma moves into shallower areas under the volcano, it encounters lower pressure conditions that allow more gases to escape into fractures and cracks. Some of these gases are eventually discharged at the surface through hot fumaroles, active vents, or porous ground surfaces where they, if measured, can provide valuable information about the ongoing processes