I. Introduction.
Materials are continually being exchanged between living organisms and their environments. At the cellular level this depends on several physiological properties collectively referred to as the permeability of the cell or plasma membrane. Membrane permeability is based on properties of surface membranes and driving forces. Cell membranes are differentially permeable to various materials and show alterations in permeability under (Fig. 1) different physiological and environmental conditions. Driving forces are those physical forces that depend on the concentration of a substance across a cell membrane and on the electrical potential of the cell. These experiments consider cell permeability in relation to diffusion gradients and the structure of the cell membrane as revealed by the penetration of solutes with various characteristics.
Ions
Phospholipid Bilayers
Integral Protein
Figure 1. Ion channel located in a cell’s membrane.
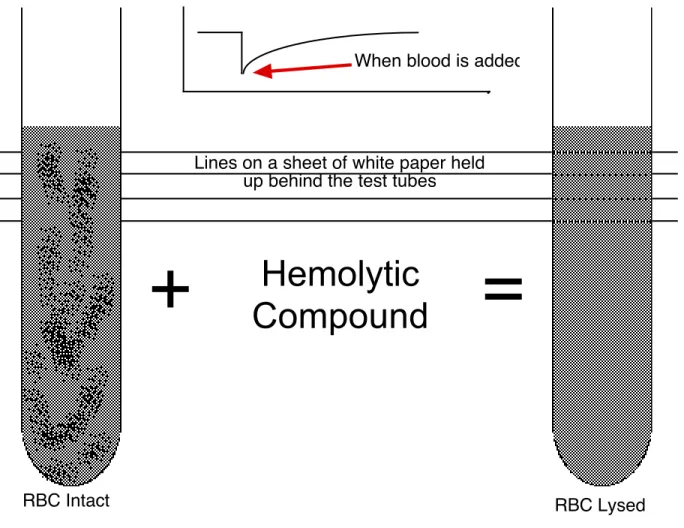
Hemolysis (Fig. 7), indicated by the sudden appearance of a clear red solution in place of the previously murky suspension of red blood cells (Fig. 2), results from the swelling and bursting of the red blood cells because of the penetration of solute and water through the membrane. RBCs can increase in volume as much as 30-40% before bursting. Thus, the plasma membrane of red cells is freely permeable to water, relatively impermeable to salts, and varies in permeability with respect to organic substances.
Red blood cells placed in an iotonic (Fig. 3B) saline solution retain their normal size. If placed in a hypotonic (Fig. 3A) salt solution, the influx of water is greater than the efflux, thus, the red cell increases in volume. The plasma membrane is relatively inelastic and ruptures (hemolysis) following only a very slight volume increase, leaving the cell membrane (ghost) behind. If a RBC is placed in a hypertonic (Fig. 3C) medium the efflux of water is greater than the influx, causing a shrinking of the cell that results in a crenated RBC (Fig. 4).
B. Isotonic
A. Hypotonic C. Hypertonic
Figure 3. RBCs in various osmotic conditions. A. Hypotonic. B. Isotonic. C. Hypertonic. The size of the arrows indicates the relative efflux (on the right) and influx (on the left) of water into/out of the cell.
Solutes that are permeable or nearly as permeable as water (for example urea) do not contribute to osmotic pressure. Thus a cell will swell in a urea solution much as it will in distilled water. Subsequently the plasma membrane may rupture due to excessive internal pressure.
Figure 4. Scanning micrograph of both normal and crenate RBCs.
I. The effect of electrolyte and non-electrolyte concentration on
membrane permeability.
The molar concentrations of non-electrolytes that prevent hemolysis are approximately equal. Osmotic pressure depends on the number of particles in solution. Since electrolytes dissociate in aqueous solution, hemolysis will occur at lower molar concentrations for electrolytes than for non-electrolytes. For example, NaCl1 isotonic molar concentration
should be roughly one-half that of Sucrose.
IA. Procedure. (There are 2 methods to perform this procedure. Read both before proceeding.)
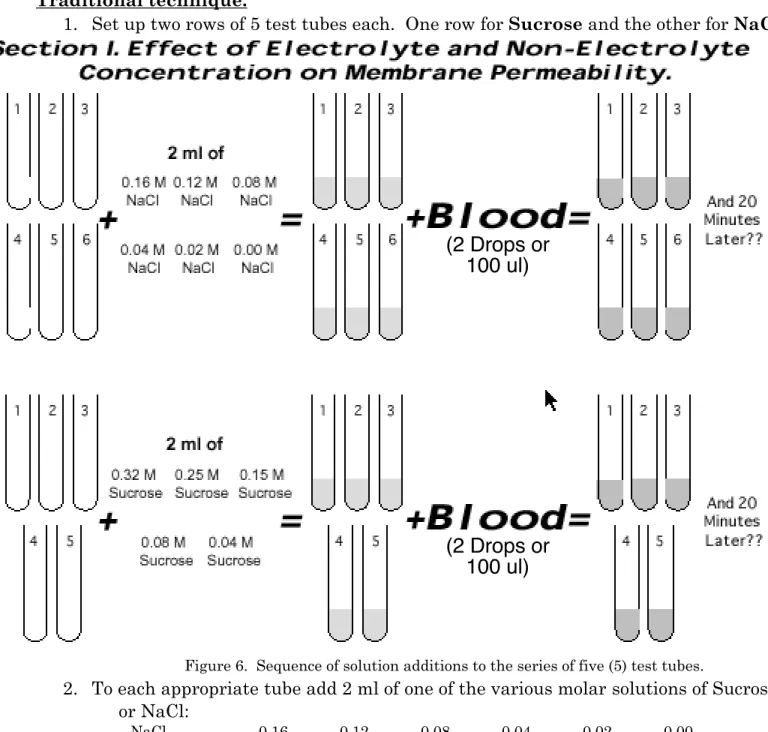
Traditional technique.
1. Set up two rows of 5 test tubes each. One row for Sucrose and the other for NaCl.
(2 Drops or
100 ul)
(2 Drops or
100 ul)
Figure 6. Sequence of solution additions to the series of five (5) test tubes.
2. To each appropriate tube add 2 ml of one of the various molar solutions of Sucrose
3. Add 2 drops (or 100 ul) of red blood cell suspension. 4. Mix immediately, but gently.
5. Set tubes aside for 20 minutes. Remember to set a timer!! 6. Record your data in the spreadsheet for this lab.
Alternative Technique. With spectrophotometer attached to the data acquisition system on the Macintosh. Ask the TAs how to operate and Calibrate.
1. Set the spec. to 700 nm (Why ?) 2. Start the acquisition.
3. Type in “Added 1 drop of blood to 0.08 M NaCl” now but DO NOT hit <Return>. 4. Just when you partner adds the blood to the cuvette hit <Return>.
5. Monitor the absorbance over time.
6. Repeat for all six (6) solutions of Sucrose and NaCl.
Does the hemolysis occur slowly and steadily or does it occur quickly? Is there a latency or does the hemolysis seem to start immediately?
Determine which solutions produced hemolysis (Fig. 7) by holding each tube against this printed page. If the printing clear, hemolysis has occurred.
+
RBC Lysed Lines on a sheet of white paper held
up behind the test tubes
When blood is added
Hemolytic
Compound
=
RBC Intact
Figure 7. Example of non-lysed and lysed blood.
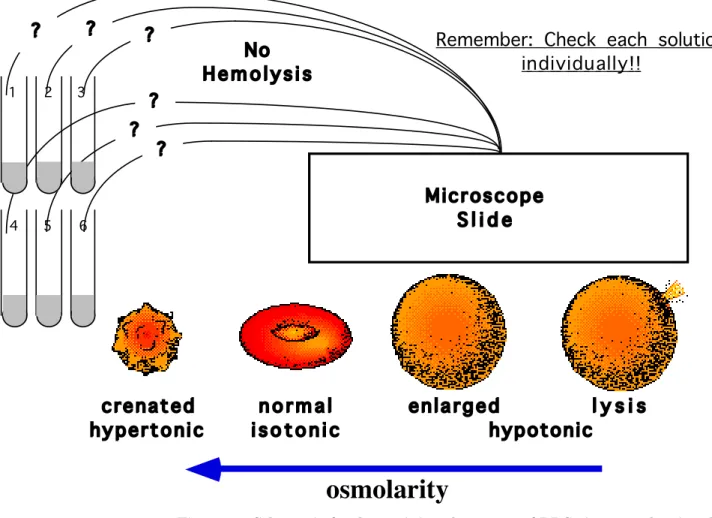
7. From the tubes in which hemolysis did not occur, remove a drop with a disposable pipette and place on a hemocytometer slide and a cover slip. Using the microscope compare the size and shape of the cells in the several solutions and in whole blood (Figs. 2 - 4). It may be necessary to first concentrate the cells by centrifuging the tubes.
? ? ? ? ? ? No H e m o l y s i s
Remember: Check each solution i n d i v i d u a l l y ! ! M i c r os c o pe S l i d e 1 2 3 4 5 6 c re na t e d n o r m a l e n l a r g ed l y s i s hy pe r t o ni c i s o t o n i c hy potoni c
osmolarity
Figure 8. Schematic for determining the status of RBCs in test tubes in which NO hemolysis occurred.
8. For both NaCl and Sucrose take a sample of:
a. Lowest concentrations adequate to produce hemolysis b. 0.16 M NaCl.
c. 0.32 M Sucrose.
Determine the concentrations of [Na+] and the osmolarity of these solutions.
IB. Analysis.
Two familiar formulae are associated with the concepts of osmotic pressure and depression of freezing point of a solution by addition of solute:
! = cRT where:
! = Osmotic Pressure (atm. or osmolarity) c = Concentration (moles/liter) R = 0.0821 atm./°K mole, Gas Constant
T = temperature (°K)
And
∆Tf (°C) = -1.86 °C * c
where
∆Tf - Freezing point depression.
c - concentration in moles/liter H20.
The equations only apply, however, to an ideal, non-dissociating, non-associating molecule. Because of this, several factors need to be taken into account. First, most non-electrolytes do not behave "ideally", in that their osmotic or colligative effect is either greater or less than would be predicted from their concentration. For example, the freezing point of an aqueous solution of 0.1 M sucrose is -0.188 °C rather than -0.186 °C as expected, and at 1 M it is 2.06 °C, rather than -1.86 °C. Hence, an "Activity Coefficient" (i) is needed which is defined as the observed colligative effect divided by the theoretical colligative effect.
Activity Coefficient =
Observed colligative property
Theoretical colligative property
or
Activity Coefficient=
Observed osmolarity
Theoretical
osmolarity
In the above example at 0.1 M, the osmotic coefficient is O.188/0.186 = 1.010.
A second consideration, which is fairly obvious, but nevertheless one which students and others often contrive to forget, is that the osmotic effect of electrolytes depends upon the number of ions yielded by dissociation in solution. Thus a 0.1 M solution of NaCl should behave approximately as a 0.2 M sucrose solution, and a 0.1 M Na2S04 should behave as a 0.3 M sucrose solution. Hence, an appropriate multiplier should be introduced in the above equation when dealing with dissociating electrolytes.
A third consideration which follows directly from the second is that many electrolytes do not dissociate completely. Even though strong electrolytes like NaCl, KBr, and Na2S04
have an osmotic effect slightly less than predicted, as if they were not totally dissociated (even though they are). Some authorities treat the correction for this separately, but here there seems to be no practical reason for not including it as part of the previously defined Activity Coefficient. A 0.1 M NaCl solution would be expected to have a freezing point of -0.372°C and in fact has ∆Tf of -0.347, thus an i of 0.95. At
0.01 M and 1 M the i for NaCl is 0.968 and 0.905 respectively.
Because of such anomalies, D. A. T. Dick (Water and Living Cells) has proposed that the term "osmole" be defined as that concentration of any specific solute which has the effect of one mole of an ideal non-electrolyte in aqueous solution (i.e. the concentration which, for example, causes a ∆Tf of -1.86 °C). Thus, solutions of two different solutes, each of
which was 1 osM would very likely have different molar concentrations. This term, and Dick's definition of it, are widely used.
IC. Discussion.
1. At what concentrations of NaCl and Sucrose was hemolysis produced?
2. At what concentrations would the cells be isotonic (i.e. undergo no volume change)?
3. In what way does the shape of the cell bring about a difference in the answers between Questions (l) and (2)?
4. What would be the osmotic pressure exerted at room temperature by the solute in previously unmolested red blood cells, if the cells were placed in pure water, if its volume did not change, and if the membrane allowed no diffusion out?
Use ! = cRT
where:
! = osmotic pressure (atm.) c = concentration (moles/liter) R = 0.0821 atm./°mole T = temperature (°K)
&
Osmotic pressure = cRT Wherec=0.29M (an RBC has an osmolarity of 290 mosM) T=298°K (25° C)
R=0.0821 atm/°Kmole Thus:
OP=.29*0.0821*298 OP=7.09atm
Recall that one mole of an ideal non-electrolyte in 1 liter H20 exerts 22.4 atm. at STP.
5. Which of the conditions stated or implied in Question 4 (i.e. constraint on volume, permeability, etc.) would not be met in the real situation?
II.The effects of molecular size upon permeability.
Generally, molecular weight of a substance gives some idea of the approximate diameter of its molecules -- the larger the molecule the greater the molecular weight. Steric configuration and symmetry, or its lack, also influence the effective diameter of a molecule. Very large molecules (e.g. proteins) have great difficulty entering a cell, while small molecules (e.g. amino acids) may enter cells more freely.
** Note - other factors, such as partition coefficients, along with size must ** be considered in evaluating the rate at which a given substance enters a cell.
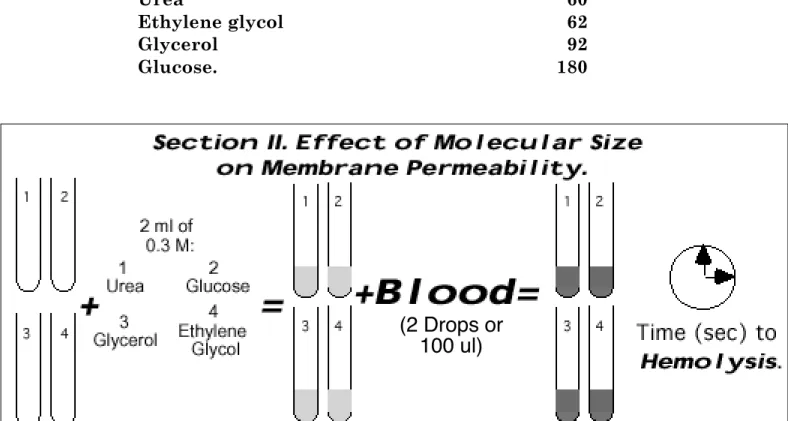
IIA. Procedure.
1. Add 2 drops (or 100 ul) of red blood cell suspension to each of four test tubes containing respectively 2 ml of 0.3 M solutions of:
Compound Molecular Weight
Urea 60 Ethylene glycol 62 Glycerol 92 Glucose. 180
(2 Drops or
100 ul)
Figure 9. Sequence of solution additions to the series of four (4) test tubes.
2. Mix each tube gently and hold it against a printed page.
3. Determine the time (seconds) required for hemolysis to occur for each tube.
IIB. Results and Discussion.
1. What correlation2 exists between hemolysis time and molecular weights of the substances
tested? Is there a correlation between the observed (time to hemolysis) and the known (molecular weight)? If so what is the correlation coefficient (R2)3?
Time to Hemolysis.
Molecular weight.
Figure. 10. Plot of the time (in seconds) that it took solutions of various molecular weight to cause hemolysis.
2. Since all the solutions used in this part of the experiment are hyperosmotic with respect to the intracellular fluid, why did hemolysis occur? What is the difference between isotonic and isosmotic? Is it possible for a solution to be isosmotic, but not isotonic? How and Why?
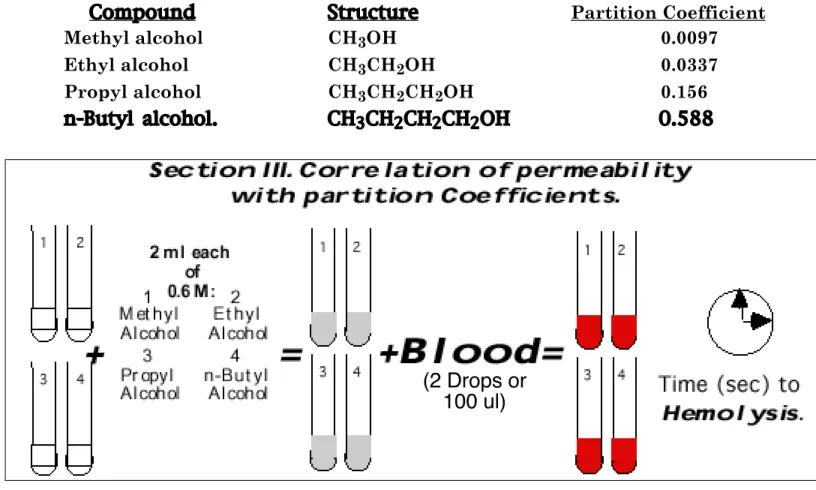
III. Correlation of permeability with partition coefficients.
Nonpolar compounds are compounds in which electrons are equally shared by the two atoms forming a bond. They have a high solubility in fats or fat solvents, but a low solubility in water. The solubility ratio of a compound in oil or fat to its solubility in water is called the Partition Coefficient.
Partition Coefficient = Solubility in oil/lipids Solubility in water
The ability of substances to penetrate cells has been related to their solubility in lipid substances. Increasing lipid solubility generally parallels increasing the length of carbon chain and higher molecular weight.
*** Note - All three factors affectpenetration rates of compounds into cells ***.
IIIA. Procedure.
1. Add 2 drops (or 100 ul) of red blood cell suspension to each of 4 test tubes containing respectively 2 ml of 0.6 M solutions of:
Compound Structure Partition Coefficient
Methyl alcohol CH3OH 0.0097 Ethyl alcohol CH3CH2OH 0.0337 Propyl alcohol CH3CH2CH2OH 0.156 n-Butyl alcohol. CH3CH2CH2CH2OH 0.588
(2 Drops or
100 ul)
Figure 11. Sequence of solution additions to the series of four (4) test tubes.
2. Mix each of the tubes and hold them against a printed page.
3. Determine the time required for hemolysis to occur for each tube. If the hemolysis is too fast to allow an accurate estimate of time, try chilling the cells in ice4 water.
4 Be sure to record in the data the temperature of the "ice water" and the Temp of your solutione when the experiment was run
IIIB. Results and Discussion.
1. Plot hemolysis time against partition coefficient and comparative length of carbon chain.
Partition
Coefficient
Carbon Length
Time to
Hemolysis
Time to
Hemolysis
Figure. 12. Plot the time (in seconds) that it took solutions of various carbon length or partition coefficients to cause hemolysis.
2. What can be concluded about the effect of carbon chain length on red blood cell membrane permeability?
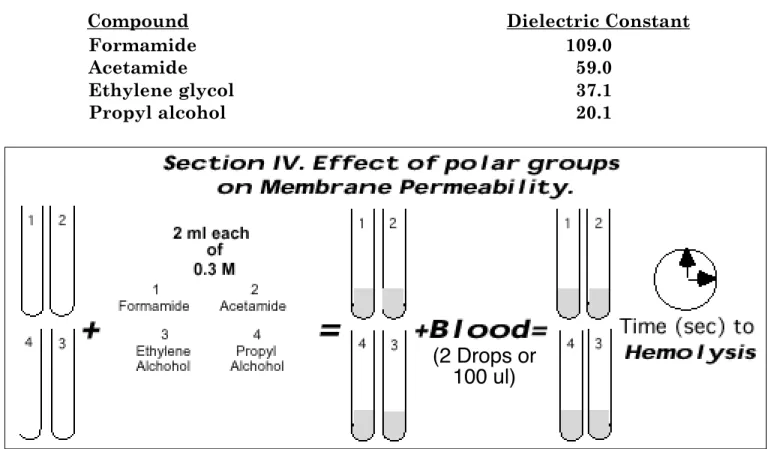
IV. The effect of polar groups on membrane permeability.
In non-ionic polar compounds the electrons of a bond between two atoms are attached more to one atom than to the other. As a consequence, the molecule acts as if it had a negative end and a positive end. Because of this polarity, it orients itself in an electric field. In general, uncharged or non polar substances enter a cell more readily than charged or polar substances.
IVA. Procedure.
1. Add 2 drops (or 100 ul) of red blood cell suspension to each of 4 test tubes containing respectively 2 ml of 0.3 M solutions of:
Compound Dielectric Constant
Formamide 109.0 Acetamide 59.0 Ethylene glycol 37.1 Propyl alcohol 20.1
(2 Drops or
100 ul)
Figure 13. Sequence of solution additions to the series of four (4) test tubes.
2. Mix each of the tubes and hold them against a printed page. 3. Determine the time required for hemolysis to occur for each tube.
IVB. Results and Discussion.
1. Plot hemolysis time against molecular weight and dielectric constants.
Time to
Hemolysis
Time to
Hemolysis
Dielectric
Constants
Molecular Weight
Figure. 14. Plot the time (in seconds) that it took solutions of various dielectric constants or molecular weight to cause hemolysis.
2. What do these data suggest about the electrical condition of the membrane?
3. From the above experiment (Sections I through IV) what can be concluded about the chemical nature of the cell membrane? Discuss your answer in terms of evidence collected from these experiments.
1 2 3 4 5 6 7 8 9 10 11 12 13 14 15 16 17 18 19 20 21 22 23 24 25 26 27 28 29 30 31 32 33 34 35 36 37 38 39 40 41 42 43 44 45 A B C D E F G
Red Blood Cell Permeability
MCB 403 - Fall Names:
Section : Date:
Group Alpha
Procedure I. Electrolytes/Nonelectrolytes.
Osmolarity (mOsm) [Na] (mM)
Compound Lysis(Y/N) Stock Solution Stock Solution Notes 0.16 M NaCl 0.12 M NaCl 0.08 M NaCl 0.04 M NaCl 0.02 M NaCl 0.00 M NaCl 0.32 M Sucrose 0.25 M Sucrose 0.15 M Sucrose 0.08 M Sucrose 0.04 M Sucrose [Na] Osmolarity Lowest [NaCl] to cause hemolysis
0.16 M NaCl Lowest [Sucrose] to cause hemolysis 0.32 M Sucrose
Procedure II. Molecular Size.
Compound Molec. Wt. Lysis (sec) Notes
0.3 M Urea 0.3 M Ethylene Glycol 0.3 M Glycerol 0.3 M Glucose
Procedure III. Partition Coefficients.
Compound Molec. Wt. Part Coef. Carbon Chain Lgth Lysis (sec) Notes 0.6 M Methyl Alcohol
0.6 M Ethyl Alcohol 0.6 M Propyl Alcohol 0.6 M n-Butyl Alcohol
Procedure IV. Polar groups.
Compound Molec. Wt. Dielectric Coef Lysis (sec) Notes 0.3 M Formamide
0.3 M Acetamide 0.3 M Ethylene Glycol 0.3 M Propyl Alcohol
1 2 3 4 5 6 7 8 9 10 11 12 13 14 15 16 17 18 19 20 21 22 23 24 25 26 27 28 29 30 31 32 33 34 35 36 37 38 39 40 41 42 43 H I J K L M N
Red Blood Cell Permeability
MCB 403- Fall Names:
Section : Date:
Group Beta
Procedure I. Electrolytes/Nonelectrolytes.
Osmolarity (mOsm) [Na] (mM)
Compound Lysis(Y/N) Stock Solution Stock Solution Notes 0.16 M NaCl 0.12 M NaCl 0.08 M NaCl 0.04 M NaCl 0.02 M NaCl 0.00 M NaCl 0.32 M Sucrose 0.25 M Sucrose 0.15 M Sucrose 0.08 M Sucrose 0.04 M Sucrose [Na] Osmolarity Lowest [NaCl] to cause hemolysis
0.16 M NaCl Lowest [Sucrose] to cause hemolysis 0.32 M Sucrose
Procedure II. Molecular Size.
Compound Molec. Wt. Lysis (sec) Notes
0.3 M Urea 0.3 M Ethylene Glycol 0.3 M Glycerol 0.3 M Glucose
Procedure III. Partition Coefficients.
Compound Molec. Wt. Part Coef. Carbon Chain Lgth Lysis (sec) Notes 0.6 M Methyl Alcohol
0.6 M Ethyl Alcohol 0.6 M Propyl Alcohol 0.6 M n-Butyl Alcohol
Procedure IV. Polar groups.
Compound Molec. Wt. Dielectric Coef Lysis (sec) Notes 0.3 M Formamide
1 2 3 4 5 6 7 8 9 10 11 12 13 14 15 16 17 18 19 20 21 22 23 24 25 26 27 28 29 30 31 32 33 34 35 36 37 38 39 40 41 42 43 44 45 O P Q R S T U
Red Blood Cell Permeability
MCB 403- Fall Names:
Section : Date:
Group Gamma
Procedure I. Electrolytes/Nonelectrolytes.
Osmolarity (mOsm) [Na] (mM)
Compound Lysis(Y/N) Stock Solution Stock Solution Notes 0.16 M NaCl 0.12 M NaCl 0.08 M NaCl 0.04 M NaCl 0.02 M NaCl 0.00 M NaCl 0.32 M Sucrose 0.25 M Sucrose 0.15 M Sucrose 0.08 M Sucrose 0.04 M Sucrose [Na] Osmolarity Lowest [NaCl] to cause hemolysis
0.16 M NaCl Lowest [Sucrose] to cause hemolysis 0.32 M Sucrose
Procedure II. Molecular Size.
Compound Molec. Wt. Lysis (sec) Notes
0.3 M Urea 0.3 M Ethylene Glycol 0.3 M Glycerol 0.3 M Glucose
Procedure III. Partition Coefficients.
Compound Molec. Wt. Part Coef. Carbon Chain Lgth Lysis (sec) Notes 0.6 M Methyl Alcohol
0.6 M Ethyl Alcohol 0.6 M Propyl Alcohol 0.6 M n-Butyl Alcohol
Procedure IV. Polar groups.
Compound Molec. Wt. Dielectric Coef Lysis (sec) Notes 0.3 M Formamide
0.3 M Acetamide 0.3 M Ethylene Glycol 0.3 M Propyl Alcohol
1 2 3 4 5 6 7 8 9 10 11 12 13 14 15 16 17 18 19 20 21 22 23 24 25 26 27 28 29 30 31 32 33 34 35 36 37 38 39 40 41 42 43 V W X Y Z AA AB
Red Blood Cell Permeability
MCB 403- Fall Names:
Section : Date:
Group Delta
Procedure I. Electrolytes/Nonelectrolytes.
Osmolarity (mOsm) [Na] (mM)
Compound Lysis(Y/N) Stock Solution Stock Solution Notes 0.16 M NaCl 0.12 M NaCl 0.08 M NaCl 0.04 M NaCl 0.02 M NaCl 0.00 M NaCl 0.32 M Sucrose 0.25 M Sucrose 0.15 M Sucrose 0.08 M Sucrose 0.04 M Sucrose [Na] Osmolarity Lowest [NaCl] to cause hemolysis
0.16 M NaCl Lowest [Sucrose] to cause hemolysis 0.32 M Sucrose
Procedure II. Molecular Size.
Compound Molec. Wt. Lysis (sec) Notes
0.3 M Urea 0.3 M Ethylene Glycol 0.3 M Glycerol 0.3 M Glucose
Procedure III. Partition Coefficients.
Compound Molec. Wt. Part Coef. Carbon Chain Lgth Lysis (sec) Notes 0.6 M Methyl Alcohol
0.6 M Ethyl Alcohol 0.6 M Propyl Alcohol 0.6 M n-Butyl Alcohol
Procedure IV. Polar groups.
Compound Molec. Wt. Dielectric Coef Lysis (sec) Notes 0.3 M Formamide
1 2 3 4 5 6 7 8 9 10 11 12 13 14 15 16 17 18 19 20 21 22 23 24 25 26 27 28 29 30 31 32 33 34 35 36 37 38 39 40 41 42 43 44 45 AC AD AE AF AG AH AI AJ
Red Blood Cell Permeability
MCB 403- Fall Names:
Section : Date:
Alternative procedure I. Electrolytes/Nonelectrolytes.
Absorbance
Time 0.16 M 0.12 M 0.08 M 0.04 M 0.02 M 0.00 M
(min) NaCl NaCl NaCl NaCl NaCl NaCl
1 2 3 4 5 6 7 8 9 10 11 12 13 14 15 Absorbance Time 0.32 M 025 M .015 M 0.08 M 0.04 M (min) Sucrose Sucrose Sucrose Sucrose Sucrose
1 2 3 4 5 6 7 8 9 10 11 12 13 15