Hospitalised injury in children
and young people
2011–12
the aim of this report is to provide information about
serious hospitalised injury in australian children and
young people aged 0 to 24 years. the report takes a
developmental stage approach to examining injury
acknowledging that age and injury are more closely
linked at some periods of life (for example, early
childhood and young adulthood).
h ospitalised injur y in childr en and y oung people 2011–12
AIHW
INJURY RESEARCH AND STATISTICS SERIES Number 91
Australian Institute of Health and Welfare
Hospitalised injury in children and
young people
The Australian Institute of Health and Welfare is a major national agency which provides reliable, regular and relevant information and statistics
on Australia’s health and welfare. The Institute’s mission is
authoritative information and statistics to promote better health and wellbeing.
© Australian Institute of Health and Welfare 2014
This product, excluding the AIHW logo, Commonwealth Coat of Arms and any material owned by a third party or protected by a trademark, has been released under a Creative Commons BY 3.0 (CC-BY 3.0) licence. Excluded material owned by third parties may include, for example, design and layout, images obtained under licence from third parties and signatures. We have made all reasonable efforts to identify and label material owned by third parties.
You may distribute, remix and build upon this work. However, you must attribute the AIHW as the copyright holder of the work in compliance with our attribution policy available at
<www.aihw.gov.au/copyright/>. The full terms and conditions of this licence are available at <http://creativecommons.org/licenses/by/3.0/au/>.
Enquiries relating to copyright should be addressed to the Head of the Digital and Media
Communications Unit, Australian Institute of Health and Welfare, GPO Box 570, Canberra ACT 2601.
This publication is part of the Australian Institute of Health and Welfare’s Injury research and statistics series. A complete list of the Institute’s publications is available from the Institute’s website
<www.aihw.gov.au>. ISSN 1444-3791
ISBN 978-1-74249-657-3
Suggested citation
AIHW: Pointer S 2014. Hospitalised injury in children and young people 2011–12. Injury research and statistics series no. 91. Cat. no. INJCAT 167. Canberra: AIHW.
Australian Institute of Health and Welfare
Board Chair
Dr Mukesh C Haikerwal AO
Director David Kalisch
Any enquiries about or comments on this publication should be directed to: Digital and Media Communications Unit
Australian Institute of Health and Welfare GPO Box 570
Canberra ACT 2601 Tel: (02) 6244 1000 Email: info@aihw.gov.au
Published by the Australian Institute of Health and Welfare This publication is printed in accordance with ISO 14001 (Environmental Management Systems) and ISO 9001 (Quality Management Systems). The paper is sourced from sustainably managed certified forests.
Contents
Acknowledgments... iv Abbreviations ... v Symbols ... v Summary ... vi 1 Introduction ... 1 2 Overview ... 73 Less than 12 months (Infancy) ... 21
4 1–4 years (Early childhood) ... 28
5 5–9 years (Middle childhood) ... 37
6 10–14 years (Late childhood) ... 46
7 15–17 years (Adolescence) ... 55
8 18–24 years (Young adulthood) ... 67
Appendix A: Data issues ... 79
Appendix B: Additional tables ... 84
Glossary ... 85
References ... 87
List of tables ... 90
Acknowledgments
The Australian Institute of Health and Welfare (AIHW) acknowledges the financial and project support for this publication provided by the Australian Government Department of Health. This report was written by Sophie Pointer at the AIHW National Injury Surveillance Unit at Flinders University, with assistance from James Harrison, Amanda Tovell, and Stacey Avefua.
Members of the AIHW National Injury Surveillance Unit Advisory Committee provided valuable comments.
Abbreviations
ABS Australian Bureau of Statistics
ACHI Australian Classification of Health Interventions
ACT Australian Capital Territory
AIHW Australian Institute of Health and Welfare
ARIA Accessibility/Remoteness Index of Australia
ASGC Australian Standard Geographical Classification
ERP estimated resident population
HTTL high threat to life
ICD-10-AM International statistical classification of diseases and related health
problems, 10th revision, Australian modification
LOS length of stay
METeOR Metadata Online Registry (AIHW)
MLOS mean length of stay
NCCH National Centre for Classification in Health
NHMD National Hospital Morbidity Database
NISU National Injury Surveillance Unit
NMDS National Minimum Data Set
NSW New South Wales
NT Northern Territory
UNICEF United Nations Children’s Fund
WHO World Health Organization
Symbols
— nil or rounded to zero
n.a. not available
n.p. not publishable because of small numbers, confidentiality or other concerns
Summary
This report provides information on hospitalised injury in Australian children and young people aged 0 to 24 years in 2011–12. Just over 130,000 children and young people were hospitalised as a result of an injury in 2011–12, boys outnumbering girls by 2 to 1. Generally, rates of injury were higher for the older age groups. The overall rate was 1,785 per 100,000, and the highest overall rate was among males aged 18–24 years, at 3,298 cases per 100,000 population. Rates of injury were also higher in rural and remote areas and for Aboriginal and Torres Strait Islander children and young people.
Infants
In infants (<12 months) rates of drowning (10 per 100,000) and injury due to thermal causes (67 per 100,000) were among the highest of all age groups for children and young people. About 75% of infant drowning cases were in bathtubs.
Children aged 1–4 years
Rates of drowning and injury due to thermal causes were relatively high for children aged 1–4 years, and rates of unintentional poisoning by pharmaceuticals and other substances were the highest in this age group (85 and 28 per 100,000 respectively). Falls were commonly from playground equipment (20% of the falls in this age group) and 40% of playground equipment falls were from trampolines. About 60% of the drownings were in swimming pools.
Children aged 5–9 years
Rates of injury due to falls were highest for children aged 5–9 years (701 per 100,000). The falls were commonly from playground equipment (38% of the falls in this age group) and 42% of the falls from playground equipment were from climbing apparatus.
Children aged 10–14 years
For children aged 10–14 years, unintentional transport injury, intentional self-harm and assault were more common than for younger age groups. Falls was one of the leading causes of hospitalisation (8,703 hospitalisations) and 1,329 (15%) involved skateboards.
Adolescents aged 15–17 years
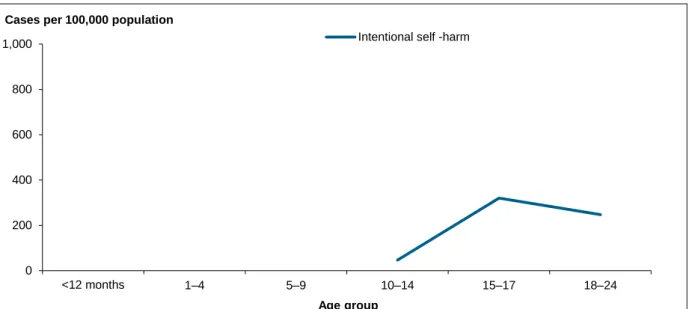
Adolescents aged 15–17 years have the highest rate of intentional self-harm (320 cases per 100,000 population) among children and young people. The rate of intentional self-harm among female adolescents (534) was over four times that of males (119). The most common means for both females (86%) and males (76%) was intentional self-poisoning.
Young adults aged 18–24 years
Young adults (18–24) have the highest rates of unintentional transport injury (442 cases per 100,000 population) and assault (251). Most transport injuries in young women involved cars (63%) and just 8% involved a motor cycle. In contrast, transport injuries in young men more often involved a motorcycle (41%) than a car (33%). The rate of assault for young men (377 per 100,000) was three times that for young women (120). Young women were much more likely to report being assaulted by their spouse or domestic partner (44%) than young men (2%).
1
Introduction
The aim of this report is to provide information about hospitalised injury in Australian children and young people aged 0 to 24 years. The report takes a developmental stage approach to examining injury, acknowledging that age and injury are closely linked at some periods of life—for example, early childhood and young adulthood (AIHW 2012a).
Age groups and developmental stage
Progression from birth to adulthood is a complex process of growth and development. Physical aspects of this are most obvious, but developments in mental capabilities, emotions, relationships with other people, and social roles and expectations, are also important. While individual children vary in the age at which they achieve certain capabilities, there is enough commonality for growth charts and tables of developmental ‘milestones’, organised by age, to be widely used as guides to progression, the basis for screening for developmental delay (Centers for Disease Control and Prevention 2014) and for requirements concerning things such as school entry and driver licensing to be framed in terms of age. Age is an easily measured proxy for growth and development.
Patterns and rates of injury in childhood vary greatly with age in ways that have often been considered to reflect development (see, for example, Flavin et al. 2006 and MacInnes & Stone 2008).
Growth and development are continuous processes. It is useful to divide ages into ranges for purposes such as screening and statistical description, but it should be recognised that the choice of age groups is rather arbitrary and no single set of age groups predominates in the literature on child development. Certain terms are common, such as infant, toddler, child and adolescent, and some subdivisions are also common, such as early, middle and late childhood. However, there is variation concerning exactly which ages are attached to such terms. An exception is ‘infant’, which commonly refers to the first year of life, or from 1 month to 1 year after birth.
The age groups used in this report are based on relevant bands given in the National Injury Prevention and Safety Promotion Plan: Children (0–4 and 5–14 years) and Youth and young adults (15–24 years) (NPHP 2005), with additional subdivisions made as follows:
• less than 12 months (Infancy)
• 1–4 years (Early childhood)
• 5–9 years (Middle childhood)
• 10–14 years (Late childhood)
• 15–17 years (Adolescence)
• 18–24 years (Young adulthood).
The first year of life was distinguished because development and injury patterns differ greatly between infants and older children (Siskind & Scott 2013). As indicated above, children older than 1 year were divided into three age groups: 1–4 years (early childhood); 5–9 years (middle childhood); and 10–14 years (late childhood).
For most children, the age range 1–4 years extends from when they begin to walk (that is, become toddlers) to when they commence pre-school or kindergarten. Mobility comes earlier than understanding of hazards such as bodies of water, traffic and hot objects, reflected in the prominence of scalds and drowning among serious injuries at this stage of life (Agran et al. 2003).
Ages 5–9 include much of the child’s time at primary school. Developing capabilities allow activities such as bicycling and climbing, and injuries associated with these activities are prominent.
Most children experience puberty in the period from 10–14 years, typically earlier for girls than boys. Emotional turmoil is common, sometimes leading to self-injurious behaviour, as is an increase in risk-taking behaviours, particularly among boys (Martin et al. 2010, Spear 2000).
The wide age band 15–24 years was split into two parts: ages 15–17 and 18–24. For most young people, the first of these is the period in which formal schooling is coming to an end, with transition to higher education or job-seeking, and in which driver training and licensing most often occur. Legal adulthood commences at 18 years, bringing rights such as the right to purchase alcohol.
Although relatively narrow age groups have been used in this report, risks and patterns of injury can vary even within these age groups. For example, in a recent study, Siskind and Scott (2013) analysed data from Queensland hospital emergency departments and found that the pattern of injuries varied over the first year of life and was clearly linked to the child’s increasing mobility. While falls were the leading cause of injury for all children less than 1 year, falls as a proportion of all injuries, were highest in children aged between 3 and 5 months—the age at which many infants start to roll.
Methods and data sources
This report uses data from the National Hospital Morbidity Database (NHMD) covering the period 1 July 2011 to 30 June 2012 to provide information on hospitalised injury in children and young people in Australia.
Diagnosis and external cause information for the hospital separations reported here were coded according to the International Statistical Classification of Diseases and Related Health Problems, 10th Revision, Australian Modification (ICD-10-AM) (NCCH 2010). It comprises classifications of diseases and external causes of injuries and poisoning, based on the World Health Organization’s version of ICD-10. The ICD-10-AM classification is hierarchical, with 20 summary disease chapters that are divided into a large number of more specific disease groupings.
What data were reported?
In addition to counts and other basic descriptive statistics this report presents crude
(age-specific) and age-standardised rates. Information about the calculation and use of rates can be found in Appendix A.
Records that met all of the following criteria were included in this report:
• Hospital separations occurring in Australia from 1 July 2011 to 30 June 2012
• Principal diagnosis in the ICD-10-AM range S00–T75 or T79 from Chapter XIX Injury, poisoning and certain other consequences of external causes
• Mode of admission was not a transfer from another acute hospital (see Appendix A for
details).
In tables and charts, unless stated otherwise, separations for which age and sex were not reported were included in totals.
Important terms regarding the data used in this report are summarised in Boxes 1.1 to 1.5 and further information on data and methods is provided in Appendix A. Other information boxes are found in relevant areas in the report.
Box 1.1: Summary of terms relating to hospitalised injury
Statistics on admitted patients are compiled when an admitted patient (a patient who undergoes a hospital’s formal admission process) completes an episode of admitted patient care and ‘separates’ from the hospital. This is because most of the data on the use of
hospitals by admitted patients are based on information provided at the end of the patients’ episodes of care, rather than at the beginning. The length of stay and the procedures carried out are then known and the diagnostic information is more accurate.
Separation is the term used to refer to the episode of admitted patient care, which can be a total hospital stay (from admission to discharge, transfer or death) or a portion of a hospital stay beginning or ending in a change of type of care (for example, from acute care to
rehabilitation). ‘Separation’ also means the process by which an admitted patient completes an episode of care by being discharged, dying, transferring to another hospital or changing type of care.
The principal diagnosis is the diagnosis established after study to be chiefly responsible for occasioning the patient‘s episode of admitted patient care.
An external cause is defined as the environmental event, circumstance or condition that was the cause of injury or poisoning. Whenever a patient has a principal or additional diagnosis of an injury or poisoning, an external cause code should be recorded. The injury separation records included in this report are those that have a principal
diagnosis code in the ICD-10-AM range S00–T75 or T79. Whenever a patient has a principal or additional diagnosis of an injury or poisoning, an external cause code should be
recorded. This includes records where the main reason for the episode in hospital was a recent injury, such as a fracture, laceration or burn to any part of the body, or poisoning. It also includes a small number of episodes mainly due to complications of surgical and medical care or due to sequelae present a year or more after injury, or other late effects. Records are included whether caused unintentionally (‘accidents‘) or intentionally (intentional self-harm, or assault). Records where intent was not determined are also included. Throughout this report, records with a principal diagnosis of S00–T75, T79 were included in the totals of tables unless otherwise indicated, even if they lack an external cause or have a first reported external cause code of complications of surgical and medical care or codes describing the sequelae of external causes. These records meet the principal diagnosis definition of community injury but lack a meaningful external cause.
Injury cases are estimated as the number of injury separations, less those records where the mode of admission was ‘inward transfer’. Inward transfers are omitted to reduce
over-counting.
Box 1.1 (continued): Summary of terms relating to hospitalised injury
The mean length of stay is the average number of days each patient stayed in hospital. This is calculated by dividing the total number of patient days for injury separations by the number of injury cases, estimated as above. Patients who were admitted and discharged from hospital on the same day are counted as staying for one day.
Injuries can be classified according to the likelihood that a patient with that injury will die in hospital. The method used refers to cases with predicted mortality risk of about 6% or higher as having a high threat to life (Stephenson et al. 2003). Injuries of this severity are likely to have a large impact on the patient, often with persisting problems and ongoing need for health care services. This report contains information on the proportion of cases of hospitalised injury that were classified as high threat to life.
Box 1.2: Aboriginal and Torres Strait Islander reporting
In this report, the terms ‘Aboriginal and Torres Strait Islander people’ and ‘Indigenous people’ were used to refer to children and young people identified as such in Australian hospital separations data and population data collections.
Hospitalisations for which the Indigenous status of the patient was not reported have been included with hospitalisations data for non-Indigenous people under the ‘Other
Australians’ category. The latest report on the quality of Indigenous identification in hospital separations data, released in May 2013 (AIHW 2013), found that an estimated 88% of Indigenous patients were correctly identified in Australian public hospital admission records in 2011–12. The report recommends that data for all jurisdictions are used in national analyses of Indigenous admitted patient care from 2010–11 onwards. For additional information see Appendix A.
Box 1.3: Ascertainment of intentional self-harm
According to inclusion notes in ICD-10-AM, cases should be assigned codes in the range X60–X84 if they are purposely self-inflicted poisoning or injury, suicide, or attempted suicide (NCCH 2006). Determining whether an injury was due to intentional self-harm is not always straightforward. Cases may appear to be intentional self-harm, but
inconclusiveness of available information may preclude them being coded as such. In this situation, the case can be coded to an ‘undetermined intent’ category (for example, Y30
Falling, jumping or pushed from a high place, undetermined intent or Y32 Crashing of motor
vehicle, undetermined intent). It is possible that through the coding process, some types of
injury may be more readily attributed to intentional self-harm than others, for example, ‘intentional self-harm by hanging’ as opposed to ‘falling from a building structure’ (for example, W13, out of a window, bridge or roof).
Some patients may choose not to disclose that their injuries resulted from intentional self-harm, or may be unable to do so due to the nature of the injuries, or because their motives were ambiguous.
Box 1.3 (continued): Ascertainment of intentional self-harm
In very young children, ascertaining whether an injury was due to intentional self-harm can be difficult and may involve a parent or caregiver’s perception of the intent. Ability to form an intention to inflict self-harm and to understand the implications of doing so requires a degree of maturation that is absent in infancy and early childhood. It is not possible to differentiate between acts of self-injury and acts of self-harm with suicidal intent within the NHMD, but it is likely that an unknown proportion of cases of intentional self-harm in late childhood and at older ages are self-injurious in nature rather than suicidal in intent. The age at which self-inflicted acts can be interpreted as intentional self-harm is not
well-defined and is the subject of debate. Such sources of uncertainty about the assignment of intent limit the certainty of any estimates of intentional self-harm based on routine hospital data. For these reasons, in this report, cases of intentional self-harm are suppressed in age groups younger than 10 years.
Box 1.4: Understanding ‘drowning’
Increasingly, the term ‘drowning’ is used to refer to ‘the process of experiencing respiratory impairment from submersion/immersion in liquid’ (van Beek et al. 2005). Framed this way, drowning can have various outcomes: death, survival with lasting consequences of greater or lesser severity, survival with transient morbidity or survival with no detectable
consequences. ‘Near-drowning’ is less well defined. It can refer to survived episodes of respiratory impairment from submersion/immersion in liquid. It can also refer to episodes in which a person nearly, but not quite, experiences respiratory impairment from
submersion/immersion in liquid (for example, a person who becomes exhausted while swimming, but manages to reach a shore, perhaps with assistance).
Box 1.5: Perpetrator of assault
Perpetrator codes are used in ICD-10-AM when a code from the ICD-10-AM category
Assault (X85–Y09) is present (see ‘Appendix A: Data issues’). A coding standard (NCCH
2002b) provides guidance to clinical coders in assigning codes identifying the perpetrator of assault, abuse or neglect. The coding rules operate on a hierarchical basis, with coders required to code the closest relationship between the perpetrator and the victim. The 10 subcategories of perpetrator are:
Spouse or domestic partner Official authorities
Parent Person unknown to the victim
Other family member Multiple persons unknown to the victim
Carer Other specified person
Structure of this report
Chapter 2 provides an overview of hospitalised injury among children and young people in Australia. The information provided includes number of hospitalised injury cases, length of stay, hospitalised injury cases classified as high threat to life, nature of injury, external cause of injury, remoteness of the patient’s area of usual residence, and Indigenous status by sex and age group.
Chapters 3 to 8 provide similar information to Chapter 2, but for specific age age groups, as follows:
• Chapter 3: Less than 12 months (Infancy)
• Chapter 4: 1–4 years (Early childhood)
• Chapter 5: 5–9 years (Middle childhood)
• Chapter 6: 10–14 years (Late childhood)
• Chapter 7: 15–17 years (Adolescence)
• Chapter 8: 18–24 years (Young adulthood).
Appendix A: Data issues provides summary information on the NHMD, notes on the presentation of data, the population estimates used to calculate population rates, analysis methods, and information on data quality.
Appendix B: Additional tables consists of tables underpinning selected figures presented in Chapter 2.
2
Overview
There were 488,737 hospital separations due to injury and poisoning for public and private hospitals in Australia during 2011–12 (Table 2.1) representing an estimated 454,031 cases. Of these cases, 29% were aged 0–24 at the time of admission. A higher proportion of boys and young men than girls and young women (2:1) were hospitalised as a result of an injury. The rate of injury in children and young people was less than the rate of injury in all Australians; however the rate of injury in boys and young men was similar to the all-ages rate for males.
Table 2.1: Key indicators for hospitalised injury cases in children and young people, 2011–12
Children and young people All ages
Indicators Males Females Persons Males Females Persons
Separations from hospital due to injury 93,555 47,673 141,230 276,071 212,661 488,737 Estimated injury cases 87,426 44,770 132,198 256,816 197,210 454,031 Age-standardised rate/100,000
population 2,299.7 1,244.2 1,784.9 2,304.4 1,585.4 1,959.8
More males than females were hospitalised as a result of an injury in every age group from 0 to 24 (Table 2.2). But there were differences in the relative contributions of each age group to the total number of hospitalised injury cases for each sex. For example, for males, the 18–24 age group contributed 43% of all 0–24 male injury hospitalisation cases whereas for females the 18–24 group contributed 35% of female cases. In contrast, the female infancy (less than 12 months), 1–4 and 5–9 groups contributed greater proportions of total 0–24 female injury hospitalisations than did the corresponding male groups to total male injury hospitalisations.
Table 2.2: Hospitalised injury cases in children and young people, by age, 2011–12
Males Females Persons
Age group Number % Number % Number %
<12 months 1,257 1.4 1,072 2.4 2,329 1.8 1–4 10,742 12.3 7,948 17.8 18,690 14.1 5–9 10,677 12.2 7,449 16.6 18,126 13.7 10–14 14,544 16.6 6,440 14.4 20,984 15.9 15–17 13,019 14.9 6,332 14.1 19,351 14.6 18–24 37,187 42.5 15,529 34.7 52,718 39.9 Total 87,426 100 44,770 100 132,198 100
Figure 2.1 presents the age-specific rates of injury for males and females by age group. The rate of injury for males was higher than the rate for females in all age groups. The difference was widest in the older groups, with male rates increasing with age more strongly than was the case for females. The highest rate of injury occurred among males in young adulthood (18–24) at 3,298 cases per 100,000 population. In the same age group the rate of injury for females was 1,440.
Figure 2.1: Age-specific rates of hospitalised injury in children and young people, 2011–12
Length of stay
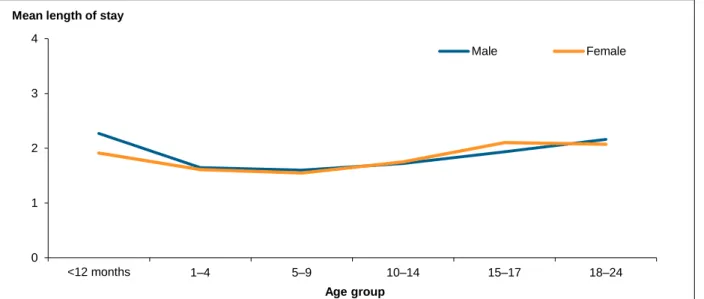
In 2011–12, the overall mean length of stay (MLOS) for hospitalised injury was 1.9 days (251,458 patient days for 132,198 cases) (Table 2.3 and Figure 2.2). MLOS was similar for males and females at most developmental stages. The longest lengths of stay occurred in infancy and young adulthood.
Table 2.3: Length of stay for hospitalised injury: case counts, total patient days, and mean length of stay in children and young people, 2011–12
Males Females Persons Age
group Cases
Total patient
days MLOS Cases
Total patient
days MLOS Cases
Total patient days MLOS <12 months 1,257 2,854 2.3 1,072 2,049 1.9 2,329 4,903 2.1 1–4 10,742 17,683 1.6 7,948 12,797 1.6 18,690 30,480 1.6 5–9 10,677 17,102 1.6 7,449 11,534 1.5 18,126 28,636 1.6 10–14 14,544 25,046 1.7 6,440 11,276 1.8 20,984 36,322 1.7 15–17 13,019 25,174 1.9 6,332 13,317 2.1 19,351 38,491 2.0 18–24 37,187 80,446 2.2 15,529 32,178 2.1 52,718 112,626 2.1 Total 87,426 168,305 1.9 44,770 83,151 1.9 132,198 251,458 1.9 0 1,000 2,000 3,000 4,000 5,000 <12 months 1–4 5–9 10–14 15–17 18–24 Age group Cases per 100,000 population
Figure 2.2: Mean length of stay for hospitalised injury in children and young people, 2011–12
Discharge occurred on the same day as admission for almost half of all injury cases (46%) and there was little variation by sex or age group other than in early childhood. Children in early childhood (56%) were discharged from hospital on the same day more frequently than children in other age groups.
Threat to life
About 7% of cases of hospitalised injury in children and young people, or 8,913 cases, were classified as high threat to life (HTTL) in 2011–12 (Table 2.4). There were 6,374 HTTL cases reported for males (7%) and 2,539 for females (6%). The largest proportion of HTTL cases (20%) occurred among infants. Fewer than 1% of all children and young people hospitalised as a result of an injury died in hospital.
Table 2.4: High threat to life(a) hospitalised injury cases in children and young people, 2011–12
Age group
Males Females Persons
Number % HTTL Died Number % HTTL Died Number % HTTL Died
<12 months 1,257 21.8 4 1,072 17.4 2 2,329 19.8 6 1–4 10,742 4.6 12 7,948 4.4 7 18,690 4.5 19 5–9 10,677 3.8 7 7,449 3.2 2 18,126 3.6 9 10–14 14,544 5.2 6 6,440 4.2 3 20,984 4.9 9 15–17 13,019 8.0 13 6,332 6.0 13 19,351 7.3 26 18–24 37,187 9.1 43 15,529 7.1 24 52,718 8.6 67 Total 87,426 7.3 85 44,770 5.7 51 132,198 6.7 136
(a) High threat to life cases defined as ICISS < 0.941 (Stephenson et al. 2003). 0 1 2 3 4 <12 months 1–4 5–9 10–14 15–17 18–24 Age group Mean length of stay
Nature of injury
Table 2.5 presents information on the more common injuries sustained by children and young people. Fractures were common, with 37% of all children and young people sustaining a fracture as a result of their injury. In males, fractures accounted for 40% of all cases, followed by open wounds (17%) and intracranial injuries (including concussion) (5%). In females, fractures accounted for 29% of all cases, followed by poisonings (17%) and open wounds (16%). As will be seen in subsequent chapters the types of injuries children sustain differ according to age, reflecting different developmental stages.
Table 2.5: Cases of hospitalised injury in children and young people, by selected nature of injury, 2011–12
Nature of injury
Males Females Persons Number % Number % Number %
Superficial (excluding eye) 3,839 4.4 2,573 5.7 6,412 4.9
Open wound (excluding eye) 14,529 16.6 7,166 16.0 21,695 16.4 Fracture (excluding tooth) 35,143 40.2 13,176 29.4 48,319 36.6
Dislocation 2,897 3.3 869 1.9 3,766 2.8
Sprain/strain 3,027 3.5 1,473 3.3 4,500 3.4
Muscle/tendon 3,543 4.1 1,071 2.4 4,614 3.5
Burn/corrosion (excluding eye) 2,186 2.5 1,198 2.7 3,384 2.6 Foreign body: all locations(a) 1,952 2.3 1,516 3.4 3,468 2.6
Intracranial (including concussion) 4,274 4.9 1,559 3.5 5,833 4.4 Poison/toxic effect (excluding bite) 3,824 4.4 7,547 16.9 11,373 8.6 Other specified nature of injury 7,293 8.4 3,095 6.9 10,388 7.7 Unspecified nature of injury 4,919 5.6 3,527 7.9 8,446 6.4
Total 87,426 100 44,770 100 132,198 100
(a) Includes foreign body in the external eye, ear canal, nose, respiratory tract, alimentary tract, or genito-urinary tract.
Body region injured
An analysis of body region injured revealed some differences between males and females (Figure 2.3). Males (41%) had a higher proportion of injuries to their shoulder and upper
limbs compared with females (30%). The higher proportion of Other injuries not specified by
body region for females was largely due to higher numbers of females with a poisoning
Figure 2.3: Body region injured, hospitalised injury cases in children and young people, 2011–12
Causes of injury
During 2011–12, the most common of the ICD-10-AM external cause groups for hospitalised injury among children and young people was ‘other unintentional causes’ (38%) (Table 2.6). This was true of both males (42%) and females (31%). ‘Other unintentional causes’ covers a
broad range of external cause categories from Chapter XX External causes of morbidity and
mortality and Other external causes of accidental injury (W00 to X59) and includes:
• Exposure to inanimate mechanical forces (W20–W49)
• Exposure to animate mechanical forces (W50–W64)
• Other accidental threats to breathing (W75–W84)
• Exposure to electric current, radiation and extreme ambient air temperature and pressure
(W85–W99)
• Contact with venomous animals and plants (X20–X29)
• Exposure to forces of nature (X30–X39)
• Overexertion, travel and privation (X50–X57)
• Accidental exposure to other and unspecified factors (X58–X59).
After ‘Other unintentional causes’,‘Falls’ were the next most common external cause for
both males (28%) and females (30%). The third most common cause of hospitalised injuries among males was ‘Unintentional transport injury’ while for females it was ‘Intentional self-harm’.
The ratio of males to females was highest for hospitalisations due to ‘Assault’, where males
outnumbered females by 3 to 1. ‘Thermal causes’ include cases of injury due to Exposure to
smoke, fire and flames (X00–X09) and cases of injury due to Contact with heat and hot substances
(X10–X19). Burns are the injury that usually (although not always) results from thermal
0 20 40 60 80 100
Other injuries not specified by body region
Head Trunk Shoulder and upper limb Hip and lower limb
Per cent of cases Body region injured
Table 2.6: Major external cause groups for hospitalised injury cases in children and young people, 2011–12
External cause
Males Females Persons
M:F ratio Number % Number % Number %
Unintentional injuries
Transport 13,303 15.2 5,836 13.0 19,139 14.5 2.3 Drowning and submersion 193 0.2 100 0.2 293 0.2 1.9 Poisoning, pharmaceuticals 1,143 1.3 1,142 2.6 2,285 1.7 1.0 Poisoning, other substances 489 0.6 321 0.7 810 0.6 1.5 Falls 24,684 28.2 13,463 30.1 38,147 28.9 1.8 Thermal causes 1,806 2.1 1,037 2.3 2,843 2.2 1.7 Other unintentional causes 36,863 42.2 13,693 30.6 50,556 38.2 2.7
Intentional injuries
Intentional self -harm 2,450 2.8 6,426 14.4 8,878 6.7 0.4
Assault 5,485 6.3 1,825 4.1 7,310 5.5 3.0
Undetermined intent 906 1.0 864 1.9 1,770 1.3 1.0
Total(a) 87,426 100 44,770 100 132,198 100 2.0
(a) Includes other external causes of injury and not reported (167 cases).
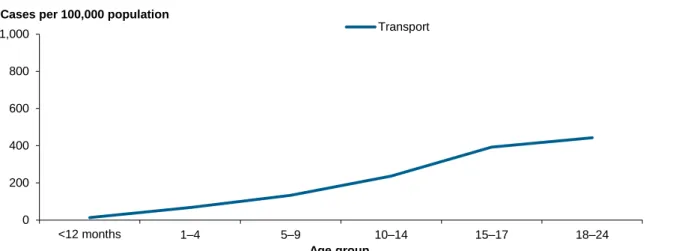
The causes of injury vary enormously by developmental age. A brief overview of these changes is provided in Figures 2.4 to 2.12, which show age-specific rates by age group for each major external cause group. (Chapters 3 to 8 examine these variances by each age group in more detail, and age-specific rates by age, sex and external cause are available in
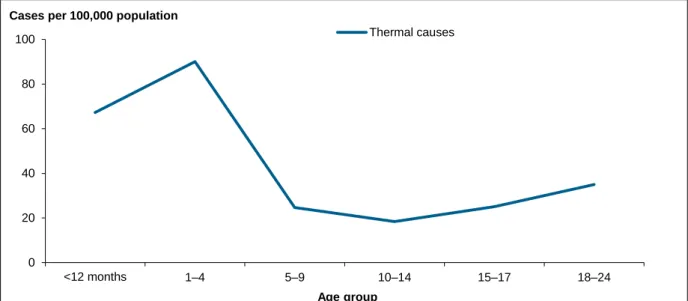
Appendix B.) Generally, higher rates of drowning and submersion, poisoning and thermal causes are found in younger children while unintentional transport injury, intentional self-harm, assault and other unintentional causes are found in older children and young people. Falls are prevalent across a wider range of age groups but the types of falls differ according to developmental stage.
Figure 2.4: Age-specific rates of transport injury for hospitalised injury cases in children and young people, by age group, 2011–12
0 200 400 600 800 1,000 <12 months 1–4 5–9 10–14 15–17 18–24 Age group Cases per 100,000 population
Figure 2.5: Age-specific rates of drowning and submersion injury for hospitalised injury cases in children and young people, by age group, 2011–12
Figure 2.6: Age-specific rates of poisoning by pharmaceuticals for hospitalised injury cases in children and young people, by age group, 2011–12
0 5 10 15 <12 months 1–4 5–9 10–14 15–17 18–24 Age group Cases per 100,000 population
Drowning and submersion
0 20 40 60 80 100 <12 months 1–4 5–9 10–14 15–17 18–24 Age group Cases per 100,000 population
Figure 2.7: Age-specific rates of poisoning by other substances for hospitalised injury cases in children and young people, by age group, 2011–12
Figure 2.8: Age-specific rates of falls for hospitalised injury cases in children and young people, by age group, 2011–12 0 20 40 60 80 100 <12 months 1–4 5–9 10–14 15–17 18–24 Age group Cases per 100,000 population
Poisoning, other substances
0 200 400 600 800 1,000 <12 months 1–4 5–9 10–14 15–17 18–24 Age group Cases per 100,000 population
Figure 2.9: Age-specific rates of injury due to thermal causes for hospitalised injury cases in children and young people, by age group, 2011–12
Figure 2.10: Age-specific rates of injury due to ‘Other unintentional causes’ for hospitalised injury cases in children and young people, by age group, 2011–12
0 20 40 60 80 100 <12 months 1–4 5–9 10–14 15–17 18–24 Age group Cases per 100,000 population
Thermal causes 0 200 400 600 800 1,000 <12 months 1–4 5–9 10–14 15–17 18–24 Age group Cases per 100,000 population
Figure 2.11: Age-specific rates of intentional self-harm for hospitalised injury cases in children and young people, by age group, 2011–12
Figure 2.12: Age-specific rates of assault for hospitalised injury cases in children and young people, by age group, 2011–12
The proportions of cases that were classified as high threat to life in each age group, by external cause, can be seen in Table 2.7. For drowning and submersion the proportion of high threat to life cases is very high, although overall rates are low in comparison to the majority of other external causes of injury. For infants, all cases of hospitalised drowning and
submersion were classified as high threat to life. In contrast, rates of hospitalised fall injury are high but the proportion of high threat to life cases was low in all age groups other than infants. 0 200 400 600 800 1,000 <12 months 1–4 5–9 10–14 15–17 18–24 Age group Cases per 100,000 population
Intentional self -harm
0 100 200 300 <12 months 1–4 5–9 10–14 15–17 18–24 Age group Cases per 100,000 population
Table 2.7: Proportion of high threat to life(a) cases by major external cause groups, by age group,
2011–12 (per cent)
<12 months 1–4 5–9 10–14 15–17 18–24 Total Unintentional injuries
Transport 22.5 13.3 12.0 11.7 20.5 22.2 18.7
Drowning and submersion 100.0 98.7 96.4 60.7 63.6 71.1 89.4
Poisoning, pharmaceuticals 0.0 0.2 1.6 0.0 0.5 0.9 0.5
Poisoning, other substances 0.0 3.4 2.3 5.2 6.9 3.6 3.7
Falls 18.8 3.1 2.4 4.2 6.7 7.8 4.8
Thermal causes 6.1 8.6 9.5 7.4 17.6 14.3 10.7
Other unintentional causes 22.5 2.9 2.1 2.1 2.4 2.1 2.6
Intentional injuries
Intentional self -harm(b) n.p. n.p. n.p. 5.2 3.4 4.5 4.2
Assault 31.0 21.1 6.9 9.6 12.7 16.0 15.4
(a) High threat to life cases defined as ICISS < 0.941 (Stephenson et al. 2003).
(b) High threat to life cases for children under 10 years of age not reported (see Box 1.3).
Place of injury
Nearly half (48%) of all injury cases had an unspecified place of occurrence. For those cases with a specified place, the majority of injuries occurred in the home (18%) (Table 2.8). This was true of males (15%) and females (26%). Apart from this difference, the most striking comparison between males and females was for injuries that occurred at industrial and construction areas. The ratio of males to females injured at industrial and construction areas was 25:1.
Table 2.8: Place of occurrence of injury in children and young people, 2011–12
Males Females Persons
M:F ratio Place of occurrence Number % Number % Number %
Home 12,738 14.6 11,650 26.0 24,388 18.4 1.1
Residential institution 278 0.3 129 0.3 407 0.3 2.2
School, other institution & public
administration area 5,000 5.7 3,000 6.7 8,000 6.1 1.7
Sports and athletics area 11,046 12.6 2,334 5.2 13,380 10.1 4.7
Street and highway 7,568 8.7 3,776 8.4 11,344 8.6 2.0
Trade and service area 2,256 2.6 943 2.1 3,199 2.4 2.4
Industrial and construction area 1,212 1.4 49 0.1 1,261 1.0 24.7
Farm 909 1.0 346 0.8 1,255 0.9 2.6
Other specified place of
occurrence 4,327 4.9 1,866 4.2 6,193 4.7 2.3
Unspecified 42,092 48.1 20,677 46.2 62,771 47.5 2.0
Total 87,426 100 44,770 100 132,198 100 2.0
Activity at time of injury
Overall, the proportion of cases with an unspecified activity at time of injury was 55% (72,924) (Table 2.9). Among cases with a specified activity at time of injury, most occurred while the child or young adult was engaged in sport (19%). Males and females had a different profile of activity at time of injury. Higher proportions of males were injured playing sport and working for income, while higher proportions of females were injured while engaged in leisure or resting.
Table 2.9: Activity at time of injury for children and young people, 2011–12
Males Females Persons
M:F ratio Activity Number % Number % Number %
While engaged in sports 20,047 22.9 5,108 11.4 25,155 19.0 3.9 While engaged in leisure 7,136 8.2 4,311 9.6 11,447 8.7 1.7 While working for income 4,748 5.4 733 1.6 5,481 4.1 6.5 While engaged in other types of
work 1,412 1.6 574 1.3 1,986 1.5 2.5
While resting, sleeping, eating,
etc. 1,404 1.6 1,119 2.5 2,523 1.9 1.3
Other specified activity 5,401 6.2 7,279 16.3 12,682 9.6 0.7
Unspecified 47,278 54.1 25,646 57.3 72,924 55.2 1.8
Remoteness of usual residence
Past research has demonstrated that patterns and rates of injury change with increasing remoteness (AIHW 2008). Increasing remoteness is associated with a higher prevalence of areas of socioeconomic disadvantage, and people who are socially and economically
disadvantaged generally have poorer health outcomes and increased exposure to health risk factors (AIHW 2010b). Other issues relevant to increasing rates of injury by remoteness include exposure to unsafe roads and lack of access to primary health care (AIHW 2011a, AIHW 2011c).
The age-standardised rate of injury in children and young people increased with increasing remoteness. The rate of injury for residents of Very remote regions (3,482 per 100,000
population) was more than double the rate for residents of Major cities (1,564 per 100,000 population) (Table 2.10).
Table 2.10: Hospitalised injury cases, by remoteness of usual residence for children and young people, 2011–12
Remoteness of usual residence Indicators Major cities Inner regional Outer regional Remote Very
remote Total(a)
Estimated injury cases 81,923 28,468 14,124 3,402 2,608 132,198 Proportion of estimated injury cases (%) 62.0 21.5 10.7 2.6 2.0 100 Age-standardised rate/100,000
population 1,564 2,142 2,183 3,321 3,428 1,785 (a) Includes 1,673 cases where remoteness was not reported or residence was reported as an external territory.
Aboriginal and Torres Strait Islander children and
young people
Many factors contribute to the relatively high rates of hospitalised injuries in Aboriginal and Torres Strait Islander children and young people. These include the ongoing effects of colonisation, social disadvantage, drug and alcohol misuse, violence, poor safety standards and unsafe roads and living environments (AIHW 2011a). In addition, a higher proportion of Aboriginal and Torres Strait Islander children and young people live in remote regions, and remoteness is significantly associated with rates of injury (Eades et al. 2010; Helps &
Harrison 2006; Pointer 2013).
There were 9,931 hospital separations due to injury and poisoning for Indigenous children and young people during 2011–12 (Table 2.11) for an estimated 9,011 injury cases. More males than females were hospitalised (ratio of 1.5:1). For Indigenous children and young people, rates of injury were almost twice those of other Australians. Aboriginal and Torres Strait Islander females had rates of injury twice those of other Australian females. Rates of injury were also higher for Aboriginal and Torres Strait Islander males compared to other Australian males.
Table 2.11: Hospitalised injury cases for children and young people, Aboriginal and Torres Strait Islander and Other Australians, 2011–12
Aboriginal and Torres Strait Islander people Other Australians
Indicators Males Females Persons Males Females Persons
Separations from hospital
due to injury 5,980 3,951 9,931 87,575 43,722 131,299 Estimated injury cases 5,384 3,627 9,011 82,042 41,143 123,187 Age-standardised
rate/100,000 population 3,326 2,347 2,849 2,257 1,202 1,743
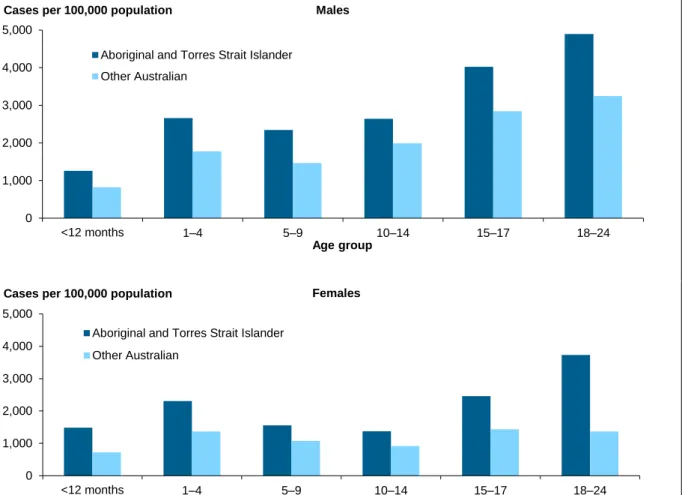
Rates of injury in Aboriginal and Torres Strait Islander children and young people were higher than rates in other Australian children and young people at each age group for males and females (Figure 2.13). The greatest difference in rates of injury in males occurred at 5–9 where Aboriginal and Torres Strait Islander boys (2,347 cases per 100,000 population) had rates 1.6 times as high as their other Australian counterparts (1,462). For females the greatest difference occurred in 18–24 year olds where the ratio between Aboriginal and Torres Strait Islander females (3,734) and other Australian females (1,366) was 2.7. Rates in Aboriginal and Torres Strait Islander infant girls (1,484) were also twice (2.1) those of other Australian infant girls (722). In comparison the rate ratio between Aboriginal and Torres Strait Islander (1,257) and other Australian (825) infant boys was 1.5.
Figure 2.13: Age-specific rates for hospitalised injury cases for children and young people, by age and sex, Aboriginal and Torres Strait Islander and Other Australians, 2011–12
0 1,000 2,000 3,000 4,000 5,000 <12 months 1–4 5–9 10–14 15–17 18–24 Age group Cases per 100,000 population
Aboriginal and Torres Strait Islander Other Australian 0 1,000 2,000 3,000 4,000 5,000 <12 months 1–4 5–9 10–14 15–17 18–24 Age group Cases per 100,000 population
Aboriginal and Torres Strait Islander Other Australian
Females Males
3
Less than 12 months (Infancy)
The age range covered by infancy—less than 12 months old—is characterised by rapid developmental changes to behaviour, and changes in the environmental hazards infants are exposed to as they become more mobile (Agran et al. 2003, Siskind & Scott 2013).
Together, these factors result in changing risks of injury as the infant gets older. For example:
• from 0 to 4 months, infants start to bring their hands to their mouths, and will soon start
to reach and grasp for objects and put them into their mouths
• at 3–5 months infants begin to roll
• at 8–12 months infants start to crawl, pull up to furniture, ‘cruise’ around furniture, and
stand briefly by themselves—some will even start to walk.
There were 2,329 cases of infants less than 12 months hospitalised as a result of an injury in 2011–12, representing 2% of all hospitalised injury cases in children and young people (Table 3.1). The age-specific rate of injury for infants was 799 per 100,000 population, and infant boys had a higher rate of injury than infant girls. In comparison, the overall rate of injury in children and young people aged 0 to 24 was 1,804 cases per 100,000 population.
Table 3.1: Key indicators for hospitalised injury cases in infants (<12 months), 2011–12
<12 months
Indicators Boys Girls Children
Separations from hospital due to injury 1,394 1,159 2,553
Estimated injury cases 1,257 1,072 2,329
Age-specific rate/100,000 population 839 757 799
Nature of injury
Table 3.2 presents information on the more common injuries sustained in infants. Fractures were a common injury for both boys (15%) and girls (16%), closely followed by superficial injuries excluding the eye (14%). The higher proportion of infants hospitalised with a superficial injury (14.4% of cases) compared with all children and young people (4.9%, see Table 2.5) may be reflective of higher rates of general hospital admissions for infants compared with older children and adults.
Compared with other age groups, infants had the highest proportion of injuries occurring as a result of the effects of foreign bodies entering through natural orifices (9%, 216 cases). Injuries caused by foreign bodies were dominated by Foreign body in respiratory tract (T17) (129 cases), which includes asphyxia or choking, most likely on food, phlegm or as a result of inhalation of liquid or vomit (NCCH 2010).
Infants had the highest proportion (7%) of intracranial injuries compared to children at all other developmental stages. MacInnes and Stone (2008, p.6) suggest that the high proportion of head injuries may be due to two factors: ‘the minimal control that babies are able to exert over head position and movements, and their relatively inability to take avoiding or
Table 3.2: Cases of hospitalised injury in infants (<12 months), by selected nature of injury, 2011–12
Nature of injury
Boys Girls Children Number % Number % Number %
Superficial (excluding eye) 168 13.4 167 15.6 335 14.4
Open wound (excluding eye) 109 8.7 84 7.8 193 8.3
Fracture (excluding tooth) 183 14.6 167 15.6 350 15.0
Burn/corrosion (excluding eye) 116 9.2 79 7.4 195 8.4
Foreign body: all locations(a) 119 9.5 97 9.1 216 9.2
Intracranial (including concussion) 105 8.4 60 5.6 165 7.1
Drowning, immersion 17 1.4 17 1.6 34 1.5
Poison/toxic effect (excluding bite) 40 3.2 54 5.0 94 4.0
Other specified nature of injury 104 8.1 73 6.8 177 7.6
Unspecified nature of injury 297 23.6 273 25.5 570 24.5
Total 1,257 100 1,072 100 2,329 100
(a) Includes foreign body in the external eye, ear canal, nose, respiratory tract, alimentary tract, or genito-urinary tract.
The large proportion of cases of unspecified injury (25%) in this age group, compared with other children, may reflect precautionary admissions to rule out the presence of serious injury. Most of the cases followed falls or unintentional transport events. (A similar pattern by age is present with principal diagnosis codes for Examination and observation following
transport accident (Z04.1)—these cases are not included as injury in this report.)
Body region injured
The predominance of head injuries in infants (57%), particularly in comparison to all children and young people (23%), can be clearly seen in Figure 3.1. The relatively high proportion of injuries not specified by body region (27%) includes poisoning cases.
Figure 3.1: Body region injured for hospitalised injury cases in infants (<12 months), 2011–12
0 20 40 60 80 100
Other injuries not specified by body region
Head Trunk Shoulder and upper limb Hip and lower limb
Per cent of cases Body region injured
Causes of injury
During 2011–12, the most common cause of hospitalised injury among infants was a fall (49%) (Table 3.3). This was true of boys (48%) as well as girls (52%). The second most common cause of hospitalised injury among infants was ‘other unintentional causes’ (30%), followed by thermal causes (8%).
Table 3.3: Major external cause groups for hospitalised injury cases in infants (<12 months), 2011–12
External cause
Boys Girls Children Number % Number % Number % Unintentional injuries
Transport 24 1.9 16 1.5 40 1.7
Drowning and submersion 14 1.1 14 1.3 28 1.2
Poisoning, pharmaceuticals 19 1.5 36 3.4 55 2.4
Poisoning, other substances 16 1.3 14 1.3 30 1.3
Falls 599 47.7 552 51.5 1,151 49.4
Thermal causes 115 9.1 81 7.6 196 8.4
Other unintentional causes 389 30.9 301 28.1 690 29.6
Intentional injuries(a)
Assault 54 4.3 46 4.3 100 4.3
Undetermined intent 16 1.3 11 1.0 27 1.2
Total(b) 1,257 100 1,072 100 2,329 100
(a) Cases coded as intentional self-harm have been omitted, see Box 1.3.
(b) Includes other external causes of injury and not reported (n = 12).
In comparison to all children and young people, infants had higher age-specific rates of drowning and thermal causes (Figure 3.2). While the age-specific rate of fall injury
hospitalisations (395 per 100,000 population) was lower in infants than in all children and young people (521 per 100,000 population) it was still very high compared to the rates for other causes of injury in infants.
Figure 3.2: Age-specific rates for hospitalised injury cases in infants (<12 months), by external cause, 2011–12
Falls
Infants were hospitalised as a result of a Fall while being carried or supported by other persons in 23% of infant cases involving falls (Table 3.4). A similar proportion of infants had a fall involving a bed (21%) while falls involving chairs and other furniture accounted for 12% and 13% of hospitalised falls respectively. Falls in these latter 3 categories may occur as infants learn to roll over and are no longer safe when left unattended (Ibrahim et al. 2012; Schnitzer et al. 2013).
Table 3.4: Types of fall for hospitalised injury cases in infants (<12 months), 2011–12
Type of fall
Boys Girls Children Number % Number % Number %
Fall while being carried or supported by other persons 140 23.4 129 23.4 269 23.4
Fall involving bed 128 21.4 114 20.7 242 21.0
Fall involving chair 66 11.0 74 13.4 140 12.2
Fall involving other furniture 69 11.5 77 13.9 146 12.7
Other fall from one level to another 56 9.3 62 11.2 118 10.3
Other types of fall 140 23.4 96 17.4 236 20.5
Total 599 100 552 100 1,151 100 0 200 400 600 800 External cause Cases per 100,000 population
Drowning
Of the 28 cases of infants hospitalised as a result of drowning, 22 occurred in a bathtub. Leaving infants unattended is the most common factor associated with drowning (Peden et al. 2008). Leaving children in the care of another young child in the bath is also a cause of hospitalised drowning in infants (Brenner 2003; van Beelen et al. 2013). All 28 cases were classified as HTTL.
Thermal causes
The age-specific rate of thermal causes of injury in infants (67 per 100,000 population) was second to 1–4 year olds (90 per 100,000 population) and almost twice that of all children and young people (39 per 100,000 population). Infants were more frequently injured as a result of
Contact with hot drinks, food, fats and cooking oils (30%) compared to other types of thermal
causes (Table 3.5). Hot water burns from taps accounted for 14% of all thermal causes.
Table 3.5: Types of thermal causes of injury for hospitalised injury cases in infants (<12 months), 2011–12
Type of thermal causes
Boys Girls Children Number % Number % Number %
Contact with hot drinks, food, fats and cooking
oils 28 24.3 31 38.3 59 30.1
Contact with hot tap water 19 16.5 9 11.1 28 14.3
Contact with other hot fluids 25 21.7 20 24.7 45 23.0
Contact with hot household appliances 22 19.1 14 17.3 36 18.4 Contact with hot heating appliances, radiators
and pipes 11 9.6 6 7.4 17 8.7
All other types of thermal injury 10 8.7 1 1.2 11 5.6
Total 115 100 81 100 196 100
Boys and girls exhibited different patterns of body region injured as a result of a burn (Figure 3.3). For example, a higher proportion of boys than girls were burnt on the wrist and hand (40% compared with 18%), while girls had a higher proportion of burns to the hip and lower limb (27% compared with 17%). (Caution should be exercised in interpreting these results because of low case numbers.)
Figure 3.3: Body region burned due to thermal causes, for hospitalised injury cases in infants (<12 months), 2011–12
Place of injury
The majority of injuries in infants occurred in the home (60%). About 31% of injury events had no information reported on place of occurrence.
Remoteness of usual residence
The age-specific rate of injury in infants generally rose with increasing remoteness. The rate of injury for residents of Remote regions was almost twice the rate for residents of Major cities
(1,379 and 733 cases per 100,000 population, respectively) (Table 3.6).
Table 3.6: Hospitalised injury cases, by remoteness of usual residence for infants (<12 months), 2011–12
Remoteness of usual residence Indicators Major cities Inner regional Outer regional Remote Very
remote Total(a)
Estimated injury cases 1,542 420 241 66 35 2,329
Proportion of estimated injury cases (%) 66.2 18.0 10.3 2.8 1.5 100 Age-specific rate/100,000 population 733 844 928 1,379 1,161 799 (a) Includes 25 cases where remoteness was not reported or residence was reported as an external territory.
0 20 40 60 80 100
Burn of head & neck Burn of trunk Burn of shoulder & upper limb Burn of wrist & hand Burn of hip & lower limb Burn of ankle & foot
Per cent of cases Location of burn
Aboriginal and Torres Strait Islander infants
There were 208 Indigenous infants hospitalised due to injury and poisoning during 2011–12 (Table 3.7). Indigenous infant rates of injury were almost twice (1.8) those of other Australian infants.
Aboriginal and Torres Strait Islander infant girls had a higher rate of injury than Aboriginal and Torres Strait Islander infant boys. Rates of injury for Aboriginal and Torres Strait Islander infant girls were also just over twice that of other Australian infant girls.
Table 3.7: Hospitalised injury cases for infants (<12 months), Aboriginal and Torres Strait Islander and Other Australians, 2011–12
Aboriginal and Torres Strait Islander infants Other Australian infants Indicators Boys Girls Children Boys Girls Children
Separations from hospital
due to injury 108 122 230 1,286 1,037 2,323
Estimated injury cases 98 110 208 1,159 962 2,121
Age-standardised
4
1–4 years (Early childhood)
The early childhood age range of 1–4 years is characterised by increasing mobility coupled with lots of energy, curiosity and a need to explore. Children in this age group are still too young to be aware of danger and may not be able to keep themselves safe (Bugeja & Franklin 2005; Scott 2003). Their ability to climb and access a range of areas where hazardous objects and substances are kept increases (Agran et al. 2003; Ibrahim et al. 2012; Schmertmann et al. 2013). In addition, their increased mobility outside the home increases their exposure to a range of environmental hazards (MacInnes & Stone 2008).
There were 18,690 cases of children 1–4 years hospitalised as a result of an injury in 2011–12 (Table 4.1), representing 14% of all hospitalised injury cases in children and young people. The age-specific rate of injury was 1,590 per 100,000 population, and boys had a higher rate of injury compared to girls. In comparison, the overall rate of injury in children and young people aged 0 to 24 was 1,804 cases per 100,000 population.
Table 4.1: Key indicators for hospitalised injury cases in children (1–4), 2011–12
1–4 years
Indicators Boys Girls Children
Separations from hospital due to injury 11,601 8,616 20,217
Estimated injury cases 10,742 7,948 18,690
Age-specific rate/100,000 population 1,781 1,389 1,590
Nature of injury
The more common types of injuries sustained in early childhood are presented in Table 4.2. Fractures (22%) and open wounds (29%) were the most frequent. Children in this age group had the highest percentage of open wounds as a result of their injury compared to all the other groups. Foreign bodies in the ear canal (430 cases), nose (377) and alimentary tract (375) accounted for 81% of all foreign body cases in early childhood.
Table 4.2: Cases of hospitalised injury in early childhood (1–4), by selected nature of injury, 2011–12
Nature of injury
Males Females Persons Number % Number % Number %
Superficial (excluding eye) 635 5.9 473 6 1,108 5.9
Open wound (excluding eye) 3,223 30 2,155 27.1 5,378 28.8 Fracture (excluding tooth) 2,296 21.4 1,781 22.4 4,077 21.8 Burn/corrosion (excluding eye) 647 6 522 6.6 1,169 6.3 Eye injury (excluding foreign body in external
eye) 68 0.6 41 0.5 109 0.6
Foreign body: all locations(a) 746 6.9 708 8.9 1,454 7.7
Intracranial (including concussion) 357 3.3 249 3.1 606 3.2 Dental (including fractured tooth) 348 3.2 250 3.1 598 3.2
Drowning, immersion 99 0.9 66 0.8 165 0.9
Poison/toxic effect (excluding bite) 726 6.8 574 7.2 1,300 7.0
Bite (including invenomation) 84 0.8 41 0.5 125 0.7
Other specified nature of injury 567 5.4 397 5.1 964 5.1
Unspecified nature of injury 948 8.8 693 8.7 1,641 8.8
Total 10,742 100 7,948 100 18,690 100
(a) Includes foreign body in the external eye, ear canal, nose, respiratory tract, alimentary tract, or genito-urinary tract.
Body region injured
The prominence of head injuries in early childhood (39%), in comparison to all children and young people (23%), can be seen in Figure 4.1. The relatively high proportion of cases not specified by body region (24%) includes poisoning cases.
Figure 4.1: Body region injured in hospitalised injury cases early childhood (1–4), 2011–12
0 20 40 60 80 100
Other injuries not specified by body region
Head Trunk Shoulder and upper limb Hip and lower limb
Per cent of cases
Causes of injury
The most common cause of hospitalised injury in early childhood was a fall (43%) (Table 4.3). Boys and girls were hospitalised as a result of a fall in the same proportions. The large ‘Other unintentional causes’ group (38%) includes 413 cases due to being Bitten or struck by dog.
Table 4.3: Major external cause groups for hospitalised injury cases in early childhood (1–4), 2011–12
External cause
Boys Girls Children Number % Number % Number % Unintentional injuries
Transport 486 4.5 304 3.8 790 4.2
Drowning and submersion 93 0.9 60 0.8 153 0.8
Poisoning, pharmaceuticals 549 5.1 449 5.6 998 5.3
Poisoning, other substances 187 1.7 138 1.7 325 1.7
Falls 4,581 42.6 3,390 42.7 7,971 42.6
Thermal causes 584 5.4 474 6.0 1,058 5.7
Other unintentional causes 4,137 38.5 3,027 38.1 7,164 38.3
Intentional injuries(a)
Assault 55 0.5 54 0.7 109 0.6
Undetermined intent 55 0.5 46 0.6 101 0.5
Total(b) 10,741 100 7,947 100 18,688 100
(a) Cases coded as intentional self-harm have been omitted, see Box 1.3.
(b) Includes injury cases where external cause is out of scope (19 cases).
Compared to all children and young people, children in early childhood had higher
age-specific rates of drowning, falls, thermal causes and poisoning (by pharmaceutical and other substances) (Figure 4.2). Age-specific rates were the highest of any age group covered in this report for cases due to drowning (13 per 100,000 population), thermal causes (90 per 100,000 population), and poisoning by pharmaceuticals (85 per 100,000 population). The age-specific rate for falls in early childhood was the second highest of all the age groups at 678 cases per 100,000 population.
Figure 4.2: Age-specific rates for hospitalised injury cases in early childhood (1–4), by external cause, 2011–12
Drowning
Children under the age of 5 have the highest drowning mortality rates worldwide (Peden et al. 2008). In Australia, domestic swimming pools are a drowning hazard for young children (Scott 2003). Of the 153 cases of children aged 1–4 hospitalised as a result of drowning and immersion, 90 occurred in a swimming pool and 13 cases occurred in a bathtub (Table 4.4). More boys than girls were hospitalised as a result of drowning in a swimming pool.
Table 4.4: Location of drowning for hospitalised injury cases in early childhood (1–4), 2011–12
Boys Girls Children Number % Number % Number %
Swimming pool 56 60.2 34 56.7 90 58.8
Natural water 5 5.4 5 8.3 10 6.5
Bathtub 8 8.6 5 8.3 13 8.5
Other or unspecified 24 25.8 16 26.7 40 26.1
Total 93 100 60 100 153 100
While the absolute number of cases of drowning is small compared to other causes of injury, the cases tend to be more serious in terms of threat to life and lengths of stay. Nearly all (151) cases of drowning in early childhood in 2011–12 were classified as HTTL. This was similar to the rate found among children and young people in NSW in 2009–10, where almost
four-fifths (88%) of drowning cases were classified as high threat to life (Harris & Pointer
0 200 400 600 800 External cause Cases per 100,000 population