The Effects of Foreign Direct Investments on Transition
Economies: The Balkans Case
Emre M. Görgülü Afyon Kocatepe University
Turkey egorgulu@aku.edu.tr
Abstract: The stabilized economic growth in the long-run lies ahead as an obstacle in the long road of development for many transition economies especially for those are in the Balkans. Some of the Balkan countries such as Croatia and Bulgaria have managed to get aboard to the European Union train. But for many others, the train has not arrived yet. Furthermore, many of those non-European Union member transition economies in the Balkans have to deal with an inheritance of a war economy experienced during early 90s. Today non-European Union member transition economies in the Balkans need to increase the capital flows to their countries for economic growth purposes. The literature on foreign direct investments suggest that there may be some positive effects on the economic growth of the host countries depending on many conditions - most commonly on absorptive capacities. However, are they really ready for this? Are the absorptive capacities in those countries at the extent in which enable them to extract benefits from foreign investments? The answer to this question is the key to truly understand the effects of foreign direct investments in those countries. Therefore, in this study, the effects of foreign direct investments on the economic growth of non-European Union member transition economies in the Balkans are investigated from the absorptive capacity perspective. This paper serves a role in comprehending the true dynamics of absorptive capacities measured through a new technique presented in this paper. The results confirm that current foreign direct investment flows to those non-European Union member Balkan countries are not able to work miracles given the absorptive capacities of the host countries.
Keywords: Foreign Direct Investments; Transition Economies; Economic Develop-ment; Absorptive Capacities
JEL Classification: F21, O40, O43, P24, P33 Article History Submitted: 29 April 2015 Resubmitted: 24 July 2015 Resubmitted: 8 September 2015 Accepted: 9 September 2015 http://dx.doi.org/10.14706/JECOSS15523
Introduction
Following the painful 90s, stabilized economic growth becomes the predominant objective for most of the Balkans. In this direction, some of the Balkan countries such as Croatia and Bulgaria have managed to get aboard to the European Union (EU) train. But for many others, the train has not arrived yet. Moreover, being a transition economy in the Balkans creates additional burdens to these counties. Having experienced the harsh Bosnian War and the lagged effects of it, those countries are still struggling to find their way into the long road of development.
As an international political instrument Foreign Direct Investments (FDIs) are playing an increasingly important role in economic development. By means of FDIs, the host countries may be affected positively through externality effects and capital enhancement (Alfaro, Chanda, Kalemli-Ozcan, and Sayek, 2006; Sun, 2002). However, FDIs can also create adverse effects such as external-dependency and imbalances in local markets. The outcome on the host economies basically depends on the level of absorptive capacities in these countriesi. Thus, the effects of FDIs in host countries with solid administrative, financial and economical infrastructures differ from the effects in countries lack such structures. These structural differences create a long range of effects on the host countries.
In this paper, the effects of FDIs on economic growth of transition economies in the Balkans are investigated through an absorptive capacity perspective. The distinction between EU member Balkan countries and non-EU member Balkan countries has been made in the paper with “transition” concept taken into account; since EU members would be expected to have a better absorptive capacity due to EU obligations has to be fulfilled in order to reach EU standards. Thus, this paper concentrates only on non-EU member transition economies in the Balkansii. Accordingly, the FDIs in the host countries that have some level of absorptive capacities may have some effects that accelerate the growth, while, the FDIs in countries that lack such absorptive capacities, may not promote the growth. Moreover, there is a mutual relationship between absorptive capacities and FDIs. On one hand, absorptive capacities can stimulate the effects of FDIs to both positive and negative sides; on the other hand, FDI flows to a country are in line with the absorptive capacity of that country; as the capacity increases the possibility of increased FDI flows arises (Alfaro et al., 2004; Alfaro et al., 2006). Therefore, the absorptive capacities of the host countries are of vital importance when it comes down to FDIs. Through the absorptive capacity perspective the aim of this paper is to empirically reveal to what extent transition economies in the Balkans can utilize FDIs. Given the potential significance of FDIs on economic development, this paper not only offers an overall guideline on the matter for the transition economies in the Balkans but also presents a new technique to measure the absorptive capacities. Through the new technique employed to measure absorptive capacities, the study aims at contributing to the literature.
Following the introduction, the FDI movements in Balkans are handled in the second part. In the third part, a comprehensive reasoning for the concept of absorptive capacity and its ties with FDIs takes place along with the empirical analyses applied to the sample. Findings of the analysis are also presented in this part. In the final conclusion part, the results of the analyses have been studied and the paper has been concluded.
FDIs in the Balkans
The International Monetary Fund (IMF) listed transition economies in 2000 (International Monetary Fund, 2000). According to this list; Croatia, Bulgaria, Albania and Macedonia were listed as transition economies. Later, the World Bank added Bosnia Herzegovina and then Serbia and Montenegro as transition economies as well in 2002 (The World Bank, 2002). After Bulgaria’s membership to EU in 2007, World Bank no longer considered her as a transition economy (Alam, Casero, Khan, and Udomsaph, 2008). Further, while the World Bank includes Kosovo to the list of transition economies in 2009 (The World Bank, 2010), she still remains as a partially recognized state due to ongoing territorial claim issues with Serbia (Rettman, 2013) iii. Moreover, even though, Croatia is still considered as a transition economy, its good economic performance starting from the 2000s and her membership to EU, singles her out from the rest of the group along with Bulgaria. Due to the fact that she is an EU member now, it is expected from her to have a better absorptive capacity needed to carry out EU integration. Therefore, for the purposes of this study, only Albania, Bosnia Herzegovina, Macedonia, Montenegro and Serbia fit in the group of non-EU member transition economies in the Balkans and are considered in the sample.
Following the dissolution of Eastern Bloc, the Balkans faces an era of turmoil and wars. In this period of turmoil in the Balkansiv economic stability was far beyond reach. Naturally, as a result of the socialist heritage and the era of wars and turmoil, foreign investments were not significant at the time. Total FDI inflows for the non-EU member transition countries in the Balkans; namely Albania, Bosnia Herzegovina, Montenegro, Serbia - Serbia and Montenegro at the timev - and Macedonia in the period of 1992-2001 was 3.82 billion US Dollars (United Nations Conference on Trade and Development, 2015). Whereas the total FDI outflows for the same group of countries in the same period was only 14.64 million US Dollars (United Nations Conference on Trade and Development, 2015).
After 2001, the region finally reaches peace and with the increasing global free movement of capital, FDI movements for these countries increased remarkably. For the period 2002-2013 FDI inflows in the region rose sharply to 51.69 billion US Dollars, while FDI outflows reached 2.97 billion US Dollars (United Nations Conference on Trade and Development, 2015). Since following 2001 the region could finally start to operate in a market manner, the period 2002-2013 was taken as the time frame for the analyses conducted in this paper.
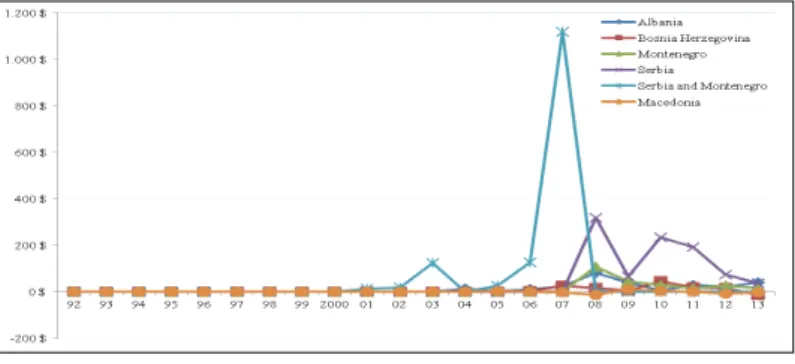
According to the FDI movement data (United Nations Conference on Trade and Development, 2015) in the region; for the pre-2002 period Serbia and Montenegro was the biggest FDI recipient with a total of 1.52 billion US Dollars and largest FDI sender with nearly 14 million US Dollars in total. For the post-2002 period, despite Serbia and Montenegro cease to exist as a union at 2006, they still remain the largest FDI recipient country in the region with 15.6 billion US Dollars, such that they almost attract more foreign investment than the two countries combined for the period. As for the FDI outflows Serbia and Montenegro still top the list with a figure of 1.41 billion US Dollars. However, the Union owes this FDI movement success mainly to Serbia with her 12.9 billion US Dollars inflow and 924.6 million US Dollars outflow performances (United Nations Conference on Trade and Development, 2015). Below Figure-1 shows FDI inflows to the region for the entire 1992-2013 period, while Figure-2 presents FDI outflows from the region for the same period.
Figure 1. FDI Inflows to non-EU Member Transition Economies in the Balkans (millions)
Source: United Nations Conference on Trade and Development (2015)
Figure 2. FDI Outflows from non-EU Member Transition Economies in the Balkans (millions)
The pre-2002 period for the region has no significant FDI movement, and for the post-2002 period, it is worth concentrating on 2008-2013 period since Serbia and Montenegro started to have separate data from that date on and between these dates we can truly observe increased FDI movements. So, for the period 2008-2013 FDI movements in the region is summarized for inflows and outflows in Table 1 and Table 2 respectively. However, for the statistical significance purpose, we would need more observations. Therefore, given data availability constraints in the sample, the analyses are made for the period 2002-2013.
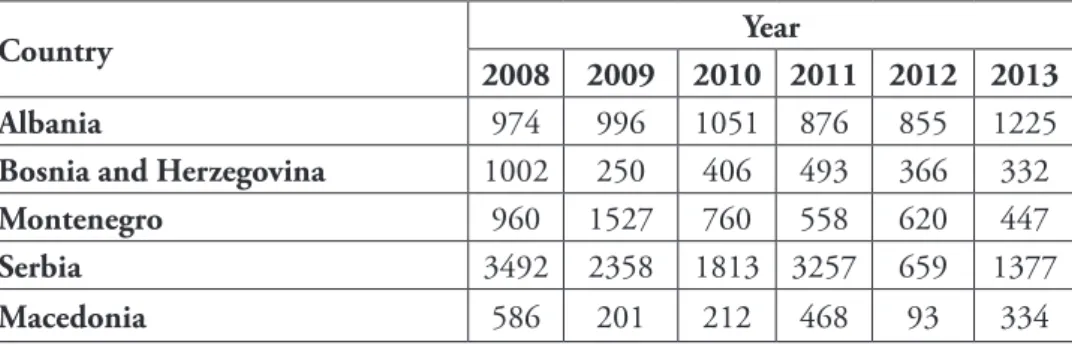
Table 1. FDI Inflows to non-EU Member Transition Economies in the Balkans (USD in Millions)
Country Year
2008 2009 2010 2011 2012 2013
Albania 974 996 1051 876 855 1225
Bosnia and Herzegovina 1002 250 406 493 366 332
Montenegro 960 1527 760 558 620 447
Serbia 3492 2358 1813 3257 659 1377
Macedonia 586 201 212 468 93 334
Source: United Nations Conference on Trade and Development (2015)
Table 2. FDI Outflows from non-EU Member Transition Economies in the Balkans (USD in Millions)
Country Year
2008 2009 2010 2011 2012 2013
Albania 81 39 6 30 23 40
Bosnia and Herzegovina 17 6 46 18 15 -13
Montenegro 108 46 29 17 27 17
Serbia 319 67 235 191 75 37
Macedonia -14 11 2 0 -8 -2
Source: United Nations Conference on Trade and Development (2015)
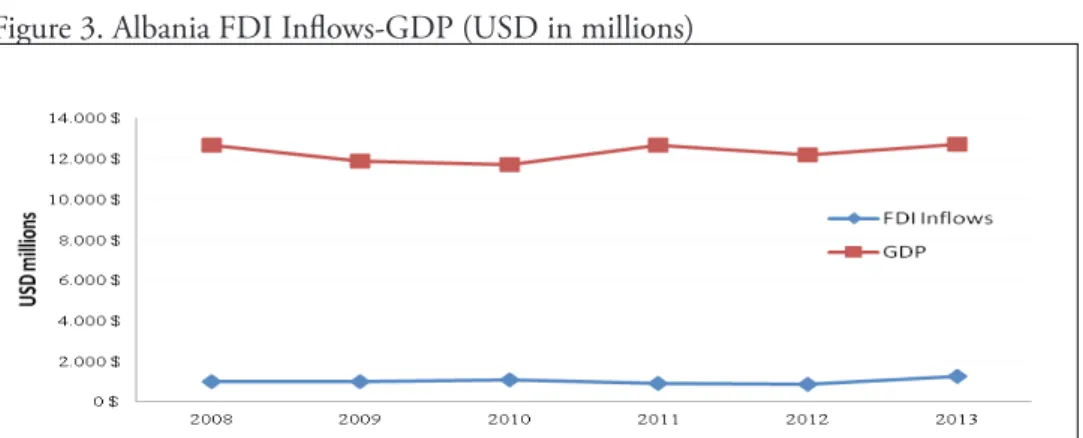
According to the analyses conducted in this study, FDI effectiveness is measured through its effects on Gross Domestic Product (GDP) growth in the host countries. Therefore, in order to create an insight for the matter it would be helpful to compare the FDI inflows to countries in the sample with their GDP performances in the given period. In this direction FDI inflows and GDP performances of the countries in sample is given in Figure-3, Figure-4, Figure-5, Figure-6 and Figure-7 for Albania, Bosnia and Herzegovina, Montenegro, Serbia and Macedonia respectively. At the first glance, one can observe that all countries in the sample has been affected from the 2007-2008 crisis
and 2011 recession experienced by the globe (International Monetary Fund, 2014). Figure 3. Albania FDI Inflows-GDP (USD in millions)
Source: International Monetary Fund (2014), United Nations Conference on Trade and Development (2015)
For the period 2008-2013 Albanian FDI inflows could only exceed 1 billion USD benchmark only in 2010 and in 2013. Her GDP on the other shows a steady movement around the 12 billion USD band. Even though the linear relationship between FDI inflows and GDP figures is not clearly visible at first sight, FDI inflow percentage in Albanian GDP is around 8 to 10 percent in the period (International Monetary Fund, 2014; United Nations Conference on Trade and Development, 2015).
Figure 4. Bosnia Herzegovina FDI Inflows-GDP (USD in millions)
Source: International Monetary Fund (2014), United Nations Conference on Trade and Development (2015)
Bosnia and Herzegovinian FDI inflows saw a sharp decline following 2007-2008 global crises, and showing no signs of improvement as of 2013. However, Bosnia and Herzegovinian GDP performance seems to be stable around 17-18 billion USD band
and displaying little evidence for a linear relationship between FDI inflows and GDP numbers (International Monetary Fund, 2014; United Nations Conference on Trade and Development, 2015).
Figure 5. Montenegro FDI Inflows-GDP (USD in millions)
Source: International Monetary Fund (2014), United Nations Conference on Trade and Development (2015)
For Montenegro the only year FDI inflows was able to exceed 1 billion USD level was 2009. The GDP performance for Montenegro was around 4-4.5 billion USD, which is the main reason behind high FDI inflow percentage in GDP in Montenegro. Although the FDI inflow percentage in Montenegro’s GDP is quite high, the linear relationship between them seems to be in opposite direction for many years in the period (International Monetary Fund, 2014; United Nations Conference on Trade and Development, 2015).
Figure 6. Serbia FDI Inflows-GDP (USD in millions)
Source: International Monetary Fund (2014), United Nations Conference on Trade and Development (2015)
The linear relationship between FDI inflows and GDP figures for Serbia is more viable then the first three countries in the sample. At each year FDIs and GDP figures move in the same direction. However, it is observable that Serbian FDI inflows took serious hits along the way. While Serbian FDI inflows were around 3.5 billion USD in 2008, it saw nearly 1.4 billion USD in 2013. Serbia’s latest GDP was around 42.5 billion USD in 2013 which was still roughly 5 billion USD short of Serbian GDP in 2008 (International Monetary Fund, 2014; United Nations Conference on Trade and Development, 2015).
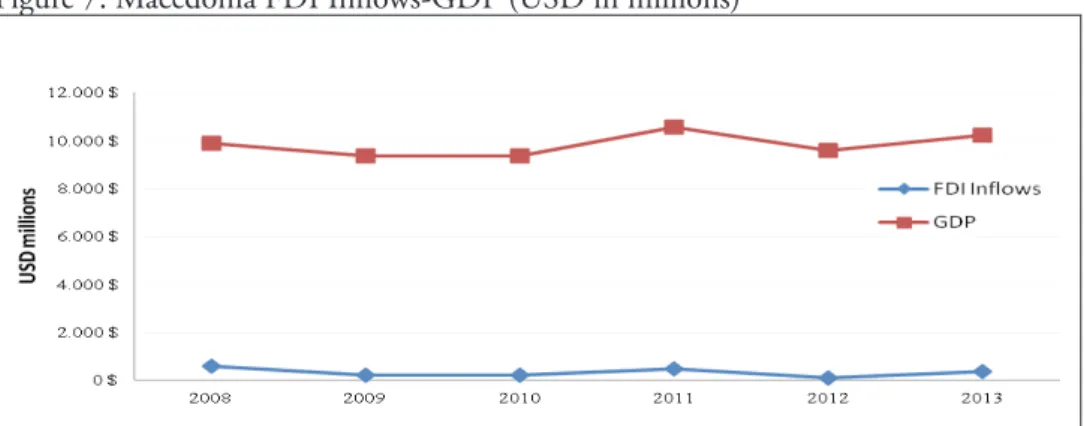
Figure 7. Macedonia FDI Inflows-GDP (USD in millions)
Source: International Monetary Fund (2014), United Nations Conference on Trade and Development (2015)
Despite the fact that Macedonia has the last place in the FDI attractiveness list of the sample, the relationship between FDI and GDP is most clearly observable in Macedonia among all countries in the group. Like Serbia, the two variables move in the same direction at each year for Macedonia. Macedonian FDI inflows were around 316 million USD on average for the period and her GDP was around 9.8 billion USD on average for the period (International Monetary Fund, 2014; United Nations Conference on Trade and Development, 2015).
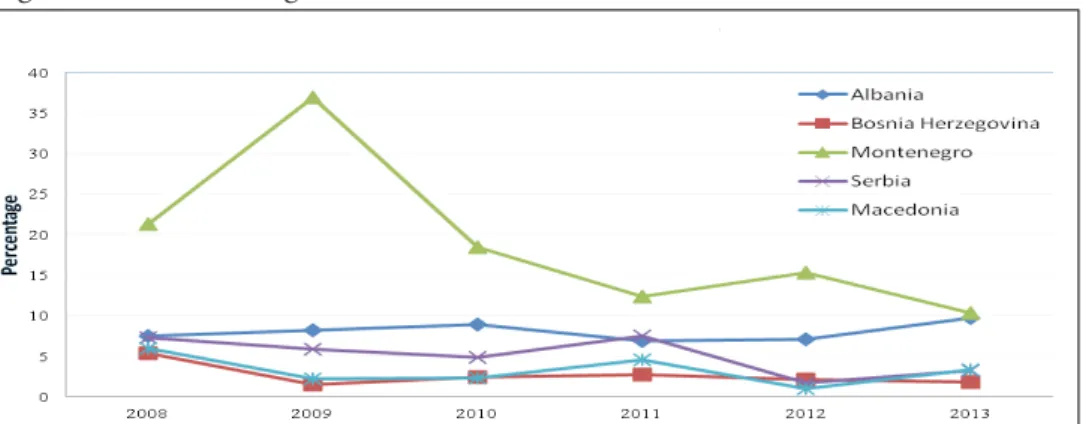
Furthermore, FDI inflow percentage in GDP figures of the host countries is also an important indicator to show the relative magnitude of FDIs in those countries. FDI inflow percentages in GDP Figures for the 5 countries are given below in Figure-8 for the study period (United Nations Conference on Trade and Development, 2015).
Figure 8. FDI Percentage in GDP
Source: United Nations Conference on Trade and Development (2015) To what Extent can FDIs Promote Economic Growth in the Balkans?
Gorgulu and Akcay (2012) state that in the broadest sense, the absorptive capacity of a country is composed of the appropriate regulations and the quality of administrative and economical structure existing in that country. Countries that have sound administrative structure and orderly solid markets have high absorptive capacities and thus are able to benefit as much as possible from the FDIs. Countries that lack such sound administrative and financial structures however are not able to extract such positive effects from the FDIs (Alfaro et al., 2004; Alfaro et al., 2006).
In the FDI-absorptive capacities literature, absorptive capacities are measured in various ways. Blomstrom, Lipsey and Zejan (1994) focus on the technology gap as an absorptive capacity indicator and Li and Lui (2005) measured the technology gap as the ratio of the gap between US GDP and host country GDP relative to host country GDP. Lu and Lui also measured years of schooling as a proxy for absorptive capacity (Li and Lui, 2005) along with Borensztein, Gregorio and Lee (1998), thus aiming at revealing the role of human development in absorptive capacities. Financial development is also another strong indicator for absorptive capacities. Durham (2004) uses total stock market capital formation relative to GDP as a financial development measure of absorptive capacity. Credit market lending capacity to the private sector is another proxy for financial development in terms of absorptive capacity (Hermes and Lensink, 2003). Durham (2004) also uses several indexes covering regulation of business property rights and corruption to indicate institutional development as part of the absorptive capacity (Krogstrup and Matar, 2005).
In this study, absorptive capacities of the host countries are measured by a new method that is a combination of the well accepted techniques existent in the literature. Accordingly, in order to measure the absorptive capacities of the host countries first the technology gap has been found as did Li and Lui (2005) through a ratio of difference of GDPs among US -given their technological advancement- and host countries to
host country GDPs (International Monetary Fund, 2014). And since the technology gap would be affecting the growth performances in the host countries, the gap figures were multiplied by -1. Then for each country and for each year within the period an average of Human Development Index (United Nations Development Programme, 2015) values, gross capital formation values as percentage of GDP (The World Bank, 2015) and domestic credit to private sector values as percentage of GDP (The World Bank, 2015) were taken and subtracted from 1 to multiply with the gap values in order to assure that a high average would diminish the technology gap’s negative effects on growth. Theoretically with a perfect score -average of 1, it is even possible to offset the technology gap’s negative effects on growth - since the gap value would be multiplied by 0 in this case. Thus, as the absorptive capacity value gets closer to 0, host countries perform better because they would become more able to eliminate the effects of technology gap. By doing so, technology gap, human capital development and financial development aspects of absorptive capacity concept are all captured in the analyses.
Moreover, in this study a simple empirical regression model is employed and the analyses are conducted separately for each country in the sample. Accordingly the empirical model to be used in OLS regression is as follows:
Yit- Yit-1 = α + θ(Yit-1) + β(FDIit) + δ(ACit)+ εi (1)
In the empirical model, Yit - Yit-1 is specified as the dependent variable, where Yit is the value of per capita GDP (International Monetary Fund, 2014) in current US Dollars. Using current dollars in the model enables inflation to be included in the model as part of economic growth and indirectly of financial development. Taking the differences in per capita GDP figures between consecutive years is to exhibit the growth in per capita GDP from year to year. Moreover, while Yit-1 indicates the value of per capita GDP of the previous year (International Monetary Fund, 2014), FDIit represents annual per capita FDI inflows (United Nations Conference on Trade and Development, 2015), and ACit refers to the absorptive capacities of the host countries where the measure is obtained through a series of calculations explained above (International Monetary Fund, 2014; United Nations Development Programme, 2015; The World Bank, 2015). The usage of per capita values is to measure the standard of living. Unlike per capita GDP, growth of GDP is not a measure for standard of living.
When the results of the applied analyses to the sample are taken into consideration, it is observed that all models exhibit statistical significance. Moreover, while the results fail to confirm growth enhancing effects of FDIs, they also confirm negative effects of previous years’ per capita GDP for all countries in the sample.
According to the results of the analyses applied to Albania, it is revealed that Albanian per capita GDP growth performance is negatively affected by both previous years’ per capita GDP and by the lack of a necessary absorptive capacity level in the country. Thus, due to the absence of a necessary absorptive capacity level, FDIs in Albania have no effect on economic growth and the low level of absorptive capacity in the country
In Bosnia and Herzegovina, the results cannot confirm the significance of absorptive capacity in the country at 95% confidence interval. However, at 90% confidence interval it is possible to say that the absorptive capacity level in Bosnia and Herzegovina negatively effects per capita GDP growth. Further, FDIs in Bosnia and Herzegovina have also failed to exhibit any growth promoting effects. Previous year’s per capita GDP also negatively effects the economic growth in Bosnia and Herzegovina.
Like the first two countries, Macedonian economic growth also suffers from previous years’ per capita GDP. Moreover, the results fail to confirm statistical significance for Macedonian absorptive capacity at 95% confidence interval but it is still possible to make some significant comments about the absorptive capacity at 90% confidence interval. Accordingly, it is observed that Macedonia lacks the necessary level of absorptive capacity, and due to this reason, FDIs in Macedonia have no significant effect on economic growth and the economic growth in Macedonia suffers from the level of absorptive capacity in the country.
In the analysis applied to Montenegro, is has been found out that every variable has a statistical significance. Like others, Montenegro is also negatively affected by previous years’ per capita GDP. It has also been found that, there is a negative effect of the local absorptive capacity level in the country on economic growth, and lack of necessary level of absorptive capacity causes FDIs in Montenegro to have a negative effect on per capita economic growth.
The picture is not so much different for Serbia. The results reveal that, the absorptive capacity level in the country is far below the necessary level. That’s why while the absorptive capacity in Serbia has a negative role on economic growth, FDIs have no significant effect. Like the rest of the sample Serbian economic growth suffers from previous years’ per capita GDP as well.
Conclusion
Through careful evaluation of the results, it is now possible to have an idea about the FDI effects on economic growth from an absorptive capacity perspective. Accordingly for the non-EU member transition economies in the Balkans, for the 2002-2013 period, it is safe to say that they all lack the necessary level of absorptive capacity which would enable them to reap benefits of foreign investments. Given the economical and historical background of the region these results are actually quite normal and are expected. Especially, due to the shifted priorities in the turmoil and transition periods, attracting FDIs or improving infrastructures did not lose importance, therefore domestic –including government investments- nor foreign investments have been made in desired levels. Thus, in a dual way not much could be done in the name of economic development for those countries in the turmoil and transition periods. Gorgulu and Akcay (2012) suggest, absorptive capacities in host countries below a certain level could even be harmful for economic growth and may undermine the growth enhancing effects of FDIs. While the former case is true for all countries in the
sample, the latter case is only true for Montenegro in this study. Therefore with a limited level of absorptive capacity, putting efforts to attract FDIs might not work for the best. The alternative policy should include rather absorptive capacity creating actions and less FDI attractive initiatives followed by increased domestic investments. Finally, the results confirm that current foreign direct investment flows to those countries are not able to work miracles given the absorptive capacities of the host countries.
References
Alam, A., Casero, P. A., Khan, F., & Udomsaph, C. (2008). Unleashing Prosperity: Productivity Growth in Eastern Europe and the Former Soviet Union. World Bank, Washington, DC. Retrieved from http://siteresources.worldbank.org/ECAEXT/ Resources/ publications/UnleashingProsperity.pdf
Alfaro, L., Chanda, A., Kalemli-Ozcan, S., & Sayek, S. (2004). FDI and Economic Growth: The Role of Local Financial Markets. Journal of International Economics, 64(1), 89-112.
Alfaro, L., Chanda, A., Kalemli-Ozcan, S., & Sayek, S. (2006). How Does Foreign Direct Investment Promote Economic Growth? Exploring the Effects of Financial Markets on Linkages, National Bureau of Economic Research Working Paper No. 12522, Cambridge.
Blomstrom, M., Lipsey, R. E., & Zejan, M. (1994). “What Explains the Growth of Developing Countries?” In Baumol, Nelson, and Wolff, (Ed.), Convergence of Productivity: Cross-National Studies and Historical Evidence (pp. 243-59). Oxford and New York: Oxford University Press.
Borensztein, E., Gregorio, J. D., & Lee, J. W. (1998). How Does Foreign Direct Investment Affect Economic Growth? Journal of International Economics,45(1), 115-135.
Cohen, W. M., & Levinthal, D. A. (1989). Innovation and Learning: The Two Faces of R&D. Economic Journal, 99(397), 569-596.
Cohen, W. M., & Levinthal, D. A. (1990). Absorptive Capacity: A New Perspective on Learning and Innovation. Administrative Science Quarterly,35(1), 128-152.
Durham, J. B. (2004). Absorptive Capacity and the Effects of Foreign Direct Investment and Equity Foreign Portfolio Investment of Economic Growth. European Economic Review, 48(2), 285-306.
Gorgulu, M. E., & Akcay, S. (2012). The Effects of Foreign Direct Investments on Economic Growth of Developing Countries: Panel Data Analysis (Doctoral dissertation). AfyonKocatepe University, The Institute of Social Sciences, Department of Economics.
Hermes, N., & Lensink, R. (2003). Foreign Direct Investment, Financial Development and Economic Growth. Journal of Development Studies, 40(1), 142-63.
International Monetary Fund (IMF), (2000). Transition Economies: An IMF Perspective on Progress and Prospects. Issues Briefs List 2000. Retrieved from https:// www.imf.org/external/ np/exr/Ib/2000/110300.htm.
International Monetary Fund (IMF), (2014). World Economic and Financial Surveys, World Economic Outlook. Retrieved from https://www.imf.org/external/pubs/ft/ weo/2014/02/ weodata/index.aspx.
Krogstrup, S., & Matar, L. (2005). Foreign Direct Investment, Absorptive Capacity and Growth in the Arab World. HEI Working Paper, No: 02/2005.
Li, X., & Liu, X. (2005). Foreign Direct Investment and Economic Growth: An Increasingly Endogenous Relationship. World Development, 33(3), 393-407.
Rettman, A. (2013). Kosovo: EU meeting is ‘de facto recognition’ by Serbia. Retrieved from https://euobserver.com/foreign/118965.
Sun, X. (2002). Foreign Direct Investment and Economic Development: What Do the States Need To Do? Capacity Development Workshops and Global Forum on Reinventing Government on Globalization, Role of the State and Enabling Environment, Morocco.
The World Bank, (2002). Transition the First Ten Years Analysis and Lessons for Eastern Europe and the Former Soviet Union. Retrieved from http://siteresources.worldbank. org/ ECAEXT/Resources/complete.pdf
The World Bank, (2010). Kosovo Unlocking Growth Potential: Strategies, Policies, Actions. Retrieved from https://openknowledge.worldbank.org/handle/10986/2859.
The World Bank, (2015). 2015 World Development Indicators. Retrieved from http:// wdi.worldbank.org/tables.
United Nations Conference on Trade and Development (UNCTAD), (2015). UNCTADstat 2015. Retrieved from http://unctadstat.unctad.org/EN/.
United Nations Development Programme (UNDP), (2015). Human Development Index Human Development Report. Retrieved from http://hdr.undp.org/en/data.
Appendix
Table 4: Summary of the Results (Albania) Dependent Variable: GROWTH
Method: Least Squares Sample: 2002 2013 Included observations: 12
Variable Coefficient Std. Error t-Statistic Prob.
C 3355.801 686.4788 4.888426 0.0012
GDP_1 -0.696708 0.158056 -4.407982 0.0023
FDI 1.976197 1.094186 1.806089 0.1085
AC 1.475628 0.385895 3.823911 0.0051
R-squared 0.748208 Mean dependent var 269.9454 Adjusted R-squared 0.653786 S.D. dependent var 294.2793 S.E. of regression 173.1538 Akaike info criterion 13.40744 Sum squared resid 239857.9 Schwarz criterion 13.56907 Log likelihood -76.44463 Hannan-Quinn criter. 13.34760 F-statistic 7.924086 Durbin-Watson stat 1.808639 Prob(F-statistic) 0.008837
Table 5: Summary of the Results (Bosnia) Dependent Variable: GROWTH
Method: Least Squares
Sample: 2002 2013; Included observations: 12
Variable Coefficient Std. Error t-Statistic Prob.
C 2874.913 1400.197 2.053221 0.0741
GDP_1 -0.437312 0.178667 -2.447640 0.0401
FDI 0.998817 0.895088 1.115887 0.2969
AC 2.253342 1.261986 1.785552 0.0920
R-squared 0.717600 Mean dependent var 258.0870 Adjusted R-squared 0.611699 S.D. dependent var 380.4680 S.E. of regression 237.0839 Akaike info criterion 14.03591
Sum squared resid 449670.3 Schwarz criterion 14.19754 Log likelihood -80.21544 Hannan-Quinn criter. 13.97606 F-statistic 6.776190 Durbin-Watson stat 2.552401 Prob(F-statistic) 0.013765
Table 6: Summary of the Results (Macedonia) Dependent Variable: GROWTH
Method: Least Squares Sample: 2002 2013 Included observations: 12
Variable Coefficient Std. Error t-Statistic Prob.
C 3566.408 1785.416 1.997522 0.0808
GDP_1 -0.552927 0.223725 -2.471461 0.0386
FDI 1.690506 1.024240 1.650497 0.1374
AC 1.442220 0.799290 1.804378 0.0988
R-squared 0.835806 Mean dependent var 268.9065 Adjusted R-squared 0.774233 S.D. dependent var 390.7980 S.E. of regression 185.6873 Akaike info criterion 13.54721 Sum squared resid 275838.1 Schwarz criterion 13.70884 Log likelihood -77.28324 Hannan-Quinn criter. 13.48736 F-statistic 13.57430 Durbin-Watson stat 2.432775 Prob(F-statistic) 0.001667
Table 7: Summary of the Results (Montenegro) Dependent Variable: GROWTH
Method: Least Squares Sample: 2002 2013 Included observations: 12
Variable Coefficient Std. Error t-Statistic Prob.
C 7386.888 1118.284 6.605559 0.0002
GDP_1 -0.737282 0.108782 -6.777624 0.0001
FDI -0.426353 0.160770 -2.651938 0.0292
R-squared 0.855874 Mean dependent var 435.4529 Adjusted R-squared 0.801827 S.D. dependent var 696.3218 S.E. of regression 309.9791 Akaike info criterion 14.57209 Sum squared resid 768696.2 Schwarz criterion 14.73372 Log likelihood -83.43253 Hannan-Quinn criter. 14.51224 F-statistic 15.83567 Durbin-Watson stat 2.135300 Prob(F-statistic) 0.000999
Table 8: Summary of the Results (Serbia) Dependent Variable: GROWTH
Method: Least Squares Sample: 2002 2013 Included observations: 12
Variable Coefficient Std. Error t-Statistic Prob.
C 5889.557 2353.646 2.502312 0.0368
GDP_1 -0.722952 0.211956 -3.410850 0.0092
FDI 0.826728 1.319589 0.626504 0.5484
AC 10.53483 4.846226 2.173821 0.0315
R-squared 0.733578 Mean dependent var 364.8333 Adjusted R-squared 0.633670 S.D. dependent var 739.0579 S.E. of regression 447.3163 Akaike info criterion 15.30561 Sum squared resid 1600735. Schwarz criterion 15.46725 Log likelihood -87.83366 Hannan-Quinn criter. 15.24577 F-statistic 7.342523 Durbin-Watson stat 1.525363 Prob(F-statistic) 0.010994
i According to Gorgulu and Akcay (2012); in the most general sense, absorptive capacity is described as the ability of countries to absorb and utilize every kind of knowledge and innovation (Alfaro, Chanda, Kalemli-Ozcan, and Sayek FDIs have positive effects on the growth of the host countries in direct proportion to the quality of the financial markets of these countries. The absorptive capacities have an important role in the process of information acquisition in production through technological knowledge spillover effects from foreign investments (Gorgulu and Akcay, 2012).
ii Namely; Albania, Bosnia and Herzegovina, Montenegro, Serbia and Macedonia.
data for Kosovo, but her data is included in that of Serbia’s.
iv 1991-2001, The turmoil in the region first began with the Slovenian and Croatian Wars and followed by the Bosnian War, which ended in 1995. The turmoil then carried out by the Kosovo War in 1998-1999 and the insurgency in Macedonia in 2001.
v For the period of 1992-2006 Serbia and Montenegro was united as a union. Then starting from 2006, Serbia and Montenegro formed their own separate independent republics. The FDI data on UNCTAD (2015) covers Serbia and Montenegro as a union till 2007, and as separate republics starting from 2008. However, The World Bank (2015) and International Monetary Fund (2014) both use a proportional measure to cover the data from Serbia and Montenegro separately. Using a similar proportional measure FDI data was obtained in the paper for missing years.