Mammogram Diagnostics via 2-D Complex
Wavelet-based Self-similarity Measures
Seonghye Jeon
Depertment of Industrial and Systems Engineeroing, Georgia Institute of Technology, US
Orietta Nicolis
Instituto de Estadistica, Universidad de Valparaiso, Chile Brani Vidakovic
Depertment of Industrial and Systems Engineeroing, Georgia Institute of Technology, US
Abstract. Breast cancer is the second leading cause of death in women in the United States. Mammography is currently the most effective method for detecting breast cancer early; however, radiological inter-pretation of mammogram images is a challenging task. Many medical images demonstrate a certain degree of self-similarity over a range of scales. This scaling can help us to describe and classify mammograms. In this work, we generalize the scale-mixing wavelet spectra to the complex wavelet domain. In this domain, we estimate Hurst parameter and image phase and use them as discriminatory descriptors to clas-sify mammographic images to benign and malignant. The proposed methodology is tested on a set of images from the University of South Florida Digital Database for Screening Mammography (DDSM). Keywords: Scaling; Complex Wavelets; Self-similarity; 2-D Wavelet Scale-Mixing Spectra
1. Introduction
The National Cancer Institute estimates that 1 in 8 women born today will be diagnosed with breast cancer during her lifetime (Altekruse et al., 2010). Breast cancer is one of the most common forms of cancer among women in the United States, second only to non-melanoma skin cancer. A national objective has been set by the U.S Department of Health and Human Services to reduce the female breast cancer death rate from 22.9
per 100,000 females in 2007 down to 20.6 by the year 2020 – a 10% im-provement (Healthy People 2020, U.S. Department of Health and Human Services). One of the most important efforts toward that goal is advancing the precision of screening technologies. Early detection is the best method for improving prognosis and also leads to less invasive options for both specific diagnosis and treatment.
Mammography is currently the most efficient and prevalent method for detecting a breast cancer early, before the disease becomes symptomatic. However, the radiological interpretation of mammogram images is a diffi-cult task since the appearance of even normal tissue is highly variable and complex, and signs of early disease are often minute or indistinct. Reading a mammogram image is a skill that physicians develop over time, and con-fidently stating whether findings are cancerous or not is quite difficult and often subjective. Suspicious findings are commonly clarified by follow-up images, ultrasound, or MRI. On the other hand, it has been estimated that 10−30% of cancers which could have been detected are missed (Oestre-icheret al., 2005). Thus, improving both the specificity and the sensitivity of mammographic diagnoses is an important goal in improving prognoses while also reducing the number of unnecessary procedures or surgical op-erations.
In high frequency and irregular data collected in real-life settings (both naturally occurring and human-made), a commonly occurring phenomenon is that of regular scaling. Examples of this have been found in a variety of systems and processes including economics (stock market, exchange rate fluctuations), telecommunications (internet data), physics (hydrology, tur-bulence), geosciences (wind and rainfall patterns), and several applications in biology and medicine (DNA sequences, heart rate variability, auditory nerve-spike trains). The irregular behavior of these complex structures is difficult or impossible to quantify by standard modeling techniques; but when observations are inspected at different scales, there is in fact a regu-lar relationship between the behavior at each scale. This phenomenon has been demonstrated in many medical images, leading to its diagnostic use as a tool capable of quantifying statistical similarity of data patterns at various scales.
The standard measure of regular scaling is the Hurst exponent. This measure can also be connected to the presence of long memory and fractal-ity in signals and images and is viewed as an informative summary. Many techniques for estimating the Hurst exponent exist, and assessing the ac-curacy of these estimations can be complicated. Wavelet transforms are powerful tool in estimating the Hurst exponent and modeling statistical similarity at different scales. For example, Nicolis et al. (2011) proposed a
method based on the wavelet spectra for extracting the self-similarity mea-sures in an isotropic and anisotropic spaces. Ram´ırez-Cobo et al. (2011) demonstrated a wavelet-based spectra method for estimating Hurst expo-nent in time-varying two-dimensional rainfall maps.
For an efficient representation of an image or signal, the wavelet basis is desirable to be orthogonal, symmetric and to have compact support. (Gao and Yan, 2010). An orthogonal basis has a variety of theoretical and practical advantages: it leads to more efficient algorithms, and estab-lishing properties of a representation is often easier with orthogonal bases. Most importantly, orthogonal bases preserve the variances, a property crit-ical for the coherent definition of wavelet spectra. Symmetry guarantees an orientation-free representation of features, preventing distortion in the transformed domains. Moreover, the computational cost of performing wavelet transforms depends heavily on the support size of a basis. Apart from the Haar wavelet, complex wavelets with an odd number of vanish-ing moments are only compactly supported wavelets which are symmetric (Lawton, 1993). Due to this advantages, complex wavelet has been used in various areas including motion estimation (Magarey and Kingsbury, 1998), texture image modeling (Portilla and Simoncelli, 2000), image denoising (Achim and Kuruoglu, 2005) and NMR spectra classification (Kim et al., 2008). However, to the best of our knowledge, there is no literature that investigates self-similarity measures based on the complex wavelet spectra. The novelty of this paper is to use the scale-mixing wavelet spectra based on complex wavelet transforms for estimating the Hurst exponent. We fo-cus on the estimated Hurst exponent and show its ability to differentiate cancerous from normal tissue visible in the backgrounds of mammogram images, and compare this performance with its counterpart obtained from real-valued wavelet transform. Moreover, complex wavelet transforms pro-duce an additional measure, the phase information. We also demonstrate the classification power of the phase information and use it as an additional modality in the discriminatory analysis.
A further novelty of our work is the use of the information contained in the background tissue of images. Most of the references found in literature dealing with breast cancer detection methods are based on microcalcifica-tions (Wang and Karayiannis, 1998; Netsch and Peitgen, 1999; Kestener
et al., 2001; El-Naqaet al., 2002). Only recently the information contained in the background is taken into consideration (Nicoliset al., 2011; Hamilton
et al., 2011). This classifying measure based on the irregularity measure of background tissue promises to be a new tool to be used in combination with existing clinical diagnostic tools, thus improving discriminatory power of non-invasive diagnostic techniques.
The paper is organized as follows. In Section 2, we briefly describe the data set used in the analysis. In Section 3, the complex wavelet based scale-mixing wavelet spectra is proposed as new tools for estimating the self-similarity indices. Also the importance of the phase information is discussed. Section 4 deals with the classification of mammogram images using the wavelet descriptors obtained from Section 3 as classifiers. Finally Section 5 contains discussion and some concluding remarks.
2. The Dataset
The collection of digitized mammograms we analyzed was obtained from the University of South Florida’s Digital Database for Screening Mammog-raphy (DDSM)
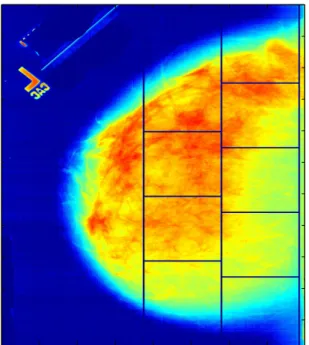
http://marathon.csee.usf.edu/Mammography/Database.html. The DDSM is described in detail in Heath et al. (2000). Images from this database containing suspicious areas are accompanied by pixel-level “ground truth” information relating locations of suspicious regions to what was assessed and verified through biopsy. We selected 45 normal (benign) cases and 79 cancer (malignant) cases scanned on the HOWTEK scanner at the full 43.5 micron per pixel spatial resolution. Each case contains four mammograms (two for each breast: the craniocaudal (CC) and mediolateral oblique (MLO) projections) from a screening exam. We considered only the CC projections, using either side of the breast image. Five sub-images of size 1024×1024 was taken from each case for analysis. An example of mammogram image and the location of sub-images is provided in Fig. 1. For the classification purpose, we only used one of the five sub-images from each mammogram.
3. Discrete complex wavelets
This section discusses discrete complex wavelet transforms. Unlike the popular method used in this context (Selesnick et al., 2005), the proposed method is unitary (complex orthogonal) and minimal.
3.1. Complex wavelet basis. The construction of the complex wavelet
basis associated with multiresolution analysis follows the usual approach proposed by Mallat (1998) and Daubechies (1992). Details on the construc-tion and properties of complex wavelets can be found in Lawton (1993), Lina and Mayrand (1995), Strang and Nguyen (1996), and Zhang et al.
500 1000 1500 2000 2500 3000 3500 500 1000 1500 2000 2500 3000 3500 4000 4500 5000
Figure 1. An example of mammogram image with five sub-images of size 1024×1024 considered for the analysis.
(1999). In analogy to the real case, the wavelet function ψ(x) for the com-plex wavelet is given by
ψ(x) = √1 2
X
k
(−1)k2h∗1−kφ(2x−k) (1)
where φis the scaling function, h is the low pass filter and the∗ indicates the complex conjugate. The representation of wavelets in 2D can be done through the tensor product of univariate scaling functions and wavelets as follows:
φ(x, y) = φ(x)·φ(y)
ψh(x, y) = φ(x)·ψ(y)
ψv(x, y) = ψ(x)·φ(y) (2)
ψd(x, y) = ψ(x)·ψ(y)
where symbolsh, v, din (2) stand for horizontal, vertical and diagonal direc-tions, respectively. The atoms capture image features in the corresponding directions.
3.2. The complex scale-mixing 2-D wavelet transform. The dis-crete complex wavelet transform (DCWT) can be considered as a complex-valued extension of the standard discrete wavelet transform (DWT). It uses complex-valued filtering (analytic filter) for transforming the real/complex signals. Complex wavelet coefficients can be computed by Mallat’s algo-rithm (Mallat, 1998; Morettin, 1997)
cj−1,l = X k h∗k−2lcj,k (3) and dj−1,l = X k g∗k−2lcj,k (4)
whereh is as in (1) andg is the quadrature mirror filter. The∗ denotes the complex conjugate.
Conversely, the reconstruction is given by
cj,k = X l cj−1,lhk−2l+ X l dj−1,lgk−2l. (5)
Moreover, the real and imaginary coefficients are used to compute the mod-ulus and phase information. The wavelet coefficients can be written as
dj,k =Re(dj,k) +i·Im(dj,k) with magnitude |dj,k|= q Re(dj,k)2+Im(dj,k)2 and phase ∠dj,k = arctan Im(dj,k) Re(dj,k) when |Re(dj,k)|>0.
There are many versions of the 2-D wavelet transforms which lead to different tessellations, or tilings (Ram´ırez-Coboet al., 2011). Here we define the complex wavelet atoms as follows
φ(j1,j2),k(x) = 2(j1+j2)/2 φ(2j1x−k1,2j2y−k2) (6)
whereδ is one of directionsh,v, ord,and (j1, j2)∈Z2. Then, any function f ∈ L2(R2) can be represented as f(x) = X k c(J0,J0),k φ(J0,J0),k(x) + X j>J0 X k d(J0,j),k ψh,(J0,j),k(x) + X j>J0 X k d(j,J0),k ψv,(j,J0),k(x) + X j1,j2>J0 X k d(j1,j2),kψd,(j1,j2),k(x),
and a 2-D wavelet transform, which we call thescale-mixing wavelet trans-form is obtained. The motivation for the name scale-mixing is obvious. Unlike the atoms in the traditional 2-D wavelet transform, the scale-mixing atoms mix the scale indices thus capturing the “energy flux” between the scales.
The scale-mixing detail coefficients are defined as
d(J0,j),k = 2(J0+j)/2 Z f(x) ψh∗(2J0x−k1,2jy−k2) dx dy, d(j,J0),k = 2(j+J0)/2 Z f(x) ψv∗(2jx−k1,2J0y−k2) dx dy, d(j1,j2),k = 2(j1+j2)/2 Z f(x)ψd∗(2j1x−k1,2j2y−k2) dx dy, (8)
whereψ∗ is a complex conjugate ofψ. Note that (j1, j2) in (6) and (7) can
be indexed as (j1, j1+s) withs∈Z.
Similar to the traditional one- and two-dimensional cases, the complex scale-mixing detail coefficients are linked to the original image (2-D signal) through a matrix equation. Suppose that a 2n×2n image (matrix) A is to be transformed into the wavelet domain. The complex wavelet matrix
W is first composed by the complex scaling and wavelet filter coefficients
hk and gk as in Vidakovic (1999). Note that the wavelet filter is given by
gk = (−1)kh∗1+N−k and N is a shift parameter which affects the location
of the wavelet. Then the rows of A are transformed by a one-dimensional transform given by the wavelet matrix W, resulting in W A†. The same is repeated on the rows ofW A†. The result is
B =W(W A†)†=W AW†, (9)
the scale-mixing wavelet transform of matrixA, which will be the basis for defining the scale-mixing spectra. Here C† denotes Hermitian transpose
50 100 150 200 250 50 100 150 200 250 50 100 150 200 250 50 100 150 200 250 (a) (b)
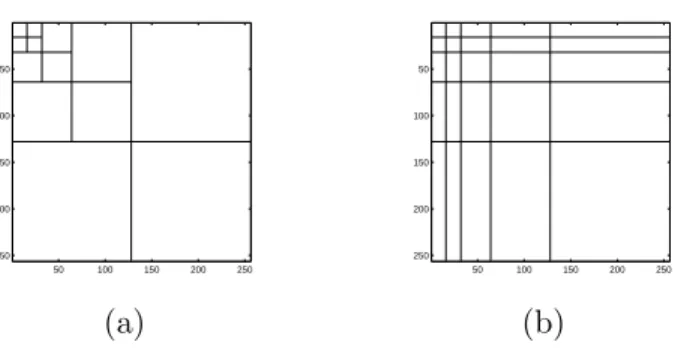
Figure 2. Tessellations for 2-D wavelet transforms. (a)
Traditional 2-D transform of depth 4; (b) Scale-mixing wavelet transform of depth 4.
of a complex matrix C. The representation in (9) is a finite-dimensional implementation of (8) for signalf(x) sampled in a matrix form.
The tessellation induced by transform in (9) is shown in Figure 2 (b). A more general transform can be obtained as an iterative repetition of the transform in (9) with depth k, applied only on the “smooth part” of the previous iterative step. This general approach unifies the traditional and scale-mixing 2-D wavelet transforms.
The scale-mixing 2-D transform is operationally appealing. Constructing appropriateW is computationally fast and, sinceW is unitary, the inverse transform is straightforward:
A=W†BW.
By inspecting the tessellation in Figure 2, several hierarchies of detail spaces can be identified. The diagonal hierarchy interfaces coefficients with the same component scales and coincides with the diagonal hierarchy in the traditional 2-D spectra. One level above and below the diagonal hierarchy are hierarchies of detail spaces that interface the scales that differ by 1. For the hierarchy above the diagonal, the scales alongx-direction are interfaced by the next coarser scale along y-direction. For the hierarchy below the diagonal, the roles ofx and y are interchanged.
The unitarity ofW implies
trace(AA†) = trace(BB†)
forB =W AW†,implying the total energy in the image A E= trace(AA†)
50 100 150 150 200 250 50 100 150 200 250
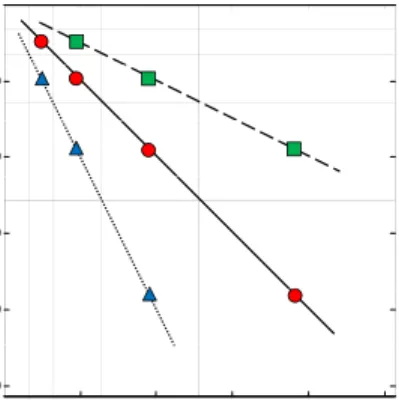
Figure 3. (a) Three detail-space hierarchies generating the
scale-mixing 2-D transform, where (j1, j2) is indexed as
(j, j +s), s ∈ Z. Circles correspond to s = 0, triangles tos= 1, and squares to s=−1. The scales (j0, j), j0 = 7
(squares), and (j, j0), j0 = 6 (triangles) are shown in the
figure.
3.3. The complex scale-mixing wavelet spectra. The scale-mixing
spectra is defined in terms of the complex scale-mixing coefficients in (8)
S(j) = log2E |d(j,j+s),k|2
, (10)
wherej, s∈Zare fixed. Note thats= 0 in (10) corresponds to the diagonal 2-D spectra.
To calibrate the scale-mixing spectra, consider now a 2-D fractional Brownian motion, BH(u).For such a process, the scale-mixing detail
coef-ficients are given by
d(j,j+s);k= 2j+ s 2 Z BH(u)ψ∗ 2ju1−k1,2j+su2−k2 du. (11)
whereψ∗ denotes the complex conjugate ofψd, the wavelet atom in the diagonal direction defined in (7). These coefficients are random variables with zero mean and variance (Heneghan et al., 1996), which leads to
E|d(j,j+s);k|2 = 22j+s Z ψ 2ju1−k1,2j+su2−k2 ×ψ∗ 2jv1−k1,2j+sv2−k2 E[BH(u)BH(v)]du dv. (12)
As in Veitch and Abry (1999), it is assumed here that the coefficients within and across the scales are uncorrelated.
From (12), it can be shown that
E|d(j,j+s);k|2
= 2−j(2H+2) Vψ,s(H), (13)
where Vψ,s(H) is an expression depending on ψ, H and s, but not on the
scalej, Vψ,s(H) =− σH2 2 Z Z ψ(p+q)ψ∗(q) |ps|2H2−s dp dq. (14)
A proof of (13) is provided in the Appendix. By taking logarithms in (13) log2E|d(j,j+s);k|2
=−(2H+ 2)j+ log2Vψ,s(H) (15)
forj ∈Z, the Hurst exponent can be estimated from the slope of the linear equation (15). Finally, the empirical counterpart of (15) is a regression defined on pairs j,log2 1 n X j,j+s d(j,j+s),k 2 , j, s∈Z. (16)
The slope of the regression would estimate the Hurst exponent, i.e., H =
−(slope+ 2)/2. Instead of the sample mean in (16), different location
measures could be used, such as the median.
Although (16) is traditionally fitted by the ordinary least squares (OLS) regression, the level-wise variance of wavelet coefficients is not constant. Therefore one can improve the estimator by using more robust approach that accounts for the heteroscedasticity. Veitch and Abry (1999) used weighted linear regression to improve the estimator. This method weights each level by the inverse of the variance of that level. Hamilton et al.
(2011) proposed estimation methods that are based on the Theil regres-sion, that is, a weighted average of all pairwise slopes sij between levels
i and j. Given a weight wij, the estimator of the overall slope in (16)
is then P
i,jwijsij/
P
i,jwij. Different types of weights are proposed, from
which we obtain more robust estimation methods. For example, one can use harmonic average weighted slope which is theoretically optimal, or level-enhanced weights that favor slopes from finer levels. In this paper we adopted robust estimators proposed in the literature along with the OLS regression based estimator to perform more comprehensive comparison.
3.4. The complex phase information. It is known that phase and
spec-trum are intertwined in a nontrivial way to describe the data. While phases encode most of the coherent (in space and scale) structure of the image, the spectrum mostly encode the strength of local information that could be corrupted with noise (Clonda et al., 2004). For this reason phase informa-tion have been used in edge detecinforma-tion and in the reconstrucinforma-tion of images.
A classical illustration is given in Oppenheim and Lim (1981) where the image reconstruction is more driven by the phase of the Fourier transform rather than by the magnitude.
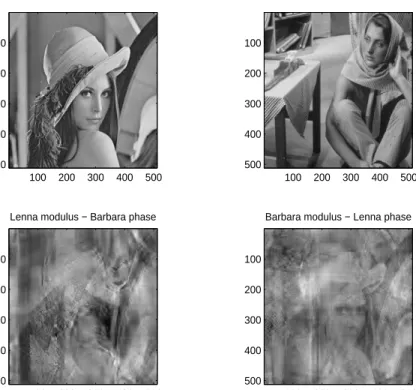
To elucidate this point we conducted a simple experiment, illustrated in Figure 4. Noiseless images of Lenna and Barbara are transformed to the complex wavelet domain using Daubechies 6-tap complex wavelet fil-ter. Each image resulted in magnitude and phase matrices of the same sizes as the original image. Next, we switched the phase matrices, and transformed the objects back to the original domain. This resulted in two surrogate images, the first from Lenna modulus and Barbara phase, and the second from Barbara modulus and Lenna phase. Although the modulus carries information about the “energy” of the image, the phase information dominates the reconstruction, as evident from the second row of images in Figure 4. 100 200 300 400 500 100 200 300 400 500 100 200 300 400 500 100 200 300 400 500
Lenna modulus − Barbara phase
100 200 300 400 500 100 200 300 400 500
Barbara modulus − Lenna phase
100 200 300 400 500 100 200 300 400 500
Figure 4. Images of Lenna and Barbara (first row) are decomposed using Daubechies complex 6 tap filter. In the wavelet domain the phase information is switched and images transformed back. Note that phase information dominates in the back-transformed images.
Recently, many research studies have focused on using phase informa-tion from the complex wavelet transforms (Andersonet al., 2005; Hua and Orchard, 2008; Miller and Kingsbury, 2008; Rakvongthai and Oraintara, 2008; Remenyi et al., 2014). In the wavelet domain the phase of a coef-ficient near an isolated feature varies linearly with its distance from the feature. Despite of the numerous literatures focused on the usage of phase in detecting edges and the feature orientations, the discriminatory power of phase in the complex wavelet domain has not yet been systematically studied.
In contrast to magnitudes of complex wavelet coefficients, their phases do not exhibit any scaling property. However, some summary statistics of the phases turn out to be discriminatory. In the following section, we demonstrate how the phase information could be used as a classification modality.
4. Mammogram Classification
In this section we illustrate how the complex wavelet-based spectra and the phase information can be used to classify digitized mammograms. We demonstrate that the spectra slope and phase, as descriptors of digitized images, have good discriminatory power. It is straightforward to implement the described analysis in various scientific areas in which 2-D data are instrumental, such as geoscience or industrial applications.
For every sub-image of size 1024×1024, we performed discrete real-valued wavelet transform (DWT) and discrete complex wavelet transform (DCWT) using Daubechies 6 tap filter. After each transform, we esti-mated the slope of wavelet spectra using traditional ordinary least squares regression (OLS) along with three robust estimation methods described in Section 3.3. The robust estimation approaches include Abry-Veitch weighted regression (AV), level enhanced OLS (EOLS) and harmonic aver-age weighted slopes (HA). For more details on these robust estimators, we refer the readers to Veitch and Abry (1999); Hamilton et al.(2011). Note that the wavelet spectra slope is used as a predictor instead of the Hurst exponent. It is because the estimated Hurst exponentH is empirical, and the slowly decaying spectra (with slope >−2) caused by the presence of colored noise, could render H to be negative.
For each classification method, we randomly selected 67% of the data as a training set to fit the classifier and used the remaining 33% of the data to test performance. The random selection of training and testing sets was re-peated 10,000 times, so the reported prediction measures are averaged over 10,000 runs. Performance was compared in terms of sensitivity, specificity, and overall correct classification rate.
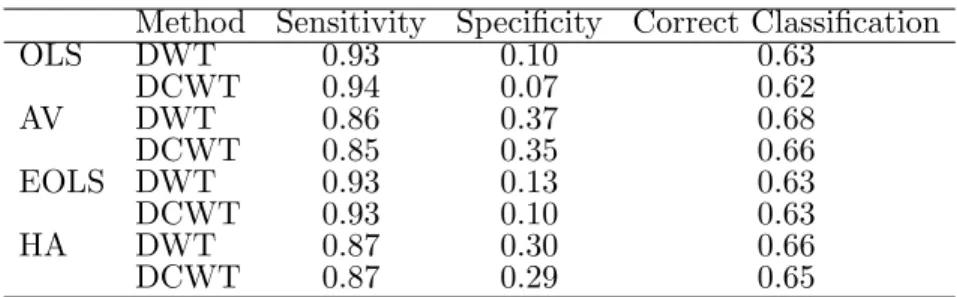
The most parsimonious classification approach would be logistic regres-sion involving only the wavelet spectra slope as a predictor. The result is summarized in Table 1. Regardless of estimation methods, the performance is comparable to the status quo with rate ranging from 0.62 to 0.68. And this diagnostic classification does not require any skills or training and it only uses background regularity of the image summarized by wavelet spec-tra slope.
Table 1. Logistic classification based on the wavelet spectra slope; four different estimation methods were compared, each with real-valued (DWT) and complex (DCWT) wavelet transform.
Method Sensitivity Specificity Correct Classification
OLS DWT 0.93 0.10 0.63 DCWT 0.94 0.07 0.62 AV DWT 0.86 0.37 0.68 DCWT 0.85 0.35 0.66 EOLS DWT 0.93 0.13 0.63 DCWT 0.93 0.10 0.63 HA DWT 0.87 0.30 0.66 DCWT 0.87 0.29 0.65
One of the interesting findings is that the phase contains information to classify normal images from malignant. Since the features and directions of background tissue is best preserved in the level of finest detail, we focus on the phase information of finest detail. Figure 4 shows how the estimated density of the phase average and coefficient of variation (CV) at the finest level from normal images differ from cancer images. In this case, we hy-pothesize control mammograms have no clusters of consistent features and edges in the detailed wavelet space.
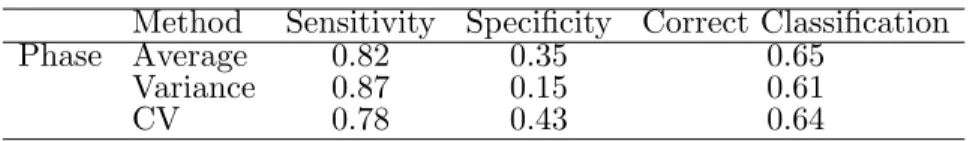
To validate the discriminatory power of the phase information, we as-sessed the logistic models by using each of the three summary statistics (average, variance, coefficient of variation) of the phases at the finest level. As Table 2 shows, any single predictor classifies malignant and normal im-ages with correct classification rate of 61-65%.
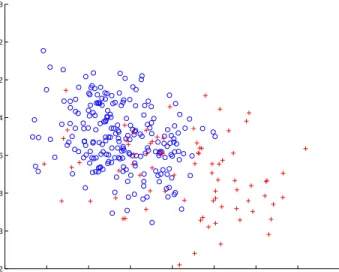
We then conducted classification analysis based on the complex wavelet spectra slope and the phase average. Figure 6 shows a scatter plot of cases by complex spectra slope versus phase average, illustrating the differentia-tion between benign and malignant cases.
−0.80 −0.6 −0.4 −0.2 0 1 2 3 4 5 6 7 8 9 −200 −15 −10 −5 0 0.1 0.2 0.3 0.4 0.5 0.6 0.7
Figure 5. Left panel: Estimated density of phase average at the finest level. Right panel: Estimated density of phase coefficient of variation at the finest level. The solid line corresponds to malignant cases and the dotted line to normal cases.
Table 2. Logistic classification based on summary statistics of phase information at the finest level.
Method Sensitivity Specificity Correct Classification
Phase Average 0.82 0.35 0.65
Variance 0.87 0.15 0.61
CV 0.78 0.43 0.64
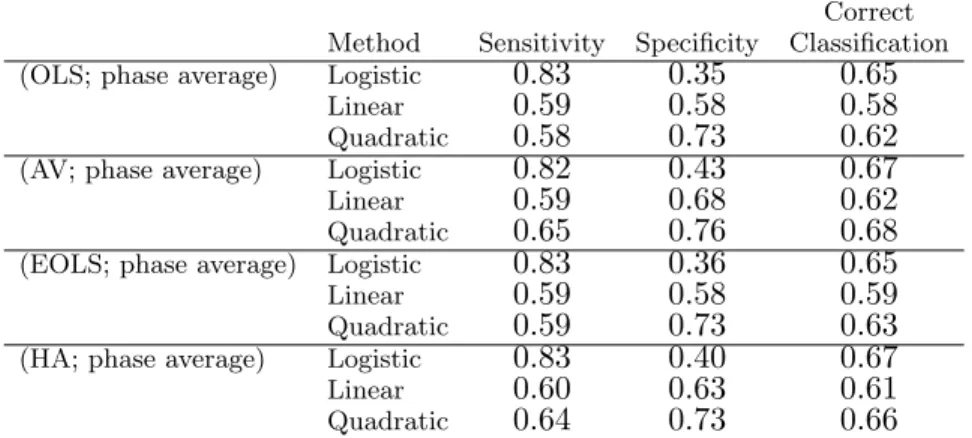
We combined complex wavelet spectra obtained from four different esti-mation methods with the phase average. For each of the four pairs, we per-formed logistic, linear and quadratic classification. By combining wavelet spectra slope with phase average, we obtain classification rate of up to 0.68 with stable sensitivity and specificity rate. Several wavelet bases and level combinations have been compared but the results and the conclusion remain the same.
−0.5 −0.45 −0.4 −0.35 −0.3 −0.25 −0.2 −0.15 −0.1 −3.2 −3 −2.8 −2.6 −2.4 −2.2 −2 −1.8 Phase Average
Complex Spectra Slope
Figure 6. Scatter plot of Complex spectra slope (obtained by AV estimation method) versus Phase average. The symbols denote:circles
for normal mammographies,crossesfor malignant mammographies.
5. Conclusions
In this paper we proposed a complex scale-mixing 2-D wavelet transform in the context of assessing regularities of 2-D objects. The proposed trans-form is implemented by matrix operations, and it guarantees unitarity, low computational cost, directional insights, interplay between the scales, and a straightforward inverse transform. We then explored the spectra and self-similarity measures based on the proposed complex wavelet transform and demonstrated its utility in the context of mammogram image classification. The procedure is based on assessing the regularity of background tissues of images rather than mammogram features such as microcalcification and tumor masses. This approach is an unused diagnostic modality in the field. To obtain the estimates of Hurst exponent, we used three robust estima-tion methods (AV, EOLS and HA) along with the ordinary least squares estimator. We also studied phase statistics at the finest level as a classifier. From the logistic classification model, we found that robust Hurst expo-nent estimates and the phase average have enough power to differentiate benign from malignant cases, with correct classification rate of 62-68%. We also showed that by combining spectra slope estimates with phase average,
Table 3. Logistic, Linear and Quadratic classification based on the pair of complex wavelet spectra and the phase average.
Correct Method Sensitivity Specificity Classification (OLS; phase average) Logistic 0.83 0.35 0.65
Linear 0.59 0.58 0.58
Quadratic 0.58 0.73 0.62
(AV; phase average) Logistic 0.82 0.43 0.67
Linear 0.59 0.68 0.62
Quadratic 0.65 0.76 0.68
(EOLS; phase average) Logistic 0.83 0.36 0.65
Linear 0.59 0.58 0.59
Quadratic 0.59 0.73 0.63
(HA; phase average) Logistic 0.83 0.40 0.67
Linear 0.60 0.63 0.61
Quadratic 0.64 0.73 0.66
we obtained high classification rate with stable sensitivity and specificity. Therefore, complex wavelet transform greatly appeals to investigators seek-ing more robust and reliable classification method for various application area.
It is well known that for the real wavelets there is no symmetric and com-pactly supported scaling function defining an orthogonal MRA. Complex wavelets assure symmetry, compact support and orthogonality (that is uni-tarity) of decomposing atoms which is desirable in image representations. Since complex wavelets provide the only compactly supported and symmet-ric basis which are unitary, it better represents the image than real-valued wavelet transform. By using proposed method, complex wavelet transforms can be readily performed and applied to various domains to summarize, classify or interpret highly complex data.
Appendix
Derivation of expression (13). The scale-mixing detail coefficients of a
2-D fBm (11) are d(j,j+s);k= 2j+ s 2 Z BH(u)ψ 2ju1−k1,2j+su2−k2 du.
These coefficients are random variables with zero mean and variance (Heneghanet al., 1996) E|d(j,j+s);k|2 = 22j+s Z ψ 2ju1−k1,2j+su2−k2 ×ψ∗ 2jv1−k1,2j+sv2−k2 E[BH(u)BH(v)]du dv. (17) Since E[BH(u)BH(v)] = σ2H 2 |u| 2H +|v|2H− |u−v|2H , and Z ψ 2ju1−k1,2j+su2−k2 du= Z ψ 2jv1−k1,2j+sv2−k2 dv= 0,
it can be easily seen that (17) becomes
E|d(j,j+s);k|2 =−σ 2 H 2 2 2j+s Z Z ψ 2ju1−k1,2j+su2−k2 ×ψ∗ 2jv1−k1,2j+sv2−k2 |u−v|2Hdudv.
Next, define substitutions
p = (p1, p2) = 2j(u1−v1),2j+s(u2−v2) , Then, ifps≡(p1,2−sp2), E|d(j,j+s);k|2 = −σ 2 H 2 2 2j+s Z Z ψ(p+q) ψ∗(q) 2−2jH |ps|2H 2−4j−2s dp dq = −σ 2 H 2 2 −j(2H+2)Z Z ψ(p+q) ψ∗(q) |p s|2H2−s dp dq = 2−j(2H+2) Vψ,s(H), where Vψ,s(H) =− σH2 2 Z Z ψ(p+q)ψ∗(q) |ps|2H2−s dp dq, (18)
References
Achim, A. and Kuruoglu, E. (2005). Image denoising using bivariate α -stable distributions in the complex wavelet domain. IEEE Signal Pro-cessing Letters,12, 17–20.
Altekruse, S., Kosary, C., Krapcho, M., Neyman, N., Aminou, R., and Waldron, W. (2010). Seer cancer statistics review: 1975-2007.
Anderson, R., Kingsbury, N., and Fauqueur, J. (2005). Determining mul-tiscale image feature angles from complex wavelet phases. International conference on Image processing (ICIP), Toronto, Canada, September 28-30.
Clonda, D., Lina, J.-M., and Goulard, B. (2004). Complex daubechies wavelets: properties and statistical image modelling. Signal Processing,
84, 1–23.
Daubechies, I. (1992).Ten Lectures on Wavelets. Number 61 in CBMS-NSF Series in Applied Mathematics. SIAM, Philadelphia.
El-Naqa, I., Yang, Y., Wernick, M., Galatsanos, N., and Nishikawa, R. (2002). A support vector machine approach for detection of microcalci-fications. IEEE Transactions on medical imaging,21(12), 1552–1563. Gao, R. and Yan, R. (2010). Wavelets: Theory and Applications for
Man-ufacturing. Springer.
Hamilton, E. K., Jeon, S., Cobo, P. R., Lee, K. S., and Vidakovic, B. (2011). Diagnostic classification of digital mammograms by wavelet-based spec-tral tools: A comparative study.The Proceedings of the 2011 IEEE Inter-national Conference on Bioinformatics and Biomedicine, pages 384–389. Heath, M., Bowyer, K., Kopans, D., Moore, R., and Kegelmeyer, P. (2000). The digital database for screening mammography. The Proceedings of the 5th International Workshop on Digital Mammography, Toronto, Canada, Medical Physics Publishing (Madison, WI).
Heneghan, C., Lown, S., and Teich, M. (1996). Two dimensional frac-tional Brownian motion: Wavelet analysis and synthesis. Image analysis and interpretation, proceedings of the IEEE Southwest Symposium, pages 213–217.
Hua, G. and Orchard, M. T. (2008). Image reconstruction from the phase or magnitude of its complex wavelet transform. Proceedings of the IEEE In-ternational Conference on Acoustics, Speech and Signal Processing, pages 3261–3264.
Kestener, P., Lina, J., Saint-Jean, P., and Arneodo, A. (2001). Wavelet-based multifractal formalism to assist in diagnosis in digitized mammo-grams. Image analysis and stereology,20(3), 169–175.
Kim, S., Wang, Z., Oraintarac, S., Temiyasathita, C., and Wongsawatc, Y. (2008). Feature selection and classification of high-resolution nmr spectra in the complex wavelet transform domain. Chemometrics and Intelligent Laboratory Systems,90, 161–168.
Lawton, W. (1993). Applications of complex valued wavelet transforms to subband decomposition. IEEE Transactions on Signal Processing, 41, 3566–3568.
Lina, J.-M. and Mayrand, M. (1995). Complex daubechies wavelets.Applied and Computational Harmonic Analysis,2, 219–229.
Magarey, J. and Kingsbury, N. (1998). Motion estimation using a complex-valued wavelet transform. IEEE Transactions on Signal Processing,46, 1069–1084.
Mallat, S. G. (1998). A Wavelet Tour of Signal Processing. Academic Press, San Diego.
Miller, M. and Kingsbury, N. (2008). Image modeling using interscale phase properties of complex wavelet coefficients. IEEE Transactions on Image Processing,17(9), 1491–1499.
Morettin, P. A. (1997).Wavelets in Statistics. 3rd International Conference on Statistical Data Analysis Based on L1 Norm and Related Methods.
Neuchˆatel, Switzerland.
Netsch, T. and Peitgen, H. (1999). Scale-space signatures for the detection of clustered microcalcifications in digital mammograms. IEEE Transac-tions on medical imaging,18(9), 774–786.
Nicolis, O., Ram´ırez-Cobo, P., and Vidakovic, B. (2011). 2-D wavelet-based spectra with applications. Computational Statistics and Data Analysis,
55(1), 738–751.
Oestreicher, N., Lehman, C., Seger, D., Buist, D., and White, E. (2005). The incremental contribution of clinical breast examination to invasive cancer detection in a mammography screening program. American Jour-nal of Roentgenology,184(2), 428–432.
Oppenheim, A. and Lim, J. (1981). The importance of phase in signals.
The Proceedings of the IEEE,69, 529–541.
Portilla, J. and Simoncelli, E. P. (2000). A parametric texture model based on joint statistics of complex wavelet coefficients. International journal of computer vision,40, 49–70.
Rakvongthai, Y. and Oraintara, S. (2008). On phase statistics of complex wavelet coefficients at edges. European Conference on Signal Processing, pages 2–6.
Ram´ırez-Cobo, P., Lee, K. S., Molini, A., Porporato, A., Katul, G., and Vidakovic, B. (2011). A wavelet-based spectral method for extracting self-similarity measures in time-varying two-dimensional rainfall maps.
Journal of Time Series Analysis,32(4), 351–363.
Remenyi, N., Nicolis, O., Nason, G., and Vidakovic, B. (2014). Image denoising with 2-d scale-mixing complex wavelet transforms. To Appear in IEEE Transactions on Signal Processing.
Selesnick, I. W., Baraniuk, R. G., and Kingsbury, N. G. (2005). The dual-tree complex wavelet transform. IEEE Signal Processing Magazine,
22(6).
Strang, G. and Nguyen, T. (1996). Wavelets and Filter Banks. Wellesley-Cambridge Press, Wellesley, MA.
Veitch, D. and Abry, P. (1999). A wavelet-based joint estimator of the pa-rameters of long-range dependence. IEEE Transactions on Information Theory,45, 878–897.
Vidakovic, B. (1999).Statistical Modeling by Wavelets. John Wiley & Sons, Inc.
Wang, T. and Karayiannis, N. (1998). Detection of microcalcifications in digital mammograms using wavelets. IEEE Transactions on medical imaging,17(4), 498–509.
Zhang, X.-P., Desai, M., and Peng, Y. (1999). Orthogonal complex filter banks and wavelets: Some properties and design. IEEE Transactions on Signal Processing,47(4), 1039–1048.