Virginia Commonwealth University
VCU Scholars Compass
Mechanical and Nuclear Engineering Publications
Dept. of Mechanical and Nuclear Engineering
2008
Breast Tumor Simulation and Parameters
Estimation Using Evolutionary Algorithms
Manu Mital
Virgen Milagrosa University Foundation
Ramana M. Pidiparti
Virginia Commonwealth University
Follow this and additional works at:
http://scholarscompass.vcu.edu/egmn_pubs
Copyright © 2008 Manu Mital and Ramana M. Pidaparti. This is an open access article distributed under the Creative Commons Attribution License, which permits unrestricted use, distribution, and reproduction in any medium, provided the original work is properly cited.
This Article is brought to you for free and open access by the Dept. of Mechanical and Nuclear Engineering at VCU Scholars Compass. It has been accepted for inclusion in Mechanical and Nuclear Engineering Publications by an authorized administrator of VCU Scholars Compass. For more information, please [email protected].
Downloaded from
Volume 2008, Article ID 756436,6pages doi:10.1155/2008/756436
Research Article
Breast Tumor Simulation and Parameters Estimation Using
Evolutionary Algorithms
Manu Mital and Ramana M. Pidaparti
Department of Mechanical Engineering, Virginia Commonwealth University, Richmond, VA 23284, USA
Correspondence should be addressed to Ramana M. Pidaparti,[email protected]
Received 20 September 2007; Revised 7 December 2007; Accepted 20 February 2008 Recommended by Ewa Pietka
An estimation methodology is presented to determine the breast tumor parameters using the surface temperature profile that may be obtained by infrared thermography. The estimation methodology involves evolutionary algorithms using artificial neural network (ANN) and genetic algorithm (GA). The ANN is used to map the relationship of tumor parameters (depth, size, and heat generation) to the temperature profile over the idealized breast model. The relationship obtained from ANN is compared to that obtained by finite element software. Results from ANN training/testing were in good agreement with those obtained from finite element model. After ANN validation, GA is used to estimate tumor parameters by minimizing a fitness function involving comparing the temperature profiles from simulated or clinical data to those obtained by ANN. Results show that it is possible to determine the depth, diameter, and heat generation rate from the surface temperature data (with 5% random noise) with good accuracy for the 2D model. With 10% noise, the accuracy of estimation deteriorates for deep-seated tumors with low heat generation. In order to further develop this methodology for use in a clinical scenario, several aspects such as 3D breast geometry and the effects of nonuniform cooling should be considered in future investigations.
Copyright © 2008 M. Mital and R. M. Pidaparti. This is an open access article distributed under the Creative Commons Attribution License, which permits unrestricted use, distribution, and reproduction in any medium, provided the original work is properly cited.
1. Introduction
Breast cancer, which is common among women, is an international concern. There are about 200 000 cases a year, and it is estimated that there are more than 1 million women with undetected breast cancer. Among various techniques to detect breast cancer, infrared (IR) imaging has been widely used since the late 1950’s. In general, the temperature of the human body on the surface of the skin depends on the metabolic activity, the blood flow, and the temperature of the surroundings. Any abnormality in the tissue, such as the presence of a tumor, alters the normal temperature on the skin surface due to increased metabolic activity of the tumor. Therefore, abnormal skin temperature profiles are an indi-cation of diseases such as mastitis, benign tumors, fibrocystic breast disease, and cancer. Lawson [1] was the first to propose the use of thermographic detection of breast cancer, when he observed that the local temperatures of the skin over a tumor were significantly higher (about 2-3 degrees) than normal skin temperatures. Lawson and Chughtai [2] established that
the regional temperature difference over an embedded tumor
was due to convection effects associated with increased blood
perfusion, and increased metabolism around the tumor. Thermography, also known as thermal or infrared imag-ing, is a procedure to determine if an abnormality is present in the breast tissue surface temperature distribution. This abnormality in temperature distribution might indicate the presence of an embedded tumor. Amalu [3] and Keyserlingk et al. [4] have reviewed the role of infrared thermography with respect to the role of IR imaging in the detection of
breast cancer and risk indicator. They [3,4] concluded that
the IR imaging has a significant role to play in breast cancer screening due to its ability to image metabolic aspects of the breast and along with sensitivity, specificity, and prognostics. Further aspects of IR imaging techniques of breast cancer and detection methods from infrared images are described in detail and compiled in a recent book by Diakides and Bronzino [5].
In order to complement the IR imaging techniques of breast tumor detection, models have been proposed to
2 Modelling and Simulation in Engineering estimate the temperature distributions over breast with and
without tumors. For example, Sudarshan et al. [6] studied the temperature distributions in breast cancer by considering a two-dimensional model first proposed by Romrel and Bland [7]. In this model, Pennes bioheat equation was used to describe the flow of thermal energy. The breast model consisted of a subcutaneous fat layer, followed by a gland layer and a deep muscle layer adjacent to the
thoracic wall. Using this model, the effects of the tumor
size, depth, and the blood perfusion rate on the surface temperature magnitude and profile were determined. Evo-lutionary algorithms based on neural networks and genetic algorithms have been proposed to detect abnormalities in several applications (such as ECG, tomography, ultrasound); see, for example, Diakides and Bronzino [5]. Recently, Mital and Scott [8] developed a method to determine parameters of an embedded heat source representing a tumor using infrared imaging. It appears that based on literature there are no methods available to estimate the tumor parameters based on the temperature distribution obtained from IR imaging techniques.
The objective of this study is the development of a methodology to estimate the depth, size, and heat generation rate of an embedded tumor in the breast, based on tempera-ture profile on the surface that may be obtained by infrared
thermography. This study differs from other works related
to breast cancer in that inverse methods are used in the estimation methodology. The methodology is demonstrated with a simple model in order to illustrate the details of the procedures involved. Several cases of various embedded tumor conditions were presented to illustrate the generality of the method.
2. Estimation Methodology and Procedure
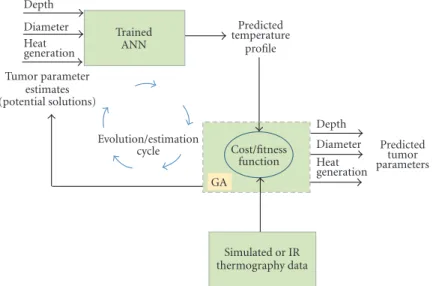
The estimation methodology involves evolutionary algo-rithms using artificial neural network (ANN) and genetic
algorithm (GA) as shown inFigure 1. The ANN is used to
map the relationship of tumor depth, tumor size, and the heat generation to the temperature profile over the idealized breast model. The relationship obtained from ANN is com-pared and validated to that obtained by standard numerical model-based finite element analysis software (ANSYS). GA is used to estimate the tumor parameters (depth, size, and heat generation) by minimizing a fitness function involving the temperature profiles obtained from simulated or clinical data to those obtained by ANN. The fitness function is given as a sum of the squares’ function that relates the data from the observed thermographic temperature profile to the temperature profile for a given set of estimated parameters. It is defined as
S=Y−T(β)TY−T(β), (1)
where Y and T are vectors containing the observed and esti-mated temperatures, respectively, and superscript T denotes the transpose of the vector. The observed temperature vector Y contains surface temperatures that would be obtained
experimentally from thermal imaging. The estimated tem-peratures contained in vector T are obtained by the outputs of the trained neural network model using estimates for the unknown parameters (from the population pool of the GA). The vector containing the estimates for unknown parameters
is denoted byβ. In this study, the unknown parameter vector
βcontains the depth, diameter, and the heat generation rate
of the source. Once the objective function was formulated, the estimation scheme using GA was used to determine the unknown parameters.
3. Artificial Neural Network Model to
Map Breast Temperature Profiles
A multilayer feed-forward ANN with backpropagation learn-ing algorithm is developed to represent the surface tempera-ture profile of the breast as a function of depth, diameter, and heat generation rate of the tumor. The network is developed with the MATLAB Neural Network Toolbox using
the “newff” function. The learning rate was set reasonably
low at 0.05 to ensure convergence of the algorithm. There are many transfer functions available in MATLAB software. After some experimentation, the “logsig” transfer function was chosen for the hidden layers and the output neurons, due to nature of the desired outputs. A schematic of the network
is shown inFigure 2. The network has 3 input nodes for the
three parameters, and 31 output nodes that define one half of the symmetrical temperature profile on the skin surface. There are 2 hidden layers in the network, the first with 21 nodes, and the second with 19 nodes. This configuration was reached after a few iterations of a single hidden layer network proved to give less than adequate results. Two layer deep-nested loops were used in an exhaustive search that varied the number of neurons in the first and second hidden layers, and found the appropriate combination (21-19) that best trained the network. Therefore, a 3-21-19-31 neural network architecture was developed and trained and tested to validate the model. More details about the neural networks and their concepts can be found in Russell and Norvig [9].
In this study, a simplified 2D model of the cross-section of the breast similar to that used by Sudershan et al. [6]
was considered, as shown inFigure 3. The Pennes bioheat
equation has to be solved to estimate the temperature distribution over the breast model. Due to the complexity of the breast geometry, there are no known analytical solutions to the bioheat equation. Therefore, solutions are usually obtained using computational techniques such as the finite element method. A finite element model created using a commercially available finite element package, ANSYS, solves the Pennes bioheat equation to find the surface temperatures, and this information is used in training/validating ANN model. In this study, the breast is assumed to be of 0.072 m radius hemispherical shape, with a subcutaneous fat layer of 0.005 m uniform thickness, followed by gland, muscle, and the thoracic wall. The tumor is situated symmetrically in the gland layer and assumed to be circular in shape for simplicity. Note that the entire breast is modeled even though the 2D geometry is symmetrical about the Y axis. This is done
Depth Diameter Heat generation Tumor parameter estimates (potential solutions) Trained ANN Predicted temperature profile Cost/fitness function GA Depth Diameter Heat generation Simulated or IR thermography data Predicted tumor parameters Evolution/estimation cycle
Figure 1: Overall estimation methodology for prediction of breast tumor parameters.
Input parameters Depth Diameter Heat generation Artificial neural network Output temperatures
Figure 2: Schematic of the neural network.
for future studies where an offcenter tumor location may be considered. The heat transfer in each layer is governed by (1). The values of thermal conductivity, metabolic heat generation rate, and the perfusion source term for each layer,
adopted from Werner and Buse [10], are presented inTable 1.
The thoracic wall is assumed to be maintained at a constant
core body temperature of 37◦C. Based on estimate by Osman
and Afify [11], the surface of the breast is subjected to a
combined heat transfer coefficient (convection, radiation,
and evaporation) of 13.5 W/m2-K, a reasonable value in
the absence of forced convection. The clinical environment under which the thermographic measurements are made is
assumed to be at a constant temperature of 21◦C.
Using the finite element analysis of the breast model, a total of 17 different cases were analyzed and used for training the ANN. The inputs parameters are scaled between 0 and 1 using upper and lower bounds for each parameter. The diameter of the tumor is allowed to vary between 0.005 and 0.015 m so that it is in mammary gland region. The bounds for depth are 0.014 and 0.041 m (based on the assumption that the tumor will most likely be present in the gland). The lower and upper bounds on the heat generation rate
of the tumor are 20 times (14,000 W/m3) and 100 times
(70,000 W/m3) that of normal tissue. The output surface
Subcutaneous fat Gland Tumor Muscle Thoracic wall 0.005 m 0.045 m 0.015 m 0.007 m 0.072 m
Figure 3: A 2D model of the breast based on Sudershan et al. [6].
temperatures of the network are scaled values between 0 and
1, using a lower limit of 26◦C and upper limit of 33◦C. The
network was trained for 400 epochs or training cycles using the data generated from finite element analysis results. Three different cases were used for validating the trained network.
4. Genetic Algorithms in Breast Tumor
Parameters Estimation
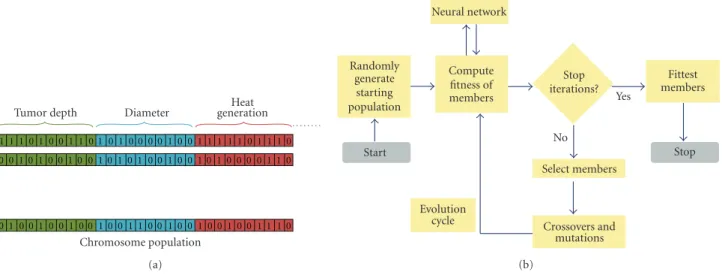
In the implementation of the GA, the potential solution (chromosome) contains the depth, diameter, and the tumor heat generation rate as the 3 genes and 10 bits are used to represent the value of each gene in binary format. Therefore, each chromosome has 30 bits. The population size has been chosen to be 20. The initial population pool was generated using a random number generator.
The parameters contained in each chromosome are changed from their binary representation to floating point representation using (for the ith parameter)
Pi=a+ b−a
2nb−1(m), (2)
where Piis the decimal value of ith parameter, a and b are the
lower and upper limits of the search interval, respectively, nb is the number of bits used to represent the parameter (e.g., 10 in this case), and m is the decimal value of the parameter
4 Modelling and Simulation in Engineering 1 1 1010 01 101 010 0 0 010 01 1 1 1 1 1 1 1 1 1 1 1 1 1 1 1 1 1 1 1 1 1 1 1 1 1 1 1 1 1 1 00 0 0 0 0 0 0 0 0 0 0 0 0 0 0 0 0 0 0 0 0 0 0 0 0 0 0 0 0 0 0 0 0 0 0 0 0 0
Tumor depth Diameter generationHeat
Chromosome population (a) Randomly generate starting population Compute fitness of members Stop iterations? Fittest members Stop Start Select members Crossovers and mutations Neural network Evolution cycle No Yes (b)
Figure 4: Flowchart of the GA estimation procedure.
Table 1: Values of thermal conductivity, metabolic heat generation, and perfusion term.
Layer Thermal conductivity (W/m-K) Metabolic heat generation (W/m3) Perfusion (W/ m3-C)
Subcutaneous fat 0.21 400 800 Gland 0.48 700 2400 Muscle 0.48 700 2400 Tumor 0.48 14000–70000 48000 10−1 10−2 10−3 10−4 Ne tw o rk M S E 0 50 100 150 200 250 300 Epochs
MSE is 1.4098e−005 after 400 epochs
Figure 5: Convergence plot with mean squared error of the network output during training.
in binary form. The lower limit a and upper limit b for each of the three parameters were mentioned earlier.
The fitness of each chromosome is evaluated using the sum of the squares objective function given by (2). The fitness f of a chromosome is related to the sum of the squares function using
f =SMax−S(β), (3)
whereSMAXwas arbitrarily chosen to be 10 so it always stays
greater than the maximum value of sum of squares possible,
1 0.9 0.8 0.7 0.6 0.5 0.4 0.3 0.2 0.1 0 N eur al netw or k p re diction 0 0.2 0.4 0.6 0.8 1
Direct numerical simulation Case 1R2=0.936
Case 2R2=0.982
Case 3R2=0.988
Figure 6: Comparison of output of trained ANN with finite
element simulation.
and S is the sum of the squares generated using a parameter
set (chromosome)β.
The fitness is determined for each parameter set (chro-mosome) and then ranked. Chromosomes of higher fitness are more likely to be selected to reproduce and contribute their genetic material to the next generation. A probability of
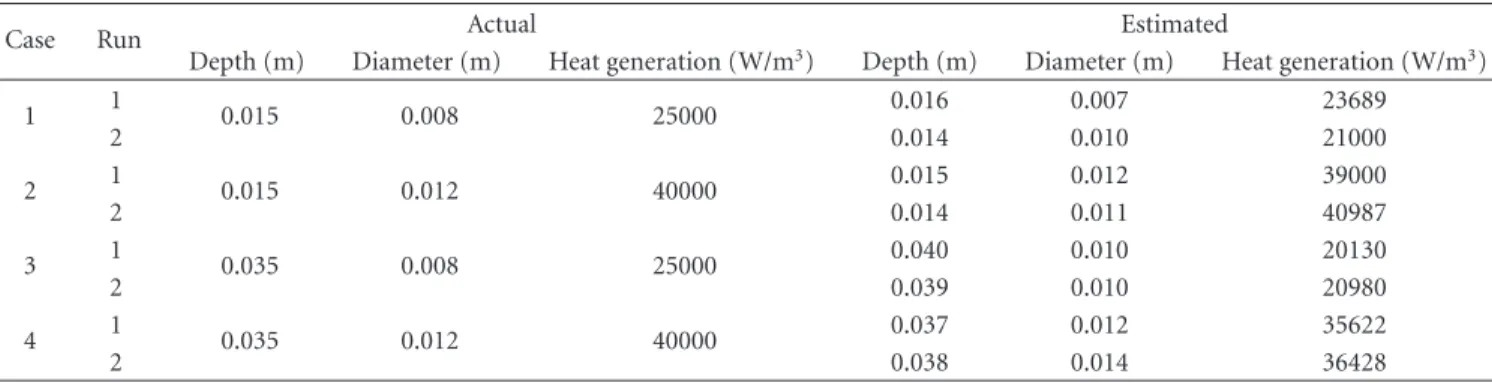
Table 2: Results from parameter estimation procedure to determine embedded tumor parameters using temperature data with 5% noise.
Case Run Actual Estimated
Depth (m) Diameter (m) Heat generation (W/m3) Depth (m) Diameter (m) Heat generation (W/m3)
1 1 0.015 0.008 25000 0.015 0.007 25440 2 0.015 0.007 27302 2 1 0.015 0.012 40000 0.014 0.011 39126 2 0.015 0.012 39619 3 1 0.035 0.008 25000 0.035 0.008 27028 2 0.034 0.007 28396 4 1 0.035 0.012 40000 0.036 0.011 40330 2 0.036 0.012 42082
Table 3: Results from parameter estimation procedure to determine embedded tumor parameters using temperature data with 10% noise.
Case Run Actual Estimated
Depth (m) Diameter (m) Heat generation (W/m3) Depth (m) Diameter (m) Heat generation (W/m3)
1 1 0.015 0.008 25000 0.016 0.007 23689 2 0.014 0.010 21000 2 1 0.015 0.012 40000 0.015 0.012 39000 2 0.014 0.011 40987 3 1 0.035 0.008 25000 0.040 0.010 20130 2 0.039 0.010 20980 4 1 0.035 0.012 40000 0.037 0.012 35622 2 0.038 0.014 36428
mutation (random changing of a chromosome) of 0.10 and a probability of crossover (formation of children) equal to 0.90 are used to determine how members of the population will reproduce to bring forth the next generation. A flowchart of
the solution method is presented in Figure 4. More details
about GA procedures and applications can be found in Goldberg [12] and Davis [13].
Several cases were simulated in order to validate the ability of the estimation procedure to accurately predict the depth, size, and heat generation rate of the embedded tumor. For each parameter set, two runs of the GA were conducted by introducing 5% and 10% noises in the simulation data to see the sensitivity of the prediction of breast tumor parameters.
5. Results and Discussion
A convergence plot of the mean squared error of the neural
network output during training is shown in Figure 5. In
general, the results obtained from ANN training were in good agreement with those obtained from finite element analysis model. After the ANN is trained, the network is
validated for three different cases as shown in Figure 6. It
can be seen fromFigure 6that, for each validation case, the
output of the neural network model shows good agreement
with the simulation results withR2 values of 0.936, 0.982,
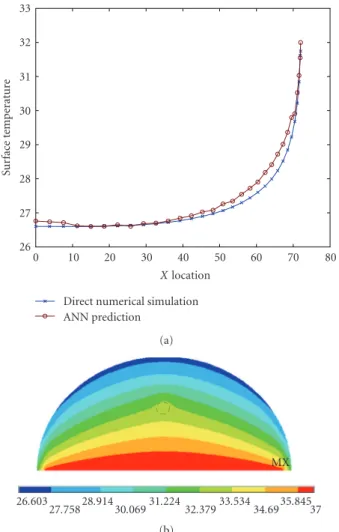
and 0.988, respectively. To further validate the ANN results, the temperature profiles obtained for a specific case 3 (depth of 0.029 m, diameter of 0.008 m, and heat generation of
30000 W/m3) are compared with the finite element and ANN
models as shown inFigure 7. Once again a good comparison
is seen.
The parameter estimates for the depth, diameter, and heat generation rate of the tumor for the four cases, corre-sponding to 5% and 10% random noise in the temperature
rise on the skin surface, are presented in Tables 2 and 3,
respectively. MATLAB built in function “rand” was used for generating random noise in the temperature rise on the skin surface. For each case, the GA was run twice with different random initial populations yielding similar results. With 5% random noise, the results show good agreement between actual and predicted parameters. In this case, the absolute errors in depth and size were within 0.001 m, and absolute
errors in heat generation rate were within 3000 W/m3.
With 10% noise, the accuracy of the estimated parameters deteriorates for deep seated tumors with low heat generation rate. In this case, the absolute errors in depth were within 0.005 m, error in size within 0.002 m, and in heat generation
rate within 4870 W/m3.
6. Conclusions
An estimation methodology-based evolutionary algorithm using neural networks and genetic algorithms was developed to estimate the breast tumor parameters based on surface temperature profile that may be obtained by infrared ther-mography. The methodology is demonstrated with a simple model in order to illustrate the details of the procedures involved. For the cases studied, results from simulations show that it is possible to determine the depth, diameter, and
6 Modelling and Simulation in Engineering 33 32 31 30 29 28 27 26 Su rf ac e te m p er at u re 0 10 20 30 40 50 60 70 80 Xlocation Direct numerical simulation ANN prediction (a) 26.603 27.75828.91430.06931.22432.37933.53434.6935.84537 MX (b)
Figure 7: Comparison of temperature profile of trained ANN with direct numerical simulation.
heat generation rate from the surface temperature data (with 5% random noise) with good accuracy for the simplified 2D model. With 10% noise, the accuracy of the estimated parameters deteriorates for deep-seated tumors with low heat generation rate. With the recent advances in the accuracy of IR images and noise reduction techniques, it may be possible to reduce noise to within acceptable levels (5%)
for the methodology to be effective. In general, the breast
shape is complex, and this should be considered for realistic studies. However, the estimation methodology is general and can be applied even to realistic breast geometry. This may increase the computation time but the methodology can be easily extended. In order to further develop the proposed methodology so that it can be used in a clinical scenario, several aspects such as complexities of 3D breast geometry and the effects of nonuniform cooling should be considered in future investigations.
References
[1] R. N. Lawson, “Implications of surface temperatures in the diagnosis of breast cancer,” Canadian Medical Association
Journal, vol. 75, no. 4, pp. 309–310, 1956.
[2] R. N. Lawson and M. S. Chughtai, “Breast cancer and body temperatures,” Canadian Medical Association Journal, vol. 88, pp. 68–70, 1963.
[3] W. C. Amalu, “A Review of Breast Thermography,” Interna-tional Academy of Clinical Thermology, 2003.
[4] J. Keyserlingk, P. Ahlgren, E. Yu, N. Belliveau, and M. Yassa, “Functional infrared imaging of the breast,” IEEE Engineering
in Medicine and Biology Magazine, vol. 19, no. 3, pp. 30–41,
2000.
[5] N. A. Diakides and J. D. Bronzino, Medical Infrared Imaging, CRC Press, Boca Raton, Fla, USA, 2007.
[6] N. M. Sudarshan, E. Y. K. Ng, and S. I. Teh, “Surface temperature distribution of a breast with and without tumour,” Computer Methods in Biomechanics and Biomedical
Engineering, vol. 2, no. 3, pp. 187–199, 1995.
[7] L. J. Romrell and K. I. Bland, “Anatomy of breast, axilla, chest wall, and related metastatic sites,” in The Breast: A
Comprehensive Management of Benign and Malignant Diseases,
p. 22, Saunders, Philadelphia, Pa, USA, 1991.
[8] M. Mital and E. P. Scott, “Thermal detection of embedded tumors using infrared imaging,” Journal of Biomechanical
Engineering, vol. 129, no. 1, pp. 33–39, 2007.
[9] P. Russell and P. Norvig, Artificial Intelligence: A Modern
Approach, Prentice Hall, Upper Saddle River, NJ, USA, 1995.
[10] J. Werner and M. Buse, “Temperature profiles with respect to inhomogeneity and geometry of the human body,” Journal of
Applied Physiology, vol. 65, no. 3, pp. 1110–1118, 1988.
[11] M. M. Osman and E. M. Afify, “Thermal modeling of the normal woman’s breast,” Journal of Biomechanical Engineering, vol. 106, no. 2, pp. 123–130, 1984.
[12] D. E. Goldberg, Genetic Algorithms in Search, Optimization
and Machine Learning, Addison-Wesley, Reading, Mass, USA,
1989.
[13] L. Davis, Handbook of Genetic Algorithms, Van Nostrand Reinhold, New York, NY, USA, 1991.
Submit your manuscripts at
http://www.hindawi.com
VLSI Design
Hindawi Publishing Corporation
http://www.hindawi.com Volume 2014
Machinery
Hindawi Publishing Corporation
http://www.hindawi.com Volume 2014 Hindawi Publishing Corporation http://www.hindawi.com
Journal of
Engineering
Volume 2014
Hindawi Publishing Corporation
http://www.hindawi.com Volume 2014 Shock and Vibration
Hindawi Publishing Corporation
http://www.hindawi.com Volume 2014
Mechanical Engineering Advances in
Hindawi Publishing Corporation
http://www.hindawi.com Volume 2014
Civil Engineering
Advances inAcoustics and VibrationAdvances in
Hindawi Publishing Corporation
http://www.hindawi.com Volume 2014
Hindawi Publishing Corporation
http://www.hindawi.com Volume 2014
Electrical and Computer Engineering
Journal of Hindawi Publishing Corporation
http://www.hindawi.com Volume 2014 Distributed Sensor Networks International Journal of
The Scientific
World Journal
Hindawi Publishing Corporation
http://www.hindawi.com Volume 2014
Sensors
Journal ofHindawi Publishing Corporation
http://www.hindawi.com Volume 2014
Modelling & Simulation in Engineering
Hindawi Publishing Corporation
http://www.hindawi.com Volume 2014
Hindawi Publishing Corporation
http://www.hindawi.com Volume 2014 Active and Passive Electronic Components
Hindawi Publishing Corporation
http://www.hindawi.com Volume 2014 Chemical Engineering International Journal of Control Science and Engineering Journal of
Hindawi Publishing Corporation
http://www.hindawi.com Volume 2014
Antennas and Propagation International Journal of
Hindawi Publishing Corporation
http://www.hindawi.com Volume 2014
Hindawi Publishing Corporation
http://www.hindawi.com Volume 2014 Navigation and Observation International Journal of Advances in OptoElectronics
Hindawi Publishing Corporation
http://www.hindawi.com Volume 2014
Robotics
Journal ofHindawi Publishing Corporation