52nd3AF International Conference
on Applied Aerodynamics
27 – 29 March 2017, Lyon – France
FP14-AERO2017-masini
INFLUENCE OF VANE VORTEX GENERATORS ON TRANSONIC
WING BUFFET: FURTHER ANALYSIS OF THE BUCOLIC
EXPERIMENTAL DATASET
Luke Masini(1), Sebastian Timme(2), Andrea Ciarella(3)and Andrew Peace(4) (1)PhD Student, University of Liverpool, Liverpool, L69 3GH, UK, [email protected] (2)Lecturer, University of Liverpool, Liverpool, L69 3GH, UK, [email protected] (3)Senior Aerodynamics Engineer, Aircraft Research Association Ltd., MK41 7PF, UK, [email protected] (4)Chief Scientist - Computational Aerodynamics, Aircraft Research Association Ltd., MK41 7PF, UK, [email protected]
ABSTRACT
An increased understanding of shock buffet instability on transonic wings is essential in order to design effec-tive control mechanisms for delaying this phenomenon. This paper presents a detailed analysis of an extensive experimental dataset and aims to characterise the shock unsteadiness both at buffet onset and during the initial rise in buffeting levels. The influence of passive con-trol devices is investigated by analysing the clean wing and two configurations with vane vortex generators. Un-steady data obtained both with pressure transducers and dynamic pressure-sensitive paint is analysed with signal processing tools and using proper orthogonal decompo-sition. We show that, while the vortex generators move the shock position downstream and delay buffet onset by
up to 0.4◦, spanwise-travelling pressure waves propagate
along the shock in all configurations. Data from dynamic pressure-sensitive paint provides critical insight into this wave propagation which becomes increasingly complex with increasing incidence.
1.
INTRODUCTION
Shock wave-boundary-layer interaction (SBLI) over tran-sonic wings induces boundary-layer separation leading to a flow instability, called buffet, and subsequent struc-tural vibration, called buffeting. A sufficient margin be-tween the aircraft cruise point and buffet onset has to be respected, necessitating a deeper understanding of the buffet-onset flow physics. Recently, the Aircraft Re-search Association Ltd. (ARA) and University of Liv-erpool have acquired extensive experimental and numer-ical datasets, generated during a Clean Sky project called Buffet Control of Transonic Wings (BUCOLIC). The pri-mary objectives of this project were to further the under-standing of three-dimensional (3D) shock buffet and the parameters affecting it, and to improve the flow charac-teristics through buffet control devices.
While the 2D buffet phenomenon has been discussed extensively, literature on the 3D phenomenon is more limited. The former is characterised by self-sustained, periodic shock motion having a narrow-frequency band, typically at Strouhal numbers of 0.05-0.08 [1–3]. In con-trast, 3D buffet is often described by a broadband fre-quency content centred at Strouhal numbers of 0.2-0.6 [4–8]. Attempts to describe the shock motions and the origin of separated flow have yielded contradictory re-sults, especially for complex configurations such as civil aircraft wings. Both numerical [9, 10] and experimental [5] studies have suggested different flow mechanisms for swept wings. Whereas rectangular and low-sweep wings typically show chordwise shock movement, similar to the 2D case, at higher sweep angles spanwise-travelling pres-sure unsteadiness aft of the shock has been obverved in the form of buffet cells [9].
Control and delay of shock buffet is of particular in-terest and has been studied both with passive and active control devices [11]. Vortex generators (VGs) are typi-cally used for passive flow control owing to their simplic-ity. Although the mechanism responsible for delaying the instability is unclear, VGs move the shock further down-stream and reduce the overall unsteadiness levels [12]. Moreover, it seems that VGs are even more effective for 3D wings than for the 2D case [13, 14].
In recent experiments unsteady data using a large num-ber of discrete transducers has been acquired to identify pressure propagations in both chordwise and spanwise di-rections [7, 8]. Furthermore, the advent of advanced op-tical techniques such as dynamic pressure-sensitive paint (DPSP) [15] has contributed significantly to the under-standing of 3D buffet. Early studies, albeit having limited spatial coverage, highlighted the potential of DPSP to re-veal flow structures [16, 17]. During the BUCOLIC pro-gramme, a comprehensive DPSP database covering al-most the entire wing was acquired [18]. DPSP results in huge volumes of data requiring complementary data
analysis techniques. Spatio-temporal data enables data-driven analysis using, for example, proper orthogonal de-composition (POD) and dynamic mode dede-composition (DMD). Modal analysis has been performed on DPSP data of low-speed flows [19, 20] and recently applied to the BUCOLIC data with promising results [21].
This paper presents further analysis of the BUCOLIC experimental dataset, with and without VGs. The aim is to characterise the buffet unsteadiness and the influence of the VGs. The experimental setup is first described, fol-lowed by an overview of the data post-processing. Data consistency between unsteady transducer and DPSP data is highlighted and signal processing tools are used to characterise the spectral content and pressure wave prop-agation along the shock.
2.
EXPERIMENTAL SETUP
2.1
Wind Tunnel and Model Information
The RBC12 half model representative of a large civil aircraft wing-fuselage was tested in the ARA transonic wind tunnel (TWT) in January 2015. The wind tun-nel is closed circuit and continuous, with a test
sec-tion of2.74 mby2.44 m. The stagnation pressure was
maintained at100 kPawhile the stagnation temperature
ranged between 290 Kand 310 K. The model was
in-stalled on a solid floor representing a symmetry plane and the working section side walls and roof were 22% porous.
The model has a reference area of0.295 92 m2, mean
aerodynamic chord (MAC) of0.278 89 mand semi-span
of 1.0846 m. The aspect ratio is 7.78 and the
quarter-chord sweep angle is 25◦. The Reynolds number based
on the MAC,ReMAC, ranged between 2.8 and 3.9 million.
Transition was fixed on both fuselage and wing by means of sparsely distributed Ballotini set in a thin film of epoxy resin. The location on the wing’s lower surface was set at 5%, while this is at 10-15% on the upper surface. An alternative transition configuration with transition set at 25% on the upper surface was also tested but is not dis-cussed in this paper.
The structural frequencies of the model were com-puted from the root strain gauge and accelerometer sig-nals based on a wind-off tap test. This gives a first
bend-ing mode at38 Hz, higher frequency bending modes at
125 Hzand255 Hz, and the first torsion mode at328 Hz.
The wind-on response at a Mach number,M = 0.80, and
low incidence shows similar aeroelastic modes resulting from the wind-off structural modes, with an additional
peak at114 Hzand thought to be the second harmonic of
the first bending mode.
2.2
Instrumentation and Data Acquisition
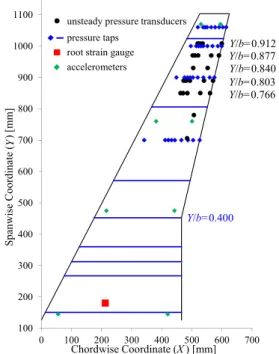
A wide range of measurements were obtained with sev-eral techniques. Starting with the model’s instrumenta-tion, it was equipped with a total of 274 static pressure taps, 27 unsteady pressure transducers, 8 accelerometers and a root strain gauge, as shown in Fig. 1. The
un-steady signals were acquired at100 kHzusing the ARA
dynamic data acquisition system (DDAS). Total aero-dynamic forces and moments were measured with a 5-component strain gauge balance.
In addition, a DPSP system was employed to capture the 3D flow development. Critically, this allowed surface pressure measurements over almost the entire wing with high spatial and temporal resolution, permitting deeper insight into the flow physics governing transonic buf-fet. Two high-speed Vision Research Phantom v1611 and v1610 synchronised cameras were used, one for each sur-face. The data points were recorded at 4000
frames-per-second (fps) for5 s, except for some data points of the
clean configuration filmed at2000 fpsfor10 s. The
cam-era resolution is1280×800pixels, equivalent to around
1.3 pixel/mm on the wing, a bit depth of 12 bits and an
exposure time of 150-250µs.
2.3
Experimental Configurations
Buffet control was investigated by testing two configura-tions with vane VGs in addition to the clean wing. The first control configuration, referred to as the full VG con-figuration, consisted of 30 VGs at 32% chord, located be-tween 63% and 91% semi-span. In the second control configuration, 3 out of 4 VGs were removed, leaving 8 VGs in the sparse VG configuration. The VGs were de-signed for maximum separation control rather than min-imum drag, based on [22]. The VGs were set toed-in,
co-rotating at 17◦ with respect to the fuselage
centre-line, such that the vane angle was 25◦, based on a local
flow angle calculation of 8◦inboard. The VG height of
1.3 mmis based on the estimated boundary-layer
thick-ness upstream of the shock location at buffet onset at
M = 0.80. The VGs have a bottom length of5 mm,
taper ratio of 0.6, aspect ratio of 1.3 and 60◦ sweep. In
the full VG array, the spanwise spacing is equal to10 mm
resulting in a spanwise spacing to height ratio of 7.7.
100 200 300 400 500 600 700 800 900 1000 1100 0 100 200 300 400 500 600 700 Sp an w ise Coo rd inate (Y ) [ m m ] Chordwise Coordinate (X) [mm]
unsteady pressure transducers pressure taps
root strain gauge accelerometers Y/b=0.766 Y/b=0.803 Y/b=0.840 Y/b=0.877 Y/b=0.912 Y/b=0.400
Each configuration was tested at a range of Mach num-bers between 0.70-0.84, and several angles of attack
be-tween 0◦ and well beyond buffet onset at around 8◦. A
more complete description of the experimental setup is reported in [18].
3.
DATA POST-PROCESSING
This paper presents data obtained at one Mach number,
M = 0.80, and focuses on buffet onset and initial rise in
buffeting levels, with and without VGs. Transonic buf-fet is an unsteady phenomenon and this paper focuses on the analysis of unsteady pressure data obtained both with unsteady pressure transducers and DPSP.
With regards to the unsteady pressure transducers, power spectral densities (PSDs) were computed by Welch’s method with a Hanning window and 50%
over-lap. The segment length was 16,384 giving a
fre-quency resolution of6.1 Hz. The DPSP images were
pre-processed to provide pressure at each pixel and time step using the procedure described in [18]. This involves im-age alignment to account for small camera movements and normalisation to correct for changes in image inten-sity. The latter was minimised by using a wind-on to wind-off ratio at the same incidence. The pressure was then computed based on a least-squares curve fit between the image intensity ratio and the static pressure taps.
Proper Orthogonal Decomposition (POD) was applied to the pressure snapshots using the vector-based approach
available in the modred library [23]. The mean flow
field was subtracted beforehand to highlight the unsteady flow features and 10,000 snapshots were used. POD modes have a spatial and temporal component and the frequency content of each mode was extracted from the PSDs of the temporal amplitudes using Welch’s method. The parameters were the same as in the transducer data processing, except that the segment length was 1000 and
500 for the 4000 fps and 2000 fps data points,
respec-tively, resulting in a frequency resolution of4 Hz.
4.
RESULTS AND ANALYSIS
4.1
Experimental Buffet Onset Indication
In order to perform comparisons between the different configurations, it is important to define the buffet onset incidence. Ref. [18] studied several buffet onset indica-tors [24], focusing on the clean wing data. Aerodynamic indicators generally rely on the assumption that a clear deviation from a smooth low-incidence trend occurs due to significant flow separation. For this particular wing, similar buffet onset angles were obtained based on the di-vergence of the strain gauge and accelerometer response, and aerodynamic indicators based on trailing edge (TE) pressure divergence at 80% span and lift-curve slope re-duction. Indicators based on the axial force and pitching moment were less reliable. It should be noted that the strain gauge directly measures the wing’s bending and is the most reliable experimental indicator. Moreover, local criteria such as TE pressure divergence require separation
to occur first at the TE, and can depend strongly on the spanwise location where this occurs, which is expected to vary between the clean and VG configurations.
In this paper, the root-mean-square (RMS) root strain gauge divergence was chosen to define buffet onset for the clean and VG cases. The RMS of the root strain gauge response was computed from the DDAS signal, recorded
over10 s. The signal was band-pass filtered between
22-90 Hz to isolate the response to wing first bending mode and is in arbitrary units. The break point and hence buffet onset was taken as the cross-over point between linear trends at low-incidence and the initial rise in buffeting levels. This can be seen in Fig. 2 which presents the data points for both clean and VG configurations. The curve fitting is based on the fine-pitch runs, whereas the data points having DPSP data, acquired during coarser-pitch runs, are superimposed in the plot. Therefore, the buffet
onset angle is 2.7◦ for the clean wing, with the sparse
VG array delaying onset by 0.2◦and the full VG array by
0.4◦. Furthermore, the linear trend slopes of the VG cases
are lower, implying that the VGs become more effective in reducing the buffeting levels with increasing incidence, until the RMS levels reach a plateau.
1.5 2.0 2.5 3.0 3.5 4.0 Angle of Attack (α) [deg]
0.2 0.3 0.4 0.5 0.6 0.7 0.8 Root Strain Gauge RMS Clean VG Full VG Sparse 0.9
Figure 2: RMS of root strain gauge signal for all three configurations. (Filled symbols represent DPSP points; unfilled symbols DDAS points)
4.2
Unsteady Transducers Data Analysis
Results obtained for the clean wing are presented first, in order to introduce the buffet characteristics for this particular wing. Fig. 3 shows the chordwise PSDs at
η= 0.80at buffet onset, whereηis the non-dimensional
span,η =Y /b. The transducer atx/c = 0.51shows the
highest energy level, indicating the location of the shock;
xdenotes the local chordwise coordinate,x=X−XLE,
whilecdenotes the local chord length,c =XTE−XLE.
A broadband bump, typical of 3D buffet, ranging
be-tween 50 to 140 Hz (0.05 ≤ St ≤ 0.15) is evident,
whereSt denotes the Strouhal number based on MAC.
The transducers at 80% chord and at the trailing edge start to show increasing energy levels at buffet onset, centred
at lower frequencies at around70 Hz. The tone at160 Hz
corresponds to the wind-tunnel fan passing frequency at
M = 0.80. At this buffet onset incidence, analysis at
the other spanwise stations results in similar frequency spectra having a broadband bump over the same range.
The frequency peak centred around70 Hz is consistent
across the span covered by the transducers between 77% and 91%.
0 100 200 300 400 500 Frequency (f) [Hz] 0 1000 2000 3000 4000 5000 6000 7000 PSD [P a 2/Hz]
DDAS Clean Wing:M=0.80,α=2.73◦ η=0.80,x/c=0.38 η=0.80,x/c=0.43 η=0.80,x/c=0.51 η=0.80,x/c=0.80 η=0.80,x/c=1.00
Figure 3: Chordwise PSDs at 80% span,α= 2.73◦
On the other hand, at higher angles of attack between
2.9◦ and 3.3◦, the spanwise frequency spectra across
the shock reveal that the prominent frequency within the broadband bump changes across the span. Fig. 4 depicts the PSDs along the shock in the spanwise direction at
3.3◦incidence. This shows that the peak at 77% and 80%
span is at70 Hz, whereas this shifts to110 Hzat 88% and
91% span. It should be noted that the local chord length of this tapered wing between the most inboard and
out-board transducers varies between0.173 mand0.126 m,
with the latter being less than half the MAC. This im-plies that the Strouhal number of these peaks, when based on the local chord, is around 0.05 at both spanwise lo-cations, which is close to the values typically reported for 2D buffet. Furthermore, at this incidence which is
0.6◦ above onset, the PSDs indicate broadband, higher
frequency fluctuations between 200 and400 Hz. These
fluctuations tend to be more prominent closer to the tip. Moreover, while these are almost negligible at onset, the energy of this higher frequency unsteadiness at the shock increases with incidence, as shown in Fig. 5.
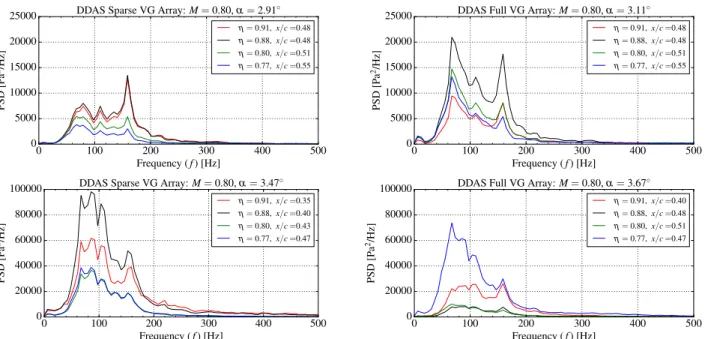
The analysis of the frequency spectra for the VG cases reveals similar peaks to the clean wing. Fig. 6 presents the frequency spectra across the shock for the VG cases. At buffet onset (upper plots), these spectra between 77% and 91% span are characterised by a broadband bump,
having their highest level around70 Hz. This is a
com-mon feature between the clean and VG cases and is coher-ent across the span. However, as the incidence increases,
the90 Hzand110 Hzpeaks become more energetic,
es-pecially closer to the tip. It should be noted that while the spectra show some levels of unsteadiness at higher
fre-quencies between180 Hzand250 Hz, the control cases
seem to be suppressing the fluctuations between 200 and
400 Hzthat appear in the clean wing configuration at 0.6◦
beyond onset, outlined previously.
The chordwise location of the shock moves upstream with increasing angle of attack. This is highlighted by the transducers’ RMS levels, shown in Fig. 7. These are computed at 80% span, as in Fig. 3. This shows that the
shock only reaches 43% chord at 2.9◦. At 3.3◦, the shock
moves further upstream and exhibits broader chordwise oscillations, with both transducers at 38% and 43% chord registering increased RMS levels. Furthermore, the RMS at 80% chord and at the trailing edge increases steadily with incidence, indicating greater levels of unsteadiness associated with separated flow beyond buffet onset.
0 100 200 300 400 500 Frequency (f) [Hz] 0 20000 40000 60000 80000 100000 120000 140000 160000 PSD [P a 2/Hz]
DDAS Clean Wing:M=0.80,α=3.30◦ η=0.91,x/c=0.40 η=0.88,x/c=0.35 η=0.80,x/c=0.38 η=0.77,x/c=0.42
Figure 4: PSDs corresponding to the shock along the
span,α= 3.30◦ 0 100 200 300 400 500 Frequency (f) [Hz] 0 20000 40000 60000 80000 100000 PSD [P a 2/Hz] KA12(η=0.91,x/c=0.40) α=2.93◦,M=0.80 α=3.12◦,M=0.80 α=3.30◦,M=0.80
Figure 5: Effect of incidence on the PSDs corresponding
to the shock,η = 91%,x/c = 0.40. ()KArefers to the
DDAS channel number for reference.)
The influence of the VG arrays on the pressure fluc-tuation levels can be seen in Fig. 7b and 7c. These are computed for both VG configurations at 80% span, from
buffet onset to 0.6◦ above onset. First, both VG arrays
move the shock further aft, also corroborated by the static pressure tap data. In fact, the shock does not reach the
up-stream transducer at 38% chord, even at 0.6◦above onset.
Secondly, the overall RMS levels are lower, suggesting a reduction in the shock oscillation amplitude. It is also in-teresting to note that for the VG cases, the unsteadiness
at the TE does not diverge at 0.6◦above onset, as in the
clean wing configuration.
4.3
DPSP Data Analysis - POD
One of the main advantages of the DPSP technique is that it enables a continuous visualisation of the surface pres-sure fluctuations. A POD analysis was performed on the mean-subtracted pressure snapshots, hereinafter referred to as AC pressure, as a means of identifying the dominant structures in the flow.
It should be noted that the number of resulting POD modes is equal to the number of snapshots used - 10,000. The method ranks the modes based on the magnitude of the eigenvalues, or POD energy. Visualisation of the spatial component shows that in all the cases, the dom-inant modes are either related to the structural response of the model or the shock unsteadiness across the span. Less dominant, higher-order modes are generally asso-ciated with smaller scale perturbations within the shock and fluctuations in the flow downstream. These become increasingly contaminated with noise, and even higher-order modes are just consumed by incoherent noise.
0 100 200 300 400 500 Frequency (f) [Hz] 0 5000 10000 15000 20000 25000 PSD [P a 2/Hz]
DDAS Sparse VG Array:M=0.80,α=2.91◦ η=0.91,x/c=0.48 η=0.88,x/c=0.48 η=0.80,x/c=0.51 η=0.77,x/c=0.55 0 100 200 300 400 500 Frequency (f) [Hz] 0 5000 10000 15000 20000 25000 PSD [P a 2/Hz]
DDAS Full VG Array:M=0.80,α=3.11◦ η=0.91,x/c=0.48 η=0.88,x/c=0.48 η=0.80,x/c=0.51 η=0.77,x/c=0.55 0 100 200 300 400 500 Frequency (f) [Hz] 0 20000 40000 60000 80000 100000 PSD [P a 2/Hz]
DDAS Sparse VG Array:M=0.80,α=3.47◦ η=0.91,x/c=0.35 η=0.88,x/c=0.40 η=0.80,x/c=0.43 η=0.77,x/c=0.47 0 100 200 300 400 500 Frequency (f) [Hz] 0 20000 40000 60000 80000 100000 PSD [P a 2/Hz]
DDAS Full VG Array:M=0.80,α=3.67◦ η=0.91,x/c=0.40 η=0.88,x/c=0.48 η=0.80,x/c=0.51 η=0.77,x/c=0.47
Figure 6: Frequency spectra across the shock at buffet onset and 0.6◦above onset; sparse VG array (left), full VG (right).
0.3 0.4 0.5 0.6 0.7 0.8 0.9 1.0 Chordwise location (x/c) 0 500 1000 1500 2000 2500 3000 3500 4000 Signal RMS [P a] KA41−KA45:η=0.80 α=2.73◦ α=2.93◦ α=3.12◦ α=3.30◦
(a) Clean configuration, 80% span.
0.3 0.4 0.5 0.6 0.7 0.8 0.9 1.0 Chordwise location (x/c) 0 500 1000 1500 2000 2500 3000 3500 4000 Signal RMS [P a] KA41−KA45:η=0.80 α=2.91◦ α=3.09◦ α=3.28◦ α=3.47◦
(b) Sparse VG configuration, 80% span.
0.3 0.4 0.5 0.6 0.7 0.8 0.9 1.0 Chordwise location (x/c) 0 500 1000 1500 2000 2500 3000 3500 4000 Signal RMS [P a] KA41−KA45:η=0.80 α=3.11◦ α=3.29◦ α=3.47◦ α=3.67◦
(c) Full VG configuration, 80% span.
Figure 7: Influence of VG configurations on unsteady transducer RMS levels at buffet onset and above.
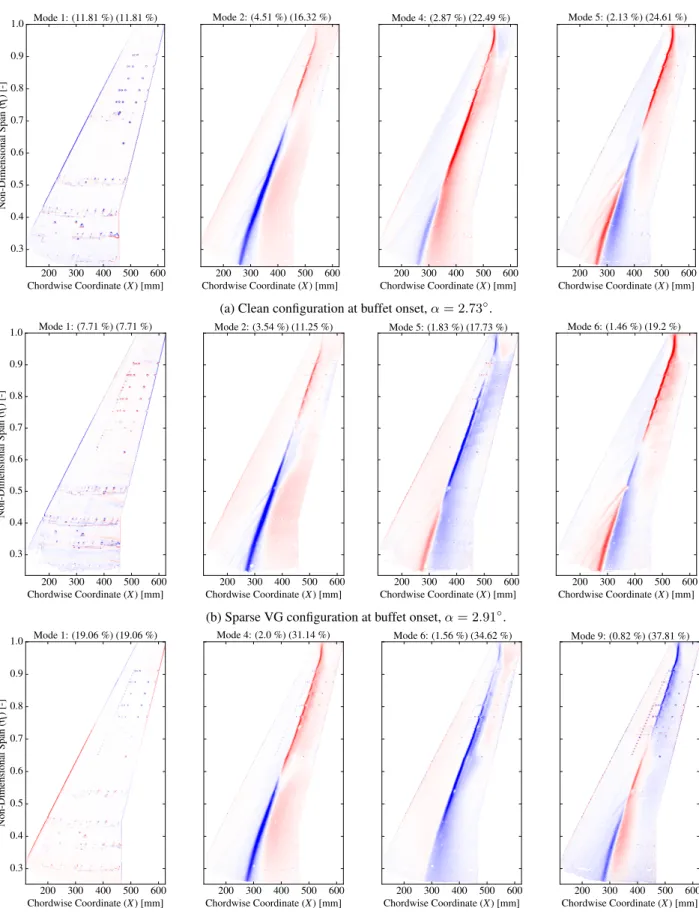
The aim of this section is to show typical modes and highlight consistency between this analysis technique and data from the unsteady transducers. A number of domi-nant modes at buffet onset for the clean and VG config-urations can be seen in Fig. 8. At buffet onset, mode 1, having the highest eigenvalue, is dominated by noise around the model’s instrumentation. This suggests a re-lation with the structural response, as confirmed by the temporal component of the mode, shown in Fig. 9. The structural response can be seen in other modes, such as mode 3 which is not included in Fig. 8. The dominant shock unsteadiness is then picked out by the next modes. In the case of the clean wing, mode 2 has greater spa-tial amplitudes inboard, whereas mode 4 is more related to the midspan region of the shock. Mode 5 then shows greater unsteadiness outboard and highlights the shock unsweeping near the tip, outboard of 92% span. The anal-ysis of the temporal components in Fig. 9a shows that modes 2 and 4 have similar frequency content, having a broadband bump centred at 68 Hz. This bump then shifts
to higher frequency centred around 100 Hzin mode 5.
This frequency content of the shock unsteadiness, and its dependence on the span, is consistent with the unsteady transducer data. The location of the transducers can also be seen in the spatial plots, since these were covered by a circular patch as a means of protection from the paint.
A similar pattern evolves in the way the shock un-steadiness is captured by the modes in both of the VG configurations. Once again, there is good agreement between the transducer PSDs across the shock and the modes’ temporal content, presented in Figs. 6 and 9, re-spectively. Furthermore, the POD energy of the shock unsteadiness modes in the VG cases is lower compared to the clean wing, corroborating the decreased RMS lev-els in the unsteady transducer signals for the VG cases.
200 300 400 500 600 Chordwise Coordinate (X) [mm] 0.3 0.4 0.5 0.6 0.7 0.8 0.9 1.0 Non-Dimensional Span ( η )[-] Mode 1: (11.81 %) (11.81 %) 200 300 400 500 600 Chordwise Coordinate (X) [mm] Mode2:(4.51%)(16.32%) 200 300 400 500 600 Chordwise Coordinate (X) [mm] Mode4:(2.87%)(22.49%) 200 300 400 500 600 Chordwise Coordinate (X) [mm] Mode5:(2.13%)(24.61%)
(a) Clean configuration at buffet onset,α= 2.73◦.
200 300 400 500 600 Chordwise Coordinate (X) [mm] 0.3 0.4 0.5 0.6 0.7 0.8 0.9 1.0 Non-Dimensional Span ( η )[-] Mode 1: (7.71 %) (7.71 %) 200 300 400 500 600 Chordwise Coordinate (X) [mm] Mode2:(3.54%)(11.25%) 200 300 400 500 600 Chordwise Coordinate (X) [mm] Mode5:(1.83%)(17.73%) 200 300 400 500 600 Chordwise Coordinate (X) [mm] Mode 6: (1.46 %) (19.2 %)
(b) Sparse VG configuration at buffet onset,α= 2.91◦.
200 300 400 500 600 Chordwise Coordinate (X) [mm] 0.3 0.4 0.5 0.6 0.7 0.8 0.9 1.0 Non-Dimensional Span ( η )[-] Mode 1: (19.06 %) (19.06 %) 200 300 400 500 600 Chordwise Coordinate (X) [mm] Mode4:(2.0%)(31.14%) 200 300 400 500 600 Chordwise Coordinate (X) [mm] Mode6:(1.56%)(34.62%) 200 300 400 500 600 Chordwise Coordinate (X) [mm] Mode9:(0.82%)(37.81%)
(c) Full VG configuration at buffet onset,α= 3.11◦.
Figure 8: Spatial component of dominant modes related to the structural response and spanwise shock unsteadiness. The spatial amplitudes are coloured from blue to red, representing opposite signs. The numbers in parentheses represent the POD energy of the mode and the cumulative POD energy from the first mode until the respective mode.
0 100 200 300 400 500 Frequency (f) [Hz] 0.0 0.5 1.0 1.5 2.0 2.5 PSD of Temporal Amplitudes ×10−6 Mode 1 Mode 2 Mode 4 Mode 5
(a) Clean configuration at buffet onset,α= 2.73◦.
0 100 200 300 400 500 Frequency (f) [Hz] 0.0 0.5 1.0 1.5 2.0 2.5 PSD of Temporal Amplitudes ×10−6 Mode 1 Mode 2 Mode 5 Mode 6
(b) Sparse VG configuration at buffet onset,α= 2.91◦.
0 100 200 300 400 500 Frequency (f) [Hz] 0.0 0.5 1.0 1.5 2.0 2.5 PSD of Temporal Amplitudes ×10−6 Mode 1 Mode 4 Mode 6 Mode 9
(c) Full VG configuration at buffet onset,α= 3.11◦.
Figure 9: Temporal content of dominant POD modes re-lated to the structural response and shock unsteadiness.
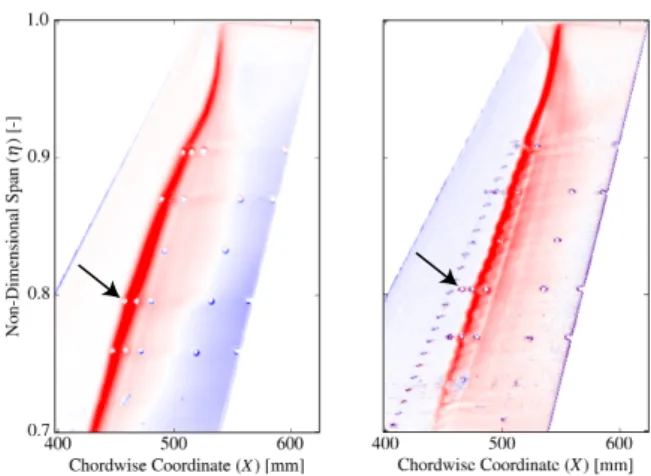
A qualitative analysis based on the spatial component highlights the interaction between the VG vortices and the shock, creating a wavy pattern along the shock, also observed in oil flow visualisations on the NASA Com-mon Research Model (CRM) under similar conditions [13]. Moreover, the further aft shock location as a result of the VGs can be directly observed with the DPSP data; this was not possible with the transducers. Furthermore, it is clear that the chordwise oscillation of the shock is reduced in the VG cases. These observations can be ap-preciated more at higher incidences. Fig. 10 compares
the clean and full VG case at 0.6◦ above buffet onset in
terms of outboard shock unsteadiness, as captured by one particular mode related to the latter. It can be observed that in the VG case the shock does not reach the most upstream transducers, consistent with the RMS levels in Fig. 7c. In addition, the degree of shock unsweeping is lower and occurs closer to the tip.
4.4
Spanwise Shock Motion Analysis
The qualitative assessment of the AC pressure snapshots reveals an apparent spanwise movement of pressure
un-Figure 10: Outboard shock unsteadiness as captured by
POD modes at 0.6◦above buffet onset; clean wing (left),
full VG configuration (right). Arrows indicate the most
upstream Kulite at 80% span,KA41.
steadiness along the shock, and also further downstream depending on the incidence. This section discusses the results of a spectral analysis performed along the shock in order to characterise this motion.
First, the pressure snapshots were reconstructed using POD modes that capture the shock unsteadiness, while excluding modes predominantly related to the structural response and incoherent camera noise. This results in a pressure time-series that still captures the spanwise shock motion but with much reduced noise. Then, the pressure signals from pixels corresponding to the chordwise loca-tion of the shock at several spanwise staloca-tions were ob-tained, based on the highest AC pressure.
Starting with the clean configuration, the pressure an-imations show inboard-running waves, propagating from the tip to the root along the shock. This inboard prop-agation starts below buffet onset and continues to occur during the first rise in buffeting levels. However, the na-ture of the spanwise motion changes with incidence. The cross power spectral densities (CPSDs) of the pixel pres-sure signals along the shock were computed as a means to quantify this motion, following similar work based on transducer data [7, 8]. It should be noted that throughout the incidence range discussed in this paper, commencing with the first rise in buffeting levels, high levels of co-herence, greater than 0.7, were obtained across the span typically between 60-110 Hz (results not shown explicitly
for brevity). Fig. 11 shows the phase variation at80 Hz,
around the centre of the broadband bump in the spectra, for the incidence range just below and above buffet on-set. The reference is taken at approximately 60% span and a mostly linear variation of the phase angle results, indicating a convective phenomenon [8]. The convection
velocity,Uc, is computed byUc = 2πf × ∆∆Yφ, where
f denotes the frequency in Hz,Y is the spanwise
coor-dinate in m (positive outboard), andφdenotes the phase
angle in radians.
Following this relation, the positive gradient in Fig. 11
implies a negative Uc, and hence inboard wave
0.4 0.5 0.6 0.7 0.8 0.9 1.0 Non-Dimensional Span (η) [-] −180 −120 −60 0 60 120 180 Phase Angle ( φ )[ ◦] Clean:α=2.54◦ Clean:α=2.73◦ Clean:α=2.93◦
Figure 11: Phase variation of the CPSDs at 80 Hz along the shock; clean configuration, just pre-onset, at onset and just post-onset (reference signal at around 60% span).
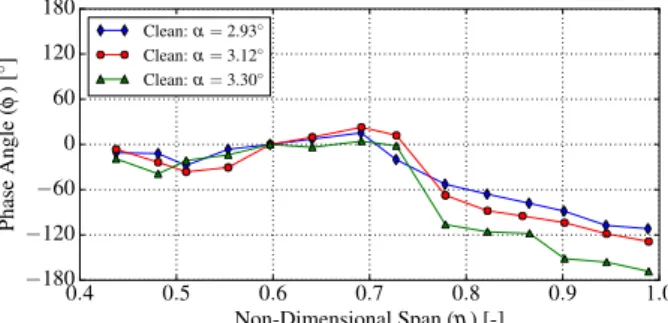
0.4 0.5 0.6 0.7 0.8 0.9 1.0 Non-Dimensional Span (η) [-] −180 −120 −60 0 60 120 180 Phase Angle ( φ )[ ◦] Clean:α=2.93◦ Clean:α=3.12◦ Clean:α=3.30◦
Figure 12: Phase variation at 216 Hz along the shock;
clean configuration at 0.2◦, 0.4◦and 0.6◦above onset.
the propagation is inboard from approximately 87% span, and shows signs of direction reversal towards the tip. The outboard propagation becomes more established above buffet onset. Furthermore, similar phase plots were ob-tained for other frequencies within the broadband bump, highlighting the same phenomenon (not included herein for brevity).
As the angle of attack is further increased, the same inboard/outboard propagation from around 87% span re-mains constant at the characteristic lower frequencies. However, the animations also show outboard travelling perturbations emanating from further inboard, starting
from 2.9◦ and becoming increasingly evident at 3.3◦
(0.6◦ above onset). At a higher frequency of 216 Hz,
shown in Fig. 12, the phase of the cross-spectra has an opposite gradient outboard of 70% span, suggest-ing that this higher frequency is related to these distinct outboard-travelling perturbations. It should be noted that the higher-frequency dynamics are intermittent and have
lower coherence levels, and only signals of at least2.5 s
enabled useful spectral analysis.
The same process was repeated using the unsteady transducer data to check for consistency. It can be seen in Fig. 13 that the phase variation between 77% and 91% span follows the same trend as in Fig. 11. It should be appreciated that while in this configuration the transducer data is able to capture the reversal in the propagation di-rection, this is not the case in the VG configurations, since the reversal occurs further outboard of the transducers, as discussed next. This highlights the greater insight into the flow physics that can be extracted from the DPSP data.
Fig. 14 presents a comparison between the clean and VG configurations at buffet onset, based on the phase
0.78 0.80 0.82 0.84 0.86 0.88 0.90 Non-Dimensional Span (η) [-] 0 5 10 15 20 25 30 35 40 Phase Angle ( φ )[ ◦] Clean Configuration:α=2.73◦
Figure 13: Phase variation at79 Hz based on unsteady
transducers’ data; clean configuration at buffet onset. This is consistent with that computed with DPSP data.
0.4 0.5 0.6 0.7 0.8 0.9 1.0 Non-Dimensional Span (η) [-] −180 −120 −60 0 60 120 180 Phase Angle ( φ )[ ◦] Clean:α=2.73◦ Sparse VG:α=2.91◦ Full VG:α=3.11◦
Figure 14: Phase variation at80 Hzat buffet onset for the
clean, sparse VG and full VG configurations.
variation at80 Hz. It can be seen that in both of the VG
configurations, the characteristic inboard-running waves are not being suppressed. However, a discontinuity in the slope between 60% and 65% span can be observed. This occurs in the region downstream of the most inboard VG at 63% span. Moreover, the slope in the region down-stream of the VGs (63-91% span) is lower than that in the inboard region, suggesting a higher convection speed in the region influenced by the VGs. This difference in slope is also evident in Fig. 15, which presents a
compar-ison between the three configurations at 0.4◦ above
on-set. The convection speed of the inboard-running waves
for the clean wing can be estimated at68 m/s(0.26U∞,
whereU∞is the freestream velocity). This lies between
the values reported in [7, 8]. With regards to the VG con-figurations, the convection speed is higher in the region downstream of the VGs. In the case of the sparse
ar-ray,Uc increases to 83 m/s(0.32U∞), and to117 m/s
(0.45U∞) in the full array. After the discontinuity
down-stream of the most inboard VG, in both cases the inboard
propagations then slow down to57 m/s. These values are
similar at buffet onset and at 0.4◦above onset.
Furthermore, while all three configurations show signs of outboard propagation near the tip, this occurs further outboard in the VG configurations, more evident above buffet onset in Fig. 15. In fact, in this case the rever-sal occurs outboard of the VGs (91% span) and might be related to the location of the shock unsweeping, which occurs further outboard in the VG configurations.
Although the spanwise motion at buffet onset is sim-ilar in the three configurations, that is mostly inboard-running waves, there are distinct differences as the inci-dence increases. It was highlighted that in the clean
con-0.4 0.5 0.6 0.7 0.8 0.9 1.0 Non-Dimensional Span (η) [-] −180 −120 −60 0 60 120 180 Phase Angle ( φ )[ ◦] Clean:α=3.12◦ Sparse VG:α=3.28◦ Full VG:α=3.47◦
Figure 15: Phase variation at80 Hzat 0.4◦ above onset
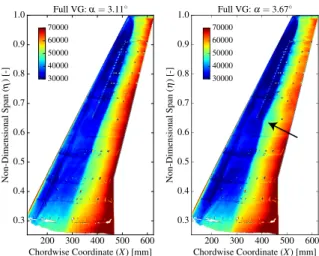
for the clean, sparse VG and full VG configurations. figuration, outboard-running propagations start to occur beyond buffet onset and seem to have higher frequency content than the more periodic lower-frequency, inboard-running waves. In the case of the full VG array, as the an-gle of attack increases and the shock moves upstream, the shock curves distinctively just downstream of the most inboard VG, as shown in Fig. 16. Moreover, the instanta-neous snapshots start to show outboard-running perturba-tions that seem to emanate from this area. This can also be observed in the sparse VG case, but to a lower extent. Identifying the frequency content of these propaga-tions is more difficult, since these are intermittent.
How-ever, the PSDs show a bump around 216 Hz and the
phase variation at this frequency has an opposite gradi-ent when compared to the lower frequencies, suggesting outboard propagation. Fig. 17 shows the phase variation
at 216 Hzfor the three configurations above buffet
on-set. There are lower coherence levels across the span at this frequency and a linear phase variation is less clear. In the case of the clean wing and sparse VG config-uration, outboard-running waves propagate outboard of around 70% span reaching the tip. In contrast, in the full VG configuration such propagations are limited between 70% and 80% span. These observations are in line with the qualitative assessment of the pressure snapshots. In the full VG case, it seems that the predominant
inboard-200 300 400 500 600 Chordwise Coordinate (X) [mm] 0.3 0.4 0.5 0.6 0.7 0.8 0.9 1.0 Non-Dimensional Span ( η )[-] Full VG:α=3.11◦ 30000 40000 50000 60000 70000
Figure 16: Mean surface pressure distribution in Pa. Full
VG configuration at buffet onset (left) and 0.6◦ above
buffet onset (right).
0.4 0.5 0.6 0.7 0.8 0.9 1.0 Non-Dimensional Span (η) [-] −180 −120 −60 0 60 120 180 Phase Angle ( φ )[ ◦] Clean:α=3.12◦ Sparse VG:α=3.47◦ Full VG:α=3.47◦
Figure 17: Phase variation at216 Hzfor the three
config-urations above buffet onset.
running waves slow down and ultimately stop the higher-frequency perturbations.
5.
CONCLUSION
This paper has presented further analysis of the buffet-focussed BUCOLIC experimental dataset and has dis-cussed the influence of vortex generators in delaying buf-fet onset. The unsteady aspects of 3D shock bufbuf-fet have been analysed using data from both unsteady transducers and dynamic pressure-sensitive paint (DPSP). The clean wing and two configurations with vane vortex generators (VGs) have been examined.
Model structural response data indicates that the sparse VG array (8 VGs), and the full VG array (30 VGs) delay
buffet onset by 0.2◦and 0.4◦, respectively. The frequency
content of the shock unsteadiness is characterised by a broadband bump, typical of 3D buffet. The characteristic frequencies are found to depend on both spanwise loca-tion and angle of attack, as revealed both with unsteady transducer signal processing and a proper orthogonal de-composition of the DPSP data. It has been shown how the DPSP data is invaluable in revealing details of the 3D development of the shock structure and spanwise motion along the shock. In effect, the DPSP data is producing the equivalent of one transducer per image pixel.
In all configurations at buffet onset, the frequency
con-tent of the broadband bump between 50-150 Hz,
equiv-alent to Strouhal numbers of 0.05-0.15 based on MAC, is lower than typical values reported for 3D buffet. Fur-thermore, the peak frequency within the broadband range shifts to higher frequency near the tip. The VG con-figurations move the shock downstream, while reduc-ing the chordwise extent of the shock motion. A wavy shock pattern results due to interactions with the vor-tices, as directly visualised with DPSP. Moreover, within the incidence range analysed, the VGs suppress
higher-frequency unsteadiness between 200 and400 Hzthat
ap-pears at 0.6◦ above buffet onset in the clean wing
con-figuration. The spanwise-travelling pressure waves along the shock have been characterised by performing a spec-tral analysis. This reveals inboard-running waves along the shock, at the frequencies within the broadband range. These propagate faster downstream of the VGs, with the convection velocity almost doubling in the full VG case, compared to the clean wing. As the incidence
increases, distinct, outboard-running, higher frequency propagations appear at different spanwise locations de-pending on the configuration, which are intermittent and less coherent across the span.
This study contributes to the understanding of the com-plex flow physics of 3D shock buffet and has further de-scribed pressure wave propagations along the shock, with and without the influence of VGs. These waves have been analysed over a wider spanwise range when compared to previous studies relying on discrete transducers, as a re-sult of using DPSP. This analysis has been limited to the shock unsteadiness and has not completely explained the flow physics at buffet onset. Further work needs to be done in the region aft of the shock to analyse the unsteadi-ness associated with the separated flow.
ACKNOWLEDGEMENTS
The authors would like to acknowledge Simon Lawson from ARA for preparing the DPSP data and providing the experimental details and Doug Greenwell also from ARA for useful discussions. The datasets used herein were generated with funding from the European Union’s Seventh Framework Programme (FP7/2007-2013) for the Clean Sky Joint Technology Initiative under grand agree-ment no. 336948. The first author is jointly funded by the University of Liverpool and ARA.
REFERENCES
[1] L. Jacquin, P. Molton, S. Deck, B. Maury, and D. Soulevant, “Experimental Study of Shock
Oscil-lation over a Transonic Supercritical Profile”,AIAA
J., vol. 47, no. 9, pp. 1985–1994, Sep. 2009.
[2] B. H. K. Lee, “Oscillatory shock motion caused by
transonic shock boundary-layer interaction”, AIAA
J., vol. 28, no. 5, pp. 942–944, May 1990.
[3] J. B. McDevitt and A. F. Okuno, “Static and dy-namic pressure measurements on a NACA 0012 air-foil in the Ames high Reynolds number facility”, NASA TP 2485, Jun. 1985.
[4] F. Roos, “The buffeting pressure field of a high-aspect-ratio swept wing”. AIAA-1985-1609, 1985. [5] B. Benoit and I. Legrain, “Buffeting prediction for transport aircraft applications based on unsteady pressure measurements”. AIAA-1987-2356, 1987. [6] P. Molton, J. Dandois, A. Lepage, V. Brunet, and R. Bur, “Control of Buffet Phenomenon on a
Tran-sonic Swept Wing”,AIAA J., vol. 51, no. 4, pp. 761–
772, Apr. 2013.
[7] S. Koike, M. Ueno, K. Nakakita, and A. Hashimoto, “Unsteady Pressure Measurement of Transonic Buffet on NASA Common Research Model”. AIAA-2016-4044, 2016.
[8] J. Dandois, “Experimental study of transonic buffet
phenomenon on a 3D swept wing”, Phys. Fluids,
vol. 28, no. 016101, pp. 1–17, Jan. 2016.
[9] M. Iovnovich and D. E. Raveh, “Numerical Study of
Shock Buffet on Three-Dimensional Wings”,AIAA
J., vol. 53, no. 2, pp. 449–463, Feb. 2015.
[10] F. Sartor and S. Timme, “Delayed Detached–Eddy Simulation of Shock Buffet on Half Wing–Body
Configuration”,AIAA J., pp. 1–11, Dec. 2016.
[11] J. Dandois, P. Molton, A. Lepage, A. Geeraert, V. Brunet, J. B. Dor, and E. Coustols, “Buffet characterization and control for turbulent wings”,
AerospaceLab, no. 6, pp. 1–17, 2013.
[12] S. Timme and F. Sartor, “Passive control of tran-sonic buffet onset on a half wing-body configura-tion”. IFASD-2015-088, Jul. 2015.
[13] S. Koike, K. Nakakita, T. Nakajima, S. Koga, M. Sato, H. Kanda, K. Kusunose, M. Murayama, Y. Ito, and K. Yamamoto, “Experimental Investiga-tion of Vortex Generator Effect on Two- and Three-Dimensional NASA Common Research Models”. AIAA-2015-1237, 2015.
[14] Y. Ito, K. Yamamoto, K. Kusunose, S. Koike, K. Nakakita, M. Murayama, and K. Tanaka, “Effect
of Vortex Generators on Transonic Swept Wings”,J.
Aircraft, vol. 53, no. 6, pp. 1890–1904, Nov. 2016. [15] J. W. Gregory, H. Sakaue, T. Liu, and J. P. Sullivan,
“Fast Pressure-Sensitive Paint for Flow and
Acous-tic DiagnosAcous-tics”, Annu. Rev. Fluid Mech., vol. 46,
no. 1, pp. 303–330, Jan. 2014.
[16] M.-C. Merienne, Y. Le Sant, F. Lebrun, B. Deleglise, and D. Sonnet, “Transonic Buffeting Investigation using Unsteady Pressure-Sensitive Paint in a Large Wind Tunnel”. AIAA-2013-1136, 2013.
[17] Y. Sugioka, D. Numata, K. Asai, S. Koike, K. Nakakita, and S. Koga, “Unsteady PSP Measure-ment of Transonic Buffet on a Wing”. AIAA-2015-0025, 2015.
[18] S. Lawson, D. Greenwell, and M. K. Quinn, “Char-acterisation of Buffet on a Civil Aircraft Wing”. AIAA-2016-1309, 2016.
[19] M. Pastuhoff, D. Yorita, N. Tillmark, P. H. Alfreds-son, and K. Asai, “Modal Analysis of Pressure
Sen-sitive Paint Data”, in9th Int. Conf. on Flow
Dynam-ics, 2012, pp. 164–165.
[20] S. Gordeyev, N. De Lucca, E. J. Jumper, K. Hird, T. J. Juliano, J. W. Gregory, J. Thordahl, and D. J. Wittich, “Comparison of unsteady pressure fields on turrets with different surface features
us-ing pressure-sensitive paint”, Exp. Fluids, vol. 55,
no. 1, Jan. 2014.
[21] L. Masini, “Advanced methods for the analysis of unsteady data”, M.Sc. thesis, Cranfield University, Aug. 2016.
[22] “Vortex generators for control of shock-induced separation”, ESDU 93024-93026, Feb. 1995. [23] B. A. Belson, J. H. Tu, and C. W. Rowley,
“Algo-rithm 945: Modred—A Parallelized Model
Reduc-tion Library”, ACM Trans. Math. Softw., vol. 40,
no. 4, pp. 1–23, Jul. 2014.
[24] “An introduction to aircraft buffet and buffeting”, ESDU 87012, Jul. 1987.

![Figure 4: PSDs corresponding to the shock along the span, α = 3.30 ◦ 0 100 200 300 400 500 Frequency ( f ) [Hz]020000400006000080000100000PSD[Pa2/Hz]KA12 (η = 0.91, x/c = 0.40) α = 2.93 ◦ , M = 0.80α = 3.12◦, M = 0.80α = 3.30◦, M = 0.80](https://thumb-us.123doks.com/thumbv2/123dok_us/1876496.2773976/4.892.93.430.83.247/figure-psds-corresponding-shock-span-frequency-hz-psd.webp)