Education Policy Analysis Archives
Volume 10 Number 16 March 20, 2002 ISSN 1068-2341
A peer-reviewed scholarly journal
Editor: Gene V Glass
College of Education Arizona State University
Copyright 2001, the EDUCATION POLICY ANALYSIS ARCHIVES . Permission is hereby granted to copy any article
if EPAA is credited and copies are not sold. Articles appearing in EPAA are abstracted in the Current Index to Journals in Education by the ERIC Clearinghouse on
Assessment and Evaluation and are permanently archived in Resources in Education.
Quantifying Quality: What Can the
U.S. News and World Report
Rankings Tell us About the Quality of Higher Education?
Marguerite Clarke
Boston College
Citation: Clarke, M. (2002, March 20). Quantifying Quality: What can the U.S. News and World Report rankings tell us about the quality of higher education? Education Policy Analysis Archives, 10(16). Retrieved [date] from http://epaa.asu.edu/epaa/v10n16/.
Abstract
Since their first appearance in 1983, the U.S. News and World Report
rankings of colleges and graduate schools have generated much discussion and debate, from some declaring them among the best
rankings ever published to others describing them as shallow, inaccurate, and even dangerous. The research presented here addresses two of the most common criticisms of the methodology used to produce these rankings. In particular, this study answers the following questions: What is the extent of change in U.S. News' ranking formulas across years and what are the implications for interpreting shifts in a school's rank over time? How precise is the overall score that U.S. News uses to rank schools and what are the implications for assigning schools to discrete ranks? Findings confirm critic's concerns in each of these areas, particularly in relation to the ranking of graduate schools of education.
Based on these results, five recommendations are made for improving the interpretability and usefulness of the rankings.
Introduction
Every year, U.S. News and World Report's (U.S. News) rankings of the academic quality of colleges and graduate schools hit the newsstands (Note 1). Their arrival brings delight to some and dismay to others, depending on whether their institution rose or fell in the quality ratings. An improved ranking can lead to increased donations from proud alumni and more and better qualified students in next year's applicant pool (Monks and Enhrenberg, 1999). A fall can lead to tighter alignment of institutional benchmarks and goals with ranking criteria and pressure on admissions staff to bring in "better" applicants (Mufson, 1999). All the while, a question goes unanswered: What do these rankings really tell us about the quality of higher education?
As a step toward answering this question, I examine two common criticisms of the methodology that U.S. News uses to rank colleges and graduate schools. These are: (1) constant changes to the formula make it impossible to interpret yearly shifts in a school's rank in terms of change in its relative academic quality (Levin, 1999; Pellegrini, 1999), and (2) the score used to assign schools to ranks is overly precise, creating a vertical column where a group might more properly exist
(Machung, 1998; Smetanka, 1998). The first section of this article gives a brief introduction to the
U.S. News rankings as well as the questions addressed by this study. The next section outlines the methodology used to answer these questions and the results of the analyses. The final section presents conclusions and recommendations.
Before proceeding, a caveat is in order. While many have questioned the overall concept of academic quality rankings as well as the validity of the different indicators and weights used, I suspend judgment on these issues to focus on the extent to which methodological problems may impact the interpretation of the U.S. News rankings.
Background on the
U.S. News
Rankings
U.S. News published its first rankings of the academic quality of colleges in 1983, the same year that the National Commission on Excellence in Education released A Nation at Risk, its influential report blasting the quality of education in America. Based on a survey of college presidents, the magazine listed Stanford, Harvard, and Yale as the top three national universities and Amherst, Swarthmore, and Williams as the top three national liberal arts colleges. By 1987, U.S. News had moved to a multidimensional approach, weighting and combining information on faculty
accomplishments, student achievements, and institutional academic resources to produce an overall score on which to rank colleges. Rankings of graduate schools of business, engineering, law, and medicine/primary-care also appeared in this year and used a similar weight-and-sum approach (rankings of graduate schools of education did not appear until 1994).
The most recent rankings still use this basic approach. At the undergraduate level, schools are categorized by mission and region (e.g., national universities, national liberal arts colleges, regional universities, and regional liberal arts colleges). Up to sixteen pieces of information are collected on schools in each category, including academic reputation; freshmen retention and graduation rates; average test scores for entering students; per-student spending; and alumni-giving rate. These indicators are standardized, weighted, and summed to produce an overall score on which to rank
schools in each category against their peers.
At the graduate level, schools are categorized by type—business, education, engineering, law, and medicine/primary-care. Depending on the type of school, data on up to fourteen
indicators—including test scores, research expenditures, graduate employment rates, and
reputation—are collected. Similar to the undergraduate rankings, the indicators are standardized, weighted, and summed to produce an overall score on which to rank schools in each category against their peers. Detailed information on the indicators and methodology that U.S. News uses to rank colleges and graduate schools is found in Appendix A. (Note 2)
Criticisms of the
U.S. News
Rankings
Almost two decades after their first publication, the college and graduate school rankings are among U.S. News' top issues in terms of sales generated (K. Crocker, personal communication, March 19, 1999). This demand has made them the focus of much criticism and debate, especially among the institutions that are the subject of the rankings. In addition to questioning the overall concept of ranking higher education institutions, much criticism has focused on the methodology used to produce the rankings. Gerhard Casper, then President of Stanford University, focused on some of these methodological concerns in a letter of protest he wrote to the editor of U.S. News in 1996:
Could there not, though, at least be a move toward greater honesty with, and service to, your readers by moving away from the false precision? Could you not do away with rank ordering and overall scores, thus admitting that the method is not nearly that precise and that the difference between #1 and #2 - indeed, between #1 and #10 - may be statistically insignificant? Could you not, instead of tinkering to "perfect" the weightings and formulas, question the basic premise? Could you not admit that quality may not be truly quantifiable, and that some of the data you use are not even truly available (e.g., many high schools do not report whether their graduates are in the top 10% of their class)? Parents are confused and looking for guidance on the best choice for their particular child and the best investment of their hard-earned money. Your demonstrated record gives me hope that you can begin to lead the way away from football-ranking mentality and toward helping to inform, rather than mislead, your readers. (Note 3)
Casper's questions about the "football ranking mentality" employed by U.S. News go to the heart of the debate over college and graduate school rankings. If, as Casper states, "the difference between #1 and #2 - indeed, between #1 and #10 - may be statistically insignificant," what are the
implications for the way in which the overall scores for schools are used to put them in rank order? In addition, if the weights and formula are constantly being "tinkered" with, how should one then interpret change in a school's rank from year to year?
Others have voiced these methodological concerns. In particular, critics have noted that yearly formula changes make it almost impossible to interpret shifts in a school's rank in terms of change in its relative academic quality: a college that is ranked 4th one year and 7th the next may have had no change in its performance relative to other schools, yet still have moved because of changes in the ranking methodology (Levin, 1999; Machung, 1998; Pellegrini, 1999). U.S. News' response to this issue has been that they prefer to make incremental changes every year to produce the "best possible rankings" than to use the same indicators every year to facilitate precise year-to-year comparisons.
Critics have also pointed out that the use of overall scores to rank schools magnifies small—and often insignificant—differences among schools, and that small changes by the school or the magazine can move a college half a dozen places up or down the ranking list (Crenshaw, 1999).
U.S. News acknowledged this issue in 1998 when it began rounding overall scores to the nearest whole number in recognition, the editors noted, of the fact that small differences after the decimal point may reflect non-significant differences between schools (Thompson and Morse, 1998). Subsequently, the number of schools tied for overall score (and thus rank) increased dramatically. While much criticism and debate has focused on the methodology used to produce the rankings, the majority of research has focused on the extent to which the rankings are used by students and parents (e.g., Art and Science Group, 1995; McDonough, Antonio, Walpole, and Perez, 1998) or their effect on institutions (e.g., Monks and Ehrenberg, 1999). The research presented here addresses the two methodological concerns outlined above. In particular, this study answers the following questions:
What is the extent of change in U.S. News' ranking formulas across years and what are the implications for interpreting shifts in a school's rank over time?
1.
How precise is the overall score that U.S. News uses to rank schools and what are the implications for assigning schools to discrete ranks?
2.
Methods and Results
Tracking Changes in Ranking Formulas across Years
In order to gauge the extent of change in the U.S. News ranking formulas over time, year-to-year changes to the indicators used in each formula were tracked across rankings published between 1995 and 2000 inclusive. Four types of changes were identified and tracked over this six-year period: changes in the weight assigned to an indicator; the removal of an indicator from a formula; the addition of an indicator to a formula; and, changes in an indicator's definition or methodology. Rankings examined included business, education, engineering, law, and medicine/primary-care at the graduate level and national university and national liberal arts college at the undergraduate. Changes in weights, methodology, and the addition or removal of indicators were generally easy to track, although it was not possible to fully track changes in weights at the undergraduate level as this information was not included until the 1998 edition of the guidebook. Changes in indicator definition were harder to identify as the wording for a definition could differ from one year to the next, while the underlying meaning might not. The following rule was used to identify an indicator definition change:
The new wording must contain additional detail such as a date, money amount, percent, or other precise information not previously stated or implied.
1.
If the new wording does not include such detail, it should be recognized as changed by U.S. News in the guidebook text.
2.
Analyses focused on the types of changes that were made to the formula for each ranking, the total number of these changes across time, the proportion of non-change in each ranking formula, and the extent to which the amount of change in a ranking formula was related to the amount of movement in the relative ranks for schools in that ranking across the same time period. Table 1 summarizes changes in the indicators used for each ranking from 1995 to 2000. The
number of changes for each ranking, by type and overall, is shown in columns two through eight. The national university and national liberal arts college changes are shown in one column as they use the same formula. The final column in Table 1 reflects the total number of changes across all seven rankings (i.e., business, education, engineering, law, medical, national university/liberal arts, and primary care), again broken down by type.
Table 1
Changes in
U.S. News
Ranking Indicators, 1995-2000
Business Education Engineering Law Medical NationalUniversity/ Liberal Arts Primary Care Total Definition/ Methodology 4 (50)* 4 (67) 3 (37.5) 10 (72) 4 (100) 4 (50) 3 (60) 32 (60) Weight 3 (37.5) 2 (33) 3 (37.5) 1 (7) 0 2 (25) 2 (40) 13 (25) Addition 0 (0) 0 (0) 1 (12.5) 1 (7) 0 1 (12.5) 0 3 (6) Removal 1 (12.5) 0 (0) 1 (12.5) 2 (14) 0 1 (12.5) 0 5 (9) Total 8 (100) 6 (100) 8 (100) 14 (100) 4 (100) 8 (100) 5 (100) 53 (100) *Column percentages are in parentheses.
Most changes were weight or definition/methodology changes, comprising 85 percent of all changes occurring over the six editions. Very few indicators were added to or removed from the ranking formulas, suggesting that U.S. News generally retained the same set of indicators for each ranking, but consistently refined and redefined these indicators over the years. (Of course, this redefining process can also change an indicator substantially).
The rate of change varied widely across rankings. While most rankings averaged between 6 and 8 formula changes over the six editions, the law rankings experienced 14 and the medical rankings only 4 changes over the same period. Several reasons account for the larger number of changes in the law ranking's indicators, including U.S. News' responses to the complaints of law schools (who tend to complain more than other schools) and the release of new types of quality-related
information by the American Bar Association.
While a ranking (e.g., the law rankings) may have experienced a large number of changes relative to other rankings, these changes may be concentrated in a small group of indicators that are constantly being refined. Different rankings of schools also use different numbers of indicators to compute their overall score, and thus two rankings that experience the same types and number of changes may differ in the number of indicators left unchanged overall. Figure 1 shows the proportion of unchanged indicators for each ranking between 1995 and 2000 inclusive.
Figure 1. Proportion of Indicators Remaining Unchanged in Each US News Ranking, 1995-2000.
The undergraduate rankings (both national university and national liberal arts college) have the largest proportion (.73 approximately) of unchanged indicators. In contrast, only about one third of the law school indicators remained unchanged. For most rankings, about half to two thirds of the indicators remained unchanged over the six editions. This suggests that while it may not be always possible to interpret changes in a school's overall rank across years, it is possible to track
performance on individual indicators that have remained unchanged across the years. Most of the unchanged indicators are related to selectivity (e.g., test scores and the proportion of applicants accepted into the program) and institutional resources (e.g., student-faculty ratios).
In Table 2, an X indicates when it is possible to make cross-year comparisons for a ranking. The criteria used to make this determination include the four types of indicator changes discussed above as well as more general formula changes. The latter occurred twice over the six editions examined here: In 1998 when overall scores were rounded to the nearest whole number, and in 1999 when a school's performance on each indicator was standardized before obtaining the overall rank score. While it was not possible to make cross-year comparisons for most rankings over the six years, the last column in Table 2 suggests that the ranking formulas may be stabilizing. Between 1999 and 2000, there were no changes in the formulas used to rank schools of education, engineering, law, and medicine, suggesting that change in a school's rank between 1999 and 2000 could be
interpreted in terms of change in its relative academic quality.
Table 2
Ability to Make Comparisons Across Years for a Ranking, 1995-2000
Ranking 1995-1996 1996-1997 1997-1998 1998-1999 1999-2000 Business X Education X Engineering X Law X Medical X X XNational Liberal Arts National University
Primary Care X X
It is important to remember that even when a formula appears to remain stable across years, there can still be difficulties with cross-year interpretation of ranks. This is due to problems with the accuracy of the information obtained and critics have pointed out several errors that have arisen due to mistakes (both accidental and deliberate) in reporting by institutions, and due to the differing ways in which schools compute figures for certain indicators (Machung, 1998, Smetanka, 1998, Stecklow, 1995, Wright, 1990-91). U.S. News has tried to reduce the error introduced by these practices by cross-checking data sent in by schools with data collected by debt-rating agencies, investors and national organizations such as the National Collegiate Athletic Association, and tightening up their survey questions, but issues still remain.
The final stage of the comparability analysis examined the extent to which the amount of change in a ranking formula is related to the amount of movement in schools' ranks for that ranking across years. Table 3 shows the correlation (r) between the 1995 and 2000 ranks for the top-fifty schools in each ranking in 1995.
Table 3
Correlation between 1995 and 2000 Ranks for the
Top-Fifty Schools in 1995, By Ranking
Ranking Correlation (r) Business .89 Education .72 Engineering .88 Law .92 Medicine .88 National Universities .95 National Liberal Arts College .94
Primary Care .08
There is no definite relationship between the amount of change in the indicators for a ranking and the correlation between the 1995 and 2000 ranks for the top-fifty ranked schools in 1995. For example, while law schools experienced the most change in their indicators over the six editions of
U.S. News, there was not much difference (r = .92) in the rank ordering of the top-fifty law schools in 1995 and their ordering in 2000. While varying amounts of change was experienced in the indicators used for the other rankings, they still show a high degree of similarity (with r's between .88 and .95) in the rank ordering of their top 50 schools in 1995 and 2000. The main exceptions to this are the education (r = .72) and primary-care (r = .08) rankings. The low correlation between the primary-care rankings in 1995 and 2000 can be explained by changes in the population of schools that U.S. News included in these rankings during this time period. In contrast, the low (relative to the other rankings) correlation between the 1995 and 2000 ranks of the top-fifty schools of education in 1995 is linked to the fact that 16 of the top 50 schools in 1995 had experienced large changes in rank–of ten or more–by the 2000 edition. Table 4 shows the 16 schools of education.
The first six schools all experienced a decline in rank, ranging from a drop of 10 places for the University of Southern California and the University of Iowa to a drop of 22 places for Syracuse University. The remaining schools all improved their rank since 1995. Improvement ranged from an increase of 10 places for the Rutgers University to a jump of 30 places for Arizona State University.
Table 4
Schools of Education with the Biggest Differences in
U.S. News
Rank between 1995 and 2000
aSchool Rank Change in Rank
Between 1995 and 2000 1995 1996 1997 1998 1999 2000 University of Iowa 20 22 14 15 27 30 -10 University of Southern California 23 27 26 30 31 33 -10 University of Georgia 15 10 15 19 18 26 -11 SUNY-Buffalo 39 45 43 47 46 Not Ranked At least -12
Boston University 31 37 32 43 Not
Ranked 46 -15 Syracuse University 28 41 46 45 46 50 -22 Rutgers State University-New Brunswick 49 33 29 30 33 39 +10 University of Minnesota-Twin Cities 25 7 9 11 10 14 +11 University of Pittsburgh, Main Campus 44 Not Ranked 43 34 37 33 +11 Temple University 33 30 34 28 20 20 +13 George Washington University 45 39 37 30 34 30 +15 University of Michigan-Ann Arbor 22 9 8 6 8 7 +15 University of North Carolina-Chapel Hill 32 32 31 28 22 17 +15 University of Texas-Austin 27 19 12 13 11 12 +15
New York University 40 28 23 19 16 12 +28
Arizona State
University-Main Campus
47 29 39 27 24 17 +30
2000 edition.
Cross-year data for the top-fifty schools in 1995 in other rankings were also examined to assess the extent to which similar movements in rank occurred (only data for the top 25 schools of
medicine/primary-care and the top 40 national liberal arts colleges were available). Only nine business schools, one engineering school, eight law schools, no medical or primary-care schools, three national liberal arts colleges and two national universities differed by ten or more places in their 1995 and 2000 ranks.
It is not clear why there was more movement among schools of education compared to other types of schools. If changes in indicators (i.e., weight, definition, or other changes) are not responsible, movement could be due to changes in schools' performance on the indicators or errors or
inconsistencies in the information reported by schools. Unfortunately, it is difficult to identify the real reasons for these movement patterns among schools of education over time, as well as why these differ from other rankings, as U.S. News did not print much information on schools' performance on the individual indicators until 1999.
Estimating Error or Uncertainty around the Overall Score
There is no universally agreed-upon set of information for creating academic quality rankings. Thus, various ranking efforts use indicators that differ in whole or in part from those used by others even when attempting to rank the same schools. It is not difficult to imagine that slight changes in the set of indicators used–such as the addition or removal of a single indicator–may move a school up or down a ranking, depending on how it performs on the indicator relative to other schools. To gauge the effect of slight changes in the set of indicators on the stability of the overall score and subsequent ranking for a school, a technique called jackknifing (Efron and Tibshirani, 1993) was applied to the data for the top-50 schools in each of the 2000 business, education, law, national liberal arts college, and national university rankings. (Note 4)
First, a baseline regression model was created for each of the rankings, with schools' overall scores as the dependent or outcome variable and the indicators used for each ranking as the independent or predictor variables. The overall fit of the model to the data was assessed in terms of the adjusted R Squared. Values of .9 and above were considered a good fit, meaning that the overall score
predicted by the model for a school was highly correlated with the score produced by U.S. News'
ranking formula, and that the regression model was an effective substitute for the weights-and-sum formula used by U.S. News. All models met this criterion, with adjusted Rs Squared varying between .99 for the national liberal arts college and national university models, .98 for the business school and law school models, and .95 for the education school model. (Note 5)
An approximation to a standard error for each school's overall score was obtained using the following formula (Efron and Tibshirani, 1993): (Note 6)
The removal of one indicator at a time for the jackknife regression models did not seem to affect substantially the overall adjusted R Squared in most instances. For example, for each of the 9 models estimated using the law school data, the adjusted R Squared never varied by more than .01 from the adjusted R Squared for the overall model (i.e., .98), suggesting that the indicators are contributing fairly similar information to the estimation of the overall score. As a result, the jackknife standard errors are quite small, varying, in the case of law schools, from a low of .74 for the University of Michigan, Ann Arbor to a high of 3.06 for Harvard University. A similar range of standard error values was obtained for all rankings except for schools of education. The regression model for schools of education was not as robust to changes in indicators and the adjusted R
Squared dropped considerably (by .13) when one indicator in particular—Research
Expenditure—was removed. The resultant jackknife standard errors for schools of education are therefore quite large, varying from a low of 1.78 for Stanford University to a high of 11.98 for the University of Southern California.
Differences in the standard errors for individual schools are due to differences in how the removal of different indicators from the equation affects the prediction of their overall score. For schools that have large standard errors, the removal of certain indicators makes it much harder to predict the overall score they received from U.S. News. For school with smaller standard errors, the removal of indicators does not appreciably reduce the precision of estimation of their overall score. This suggests that schools are differentially affected by the presence or absence of certain indicators in terms of their overall score and subsequent rank.
This error estimate was then used in a t-test to assess the extent to which one school's overall score was significantly different from that of another. The t-test formula employed was: (Note 7)
The results of these comparisons are summarized in Tables 5 through 9 which are in the form of Excell spreadsheets. In each table, schools are ordered by their overall ranking score across the heading and down the rows. Read across the row for a school in order to compare its performance with the schools listed in the heading of the chart. The symbols indicate whether the overall score of the school in the row is significantly lower than that of the comparison school in the heading (arrow pointing down), significantly higher than that of the comparison school (arrow pointing up),
or if there is no statistically significant difference between the two schools (circle). The blank diagonal represents where a school is compared against itself.
If there were no error around the overall scores for schools, Tables 5 through 9 would only consist of arrows pointing up and down, except for instances where two schools have the same overall score and are tied for rank. This is not the case. For example, in the business school rankings
comparison table (Table 5) Harvard is listed first in the row and heading as it has the highest overall score among business schools. However, reading across the row, it appears that Harvard's overall score of 100 is not significantly different from that of nine other schools that are ranked beneath it. These include Stanford, which is tied for first rank with Harvard with an overall score of 100, and University of California, Berkeley, ranked tenth with a score of 90. Only schools ranked below tenth have scores that are significantly lower than Harvard's.
Tables 5 - 9
Statistical Significance of Comparisons of Overall Scores
in Five Areas (Data in the Form of Excell Spreadsheets)
Table 5: Business
Table 6: Education
Table 7: Law
Table 8: Liberal Arts
Table 9: National Universities
In general, when the overall score for a school is compared to that of every other school in its ranking (top-fifty schools only), three groups emerge: schools that score significantly higher, schools that score significantly lower, and schools with scores that are not significantly different. This pattern is consistent across all the comparison tables. For example, among the business
schools in Table 5, three distinct groupings emerge. The first group comprises 10 schools at the top of the rankings, extending from first-ranked Harvard to tenth-ranked University of California, Berkeley. These schools have scores that are not significantly different from each other but that are significantly higher than all other schools' scores. The second grouping extends from
eleventh-ranked Dartmouth, University of California Los Angeles, and the University of Virginia to nineteenth-ranked Carnegie Mellon. These schools have scores that are not significantly different from each other but that are significantly lower than the top-ranked schools in the first group and significantly higher than the lower-ranked schools in the third grouping. The third group is the largest. It comprises 31 schools, extending from twentieth-ranked Indiana University to forty-eighth-ranked University of Georgia, University of Illinois-Urbana Champagne, and the University of Notre Dame. These schools all have scores that are not significantly different from each other but that are significantly lower than the scores of schools in the first two groups.
This three-groupings pattern is evident for all rankings except schools of education. There are only two groupings evident in Table 6. The first group comprises the top-three-ranked schools of education—Harvard University, Stanford University, and Teacher's College/Columbia University. These schools have scores that are not significantly different from each other but that are
significantly higher than the scores for almost all other schools in the top fifty. The second group of schools extends from fourth-ranked University of California-Berkeley to the four schools tied for fiftieth rank. These schools all have scores that are not significantly different from each other but that are significantly lower than the scores of most schools in the top group. This two-grouping effect occurs because schools of education are more sensitive to changes in the indicators used than other types of schools. This results in larger standards errors around their overall score and fewer significant differences between the scores of neighboring schools.
Conclusions and Recommendations
The results of these analyses show that, given the number and annual nature of changes to each ranking formula, it is generally not possible to interpret year-to-year shifts in a school's rank in terms of change in its relative academic quality. Depending on the ranking, it is possible to make cross-year comparisons of a school's relative performance on between a third to three-quarters of the individual indicators used. While not experiencing much change to their ranking formula over time, schools of education have experienced markedly more movement in their ranks than other schools. It is not evident why this has occurred or what it says about the U.S. News rankings as a measure of the relative quality of these schools. The overall rate of change in the ranking formulas appears to be slowing and it was possible to make cross-year comparisons of schools' ranks for almost all rankings between 1999 and 2000.
The results of the error analyses call into question the use of overall scores to assign schools to individual ranks. The analyses show that when interpreting scores for school with the aid of their standard errors, precision blurs and schools start to group in bands rather than discrete ranks. The results confirm the critics' sense of unease at the precision of a single score, particularly in the case of the education rankings.
At least five recommendations can be made for improving the interpretability and usefulness of the
U.S. News rankings.
First, U.S. News needs to stabilize their ranking methodology. This is particularly important since the rankings are annual in nature and imply some kind of comparability. A related issue to consider is whether the rankings need to be annual in nature. While there is an obvious commercial value to annual rankings, particularly one that keeps changing the winners, it is doubtful whether there is an educational or consumer value.
1.
Second, U.S. News needs to recognize the uncertainty around schools' overall scores. The results of this analysis suggest that it would be more accurate to group schools in bands than to assign them discrete ranks. This approach would avoid the misleading effect that small changes in a school's rank from year to year produces in terms of the public perception's of its academic quality.
2.
Third, the schools of education rankings need to be reassessed since they do not seem to "hold together." Better comparisons might emerge if they were divided into two more conceptually coherent groups (e.g., those that are primarily research oriented and those that are primarily teacher-training oriented.) U.S. News already does this for schools of
medicine—i.e., there is an overall ranking of medical schools as well as a ranking of schools that focus on the training of primary-care physicians.
3.
Fourth, in order to be accountable to consumers, U.S. News needs to make available all data used to create the rankings. Currently, US News only publishes information for the
top-ranked schools and less or no information on lower-ranked schools. While space constraints may make it difficult to publish this information in the magazine, no such restrictions apply on the US News website.
A final general recommendation is that U.S. News should adopt a model similar to that used by Consumer Reports for reporting its quality ratings. Consumer Reports rates products, but does not allow the product manufacturers to use these ratings in their advertising. Similarly,
U.S. News should not allow schools to use their ratings in their promotional materials or other advertising. This approach might relieve some of the tension and debate that currently
surrounds the rankings and make their annual arrival on newsstands a less stressful event for the higher education community.
5.
Notes
1. The term "rankings," as used in this artcles, refers to a list of schools or universities that are ordered according to their overall score on a formula created by U.S. News. Thus, the business rankings are a list of business schools ordered according to their overall score on a formula that
U.S. News uses to rank graduate schools of business, and the national university rankings are a list of schools ordered according to their overall score on a formula that U.S. News uses to rank national universities. The year appended to a ranking is the calendar year in which it was released, i.e., the 2000 education rankings were published in the year 2000.
2. It is worth noting that several of these indicators—such as test scores, reputation, research expenditure, and faculty awards—have been used traditionally to measure quality (Hattendorf, 1993: Webster, 1986). The U.S. News rankings differ from most other rankings in that they assign weights to these indicators in order to combine them and produce a composite score.
3. The full text of this letter is available at:
http://www-portfolio.stanford.edu:8050/documents/president/961206gcfallow.html 4. No data was available for schools below the top-50 for most of the rankings.
5. U.S. News does not make available in its magazine or on its website all the data it uses to rank schools, nor is this information available on request. On average, each ranking is missing
information on two or three indicators. This was not a problem for this analysis, since the available indicators, as indicated by the adjusted R Squared values, almost perfectly replicated the overall scores produced by U.S. News. Thus, very little information was lost.
6. While the "error estimate" obtained is not strictly a standard error, since the indicators are not randomly sampled, it may still be viewed as a general indication of the uncertainty around an overall score due to changes in the indicators used to compute that score. In addition, it is probably a conservative estimate of the uncertainty around scores as the indicators chosen by U.S. News tend to be highly correlated. A random sample from the population of indicators would probably be less highly correlated, which would result in larger standard errors around schools' overall scores. 7. Since there are, on average, 50 schools in each ranking, around 49 t-test comparisons were made for each school in the rankings. In order to control for the increased probability of a significant finding due to chance alone, a Bonferroni adjustment was applied.
8. For more information see http://www.usnews.com/usnews/edu/college/corank.htm
9. U.S. News uses a modification of the classification system developed by the Carnegie Foundation for the Advancement of Teaching in order to classify colleges and universities. The Carnegie
system is a generally accepted classification system for higher education.
References
Art and Science Group, (1995). Influence of U.S. News rankings on college choice, StudentPOLL: Market Intelligence for Higher Education, 1(1).
Crenshaw, A. B. (1999). Colleges by the numbers. Washington Post, August 29, p. H01.
Efron, B., and Tibshirani, R. J. (1993). An introduction to the bootstrap. New York: Chapman and Hall.
Hattendorf, L. C. (ed.) (1993). Educational rankings annual. Detroit, MI: Gale Research Inc. Levin, S. (1999). Ignore college ranking—become an educated consumer. Washington Parent Magazine. Available at: http://www.washingtonparent.com/articles/9712/rankings.htm
Machung, A. (1998). What's at stake: College rankings and the new media. Change, July/August, pp. 13-16.
McDonough, P. M., Antonio, A. L., Walpole, M., and Perez, L. X. (1998). College rankings: Democratized knowledge for whom? Research in Higher Education, 39(5), pp. 513-37. Monks, J., and Ehrenberg, R. G. (1999). The impact of U.S. News and World Report college rankings on admissions outcomes and pricing policies at selective private institutions. Cambridge, MA: National Bureau of Economic Research.
Mufson, S. (1999). Rankings all-important to GWU. Washington Post, Sunday, March 14, P.A01. Pellegrini, F. (1999). Those bouncing college rankings—a 101. Time, August 31.
Smetanka, M. J. (1998). Magazine's new ratings on colleges don't rank high at "U." Star Tribune, February 20, p. 7B.
Stecklow, S. (1995). Cheat sheets: Colleges inflate SATs and graduation rates in popular guidebooks: Schools say they must fib to US News and others to compete effectively: Moody's requires the truth. The Wall Street Journal, Wednesday, April 5, pp. 1, A8.
Thompson, J. J., and Morse, R. J. (1998). An explanation of the U.S. News rankings: Putting the numbers into context. U.S. News and World Report America's Best Colleges 1998, p. 66-68. Webster, D. S. (1986). Academic quality rankings of American colleges and universities. Springfield, IL: Charles C. Thomas.
Wright, B. A. (1990-91). The rating game: How the media affect college admission. The College Board Review, No. 158, Winter, pp. 12-17, 31.
About the Author
Marguerite Clarke Boston College Phone: 617-552-0665 Fax: 617-552-8419 Email: [email protected]Marguerite Clarke is an Assistant Professor of Research at Boston College. She has a Ph.D. in educational research, measurement, and evaluation as well as degrees in bilingual/multicultural and elementary education. Her research interests include policy and technical issues surrounding
large-scale testing and accountability programs; the impact of testing on teaching and learning; and the relationship between test use and educational opportunity and access for different student populations.
Appendix A
Current
U.S. News
College and Graduate School Ranking Methodology
The current method that U.S. News uses to produce college rankings has three basic steps. (Note 8) First, colleges in the U.S. are placed into categories based on mission and region. (Note 9) Colleges within each category are ranked separately. Second, U.S. News collects data from each school on up to 16 separate indicators of what it believes reflects academic quality. As Table 10 indicates, each indicator is assigned a weight in the ranking formula that reflects the judgement of U.S. News about which measures of quality matter most. Column 4 of Table 10 shows the weight that each indicator (shown in column 3 of Table 10) receives within its category and column 2 shows the weight this category receives in the overall ranking formula. For example, a school's acceptance rate is 15 percent of its Student Selectivity category score or rank, and the Student Selectivity category contributes 15 percent to a school's overall score and rank.
Indicators are standardized and then combined (using weights) to produce an overall score for each school. These scores are re-scaled. The top school is assigned a value of 100, and the other schools' weighted scores are calculated as a proportion of that top score. Final scores for each ranked school are rounded to the nearest whole number and ranked in descending order. U.S. News publishes the individual ranks of only the top schools; the remainder is grouped into tiers.
Table 10
U.S. News
Indicators and Weights for the 2000 College Rankings
a Ranking Category CategoryWeight
Indicator Indicator
Weight Academic Reputation 25% Academic Reputation Survey 100%
Student Selectivity 15% Acceptance Rate Yield
High School Standing— Top 10% SAT/ACT Scores 15% 10% 35% 40%
Faculty Resources 20% Faculty Compensation Faculty With Top Terminal Degree
Percent Full-time Faculty Student/Faculty Ratio Class Size, 1-19 Students Class Size, 50+ Students
35% 15% 5% 5% 30% 10%
Retention Rate 20% Average Graduation Rate Average Freshmen Retention Rate
80% 20%
Financial Resources 10% Educational Expenditures Per Student
100%
Alumni Giving 5% Alumni Giving Rate 100%
Graduation Rate Performance
5% Graduation Rate Performance 100%
aThese indicators and weights are for the national liberal arts and national university rankings only. A similar methodology is employed for the graduate school rankings. U.S. News collects data from each program on indicators of what it believes reflect academic quality. Each indicator is assigned a weight based on U.S. News' judgment about which measures matter most. Data are standardized, and standardized scores are weighted, totaled, and re-scaled so that the top school receives 100; other schools receive a percentage of the top score. Schools are then ranked based on the score they receive.
The five major disciplines examined yearly are business, education, engineering, law, and medicine. Master's and doctoral programs in areas such as the arts, sciences, social sciences, humanities, library science, public affairs, and various health fields are ranked only by reputation and are generally evaluated every third year. The specific indicators and weights used for rankings within each of the five major disciplines are outlined in Tables 11 through 15.
Table 11
U.S. News
Indicators and Weights for the 2000 Business Rankings
Ranking Category Category Weight Indicator Indicator Weight Reputation 40% Academic SurveyNon-academic Survey
60% 40%
Placement Success
35% Mean Starting Salary and Bonus Employment at Graduation and Three Months Later
40%
20% and 40%
Student Selectivity
25% Mean Graduate Management Admission Test Scores
Mean Undergraduate Grade Point Average Proportion of Applicants Accepted
65% 30% 5%
Table 12
U.S. News
Indicators and Weights for the 2000 Education Rankings
Ranking Category Category Weight Indicator Indicator Weight Reputation 40% Academic SurveyNon-academic Survey
60% 40%
Student Selectivity
20% Average Verbal, Analytical and Quantitative GREs
Proportion of Applicants Accepted
30% each 10%
Faculty Resources
20%
Ratio of Full-time Doctoral and Master's Degree Candidates to Full-time Faculty
Percent of Faculty Given Awards
Number of Doctoral and Master's Degrees Granted in the past school year
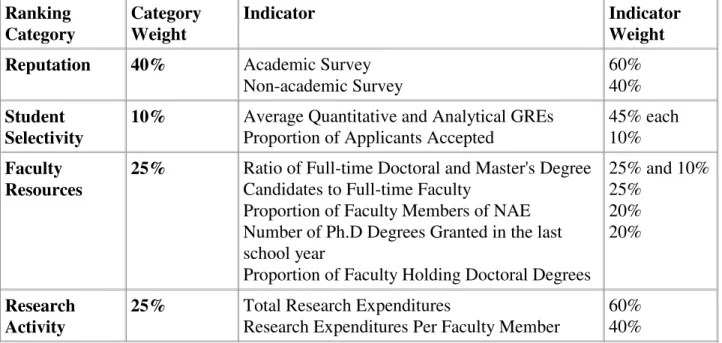
Proportion of Graduate Students Who Are Doctoral Candidates 25% and 20% 20% 15% and10% 10% Research Activity 20%
Total Research Expenditures
Research Expenditures Per Faculty Member
75% 25%
Table 13.
U.S. News
Indicators and Weights for the 2000 Engineering Rankings
Ranking Category Category Weight Indicator Indicator Weight Reputation 40% Academic SurveyNon-academic Survey
60% 40%
Student Selectivity
10% Average Quantitative and Analytical GREs Proportion of Applicants Accepted
45% each 10%
Faculty Resources
25% Ratio of Full-time Doctoral and Master's Degree Candidates to Full-time Faculty
Proportion of Faculty Members of NAE Number of Ph.D Degrees Granted in the last school year
Proportion of Faculty Holding Doctoral Degrees
25% and 10% 25% 20% 20% Research Activity
25% Total Research Expenditures
Research Expenditures Per Faculty Member
60% 40%
Table 14
U.S. News
Indicators and Weights for the 2000 Law Rankings
Ranking Category Category Weight Indicator Indicator WeightReputation 40% Academic Survey Non-academic Survey 60% 40% Student Selectivity
25% Median LSAT Scores
Median Undergraduate GPA Proportion of Applicants Accepted
50% 40% 10%
Placement Success
20% Employment Rates at Graduation and Nine Months Later
Bar Passage Rate
30% and 60% 10%
Faculty Resources
15% Average Expenditures Per Student For Instruction etc.
Student to Teacher Ratio
Average Expenditures Per Student For Financial Aid etc.
Total Number of Volumes in Law Library
65% 20% 10% 5%
Table 15
U.S. News
Indicators and Weights for the 2000 Medicine and Primary-Care (in
parentheses where different) Rankings
Ranking Category Category Weight Indicator Indicator Weight Reputation 40% Academic Survey
Non-academic Survey
50% (60%) 50% (40%)
Student Selectivity
20% Mean MCAT Scores
Mean Undergraduate Grade Point Average Proportion of Applicants Accepted
65% 30% 5%
Faculty Resources
10% Ratio of Full-time Science and Clinical Faculty to Full-time Students 100% Primary Care Rate (Primary Care Only)
30% The Percentage of MDs From a School Entering Primary-care Residencies, Averaged Over 1997, 1998, and 1999 100% Research Activity (Medicine only)
30% Total Dollar Amount of National Institutes of Health Research Grants Awarded to the Medical School and its Affiliated Hospitals, Averaged for 1998 and 1999
100%
Copyright 2002 by the Education Policy Analysis Archives
The World Wide Web address for the Education Policy Analysis Archives is epaa.asu.edu
General questions about appropriateness of topics or particular articles may be addressed to the Editor, Gene V Glass, [email protected] or reach him at College
of Education, Arizona State University, Tempe, AZ 85287-2411. The Commentary Editor is Casey D. Cobb: [email protected] .
EPAA Editorial Board
Michael W. Apple University of Wisconsin
Greg Camilli Rutgers University John Covaleskie
Northern Michigan University
Alan Davis
University of Colorado, Denver Sherman Dorn
University of South Florida
Mark E. Fetler
California Commission on Teacher Credentialing Richard Garlikov [email protected] Thomas F. Green Syracuse University Alison I. Griffith York University Arlen Gullickson
Western Michigan University Ernest R. House
University of Colorado
Aimee Howley Ohio University Craig B. Howley
Appalachia Educational Laboratory
William Hunter University of Calgary Daniel Kallós Umeå University Benjamin Levin University of Manitoba Thomas Mauhs-Pugh
Green Mountain College
Dewayne Matthews
Education Commission of the States William McInerney Purdue University Mary McKeown-Moak MGT of America (Austin, TX) Les McLean University of Toronto
Susan Bobbitt Nolen University of Washington Anne L. Pemberton [email protected] Hugh G. Petrie SUNY Buffalo Richard C. Richardson
New York University
Anthony G. Rud Jr. Purdue University Dennis Sayers
California State University—Stanislaus
Jay D. Scribner
University of Texas at Austin Michael Scriven
Robert E. Stake
University of Illinois—UC Robert Stonehill
U.S. Department of Education
David D. Williams Brigham Young University
EPAA Spanish Language Editorial Board
Associate Editor for Spanish LanguageRoberto Rodríguez Gómez
Universidad Nacional Autónoma de México
Adrián Acosta (México) Universidad de Guadalajara [email protected]
J. Félix Angulo Rasco (Spain) Universidad de Cádiz
[email protected] Teresa Bracho (México)
Centro de Investigación y Docencia Económica-CIDE
bracho dis1.cide.mx
Alejandro Canales (México) Universidad Nacional Autónoma de México
[email protected] Ursula Casanova (U.S.A.)
Arizona State University [email protected]
José Contreras Domingo Universitat de Barcelona [email protected] Erwin Epstein (U.S.A.)
Loyola University of Chicago [email protected]
Josué González (U.S.A.) Arizona State University [email protected]
Rollin Kent (México) Departamento de Investigación Educativa-DIE/CINVESTAV [email protected] [email protected]
María Beatriz Luce (Brazil)
Universidad Federal de Rio Grande do Sul-UFRGS
[email protected] Javier Mendoza Rojas (México)
Universidad Nacional Autónoma de México
Marcela Mollis (Argentina) Universidad de Buenos Aires [email protected]
Humberto Muñoz García (México) Universidad Nacional Autónoma de México
Angel Ignacio Pérez Gómez (Spain) Universidad de Málaga [email protected] Daniel Schugurensky (Argentina-Canadá) OISE/UT, Canada [email protected]
Simon Schwartzman (Brazil)
Fundação Instituto Brasileiro e Geografia e Estatística
[email protected] Jurjo Torres Santomé (Spain)
Universidad de A Coruña [email protected]
Carlos Alberto Torres (U.S.A.) University of California, Los Angeles [email protected]